Download presentation
Presentation is loading. Please wait.

1
Sentinel: Dynamic Fire Location Mapping

2
Near- Real Time Emergency Mapping Environmental Remote Sensing Group CSIRO Land and Water Defence Imagery & Geospatial Organisation ‘Sentinel’ Satellite Mapping of Fire Hotspots

3
Collaborators Funding Defence Imagery and Geospatial Organisation (DIGO) Imagery Geoscience Australia (GA) Implementation CSIRO Using NASA and University of Maryland algorithms Based on GeoMAC fire site hosted by the USGS.
 Imagery Geoscience Australia (GA) Implementation CSIRO Using NASA and University of Maryland algorithms Based on GeoMAC fire site hosted by the USGS.")
4
DIGO’s needs § Support Defence personnel deployed in civil emergencies § Continental solution § Identified MODIS data as a possible solution

5
Key Requirements All Australia Hotspot Mapping by December 2002 Satellite to Website in One hour. MODIS sensor selected for it’s dynamic range it’s revisit frequency Terra and Aqua platforms

6
Key Requirements Background imagery for context underneath the ‘hotspots’ by 6 am AEST (18:00 UTC). Maps with fire locations delivered as electronic graphic images (web map interface) faxable B/W map products email data distribution.
 faxable B/W map products data distribution..")
7
“SENTINEL” Project Daily Hotspot Detection Example January 1 – 24 ‘02 Dec. 26 – Jan. 10 Sequential days in different colours

8
ASTER Launched December 18,1999 MODIS CERES MISR MOPITT Terra Satellite

9
NASA, Terra & Aqua launches 1999, 2002 705 km polar orbits, descending (10:30 a.m.) & ascending (1:30 p.m.) Sensor Characteristics 36 spectral bands ranging from 0.41 to 14.385 µm cross-track scan mirror with 2330 km swath width Spatial resolutions: 250 m (bands 1 - 2) 500 m (bands 3 - 7) 1000 m (bands 8 – 36) 2% reflectance calibration accuracy onboard solar diffuser & solar diffuser stability monitor MODerate-resolution Imaging Spectroradiometer (MODIS) http://modis.gsfc.nasa.gov/
 & ascending (1:30 p.m.) Sensor Characteristics 36 spectral bands ranging from 0.41 to µm cross-track scan mirror with 2330 km swath width Spatial resolutions: 250 m (bands 1 - 2) 500 m (bands 3 - 7) 1000 m (bands 8 – 36) 2% reflectance calibration accuracy onboard solar diffuser & solar diffuser stability monitor MODerate-resolution Imaging Spectroradiometer (MODIS)")
10
MODIS Synoptic Coverage June 24, 2002 (images courtesy of the NASA MODIS Science Team) Aqua image three hours laterTerra image
 Aqua image three hours laterTerra image")
11
Other Natural Events that require sub-daily Monitoring & Tracking Dust Cloud October 23, 2002 10:05 am (Terra) 1:35 pm (Aqua)
 1:35 pm (Aqua)")
12
Other Natural Events that Require Daily Monitoring & Tracking Typhoon Silaku off Japan Sept. 4/2002 Phytoplankton Blooms Gulf of St. Vincent, Feb. 19, 2002

13
Implementation Peter Dyce & Alan Marks CSIRO Land and Water

14
Hotspot Locations are generated by combining information from several MODIS bands. HOTSPOT DETECTION

15
ACRES Data Acquisition Facility Alice Springs Image Processing: Conversion of signal to imagery Geolocation. Calibration. Fire Product Processing Fire Location point extraction HOTSPOT Linux server Image Reception Image received by X-Band Receiver Data Transferred as a text file to Canberra via secure copy protocol INFRASTRUCTURE…

16
Canberra SDE-bu GIS database Incorporation into GIS Data reformatted Imported into Geodatabase Database processes queries from the Map Server and data returned. IMS-bu Map Server Map Making Map Server receives requests from Web Server Queries made GIS Layers and Imagery combined to generate maps which are sent to the Web Server Web Server Web Map Serving Web Server receives requests from clients (user browsers) Requests Passed to the Map server Maps served to the clients INFRASTRUCTURE…
 Requests Passed to the Map server Maps served to the clients INFRASTRUCTURE….")
17
+ Hotspot data file Hotspot data map layer Geographic Data provides context. = -19.525,147.465,322.6,1.0,1.0 -19.527,147.475,331.0,1.0,1.0 -19.703,145.773,333.0,1.1,1.0 -20.023,145.398,332.1,1.1,1.0 -20.566,148.250,330.5,1.0,1.0 -20.293,146.196,330.7,1.0,1.0 -20.294,146.206,342.2,1.0,1.0 -20.296,146.216,342.7,1.0,1.0 -20.250,145.858,329.5,1.1,1.0 -20.305,146.214,330.0,1.0,1.0 -20.261,145.867,330.3,1.1,1.0 -20.314,146.213,331.3,1.0,1.0 -20.315,146.223,337.1,1.0,1.0 -20.325,146.221,332.5,1.0,1.0 -20.595,145.525,330.7,1.1,1.0 -20.669,145.464,332.4,1.1,1.0 -20.935,145.180,365.2,1.1,1.0 PRODUCTS…

18
Internet Canberra Internet Dissemination

19
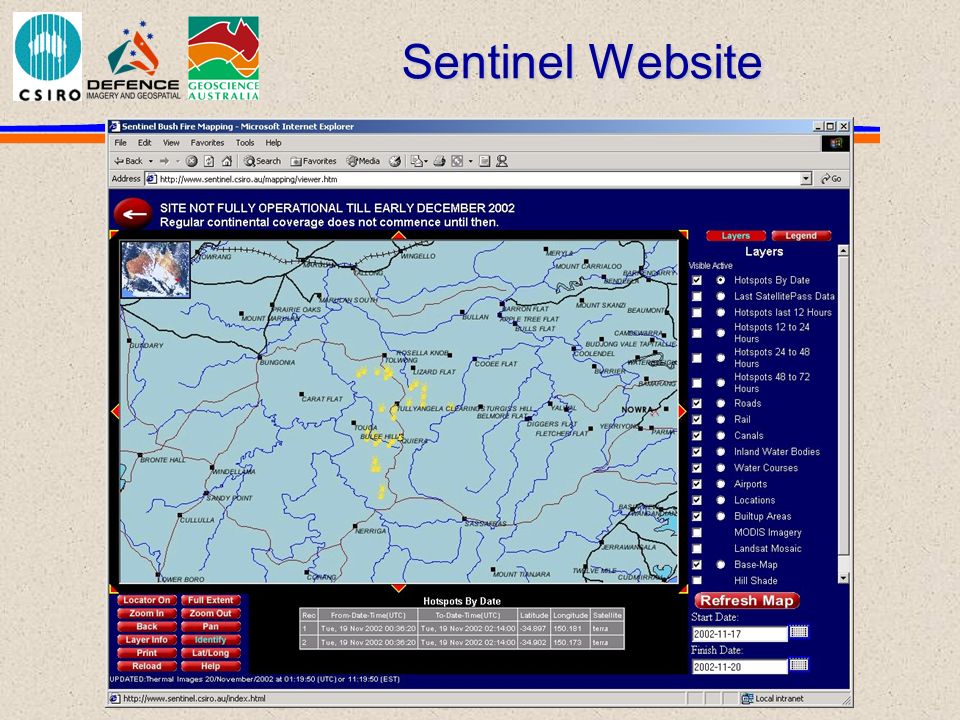
The SENTINEL Bushfire Website www.sentinel.csiro.au

20
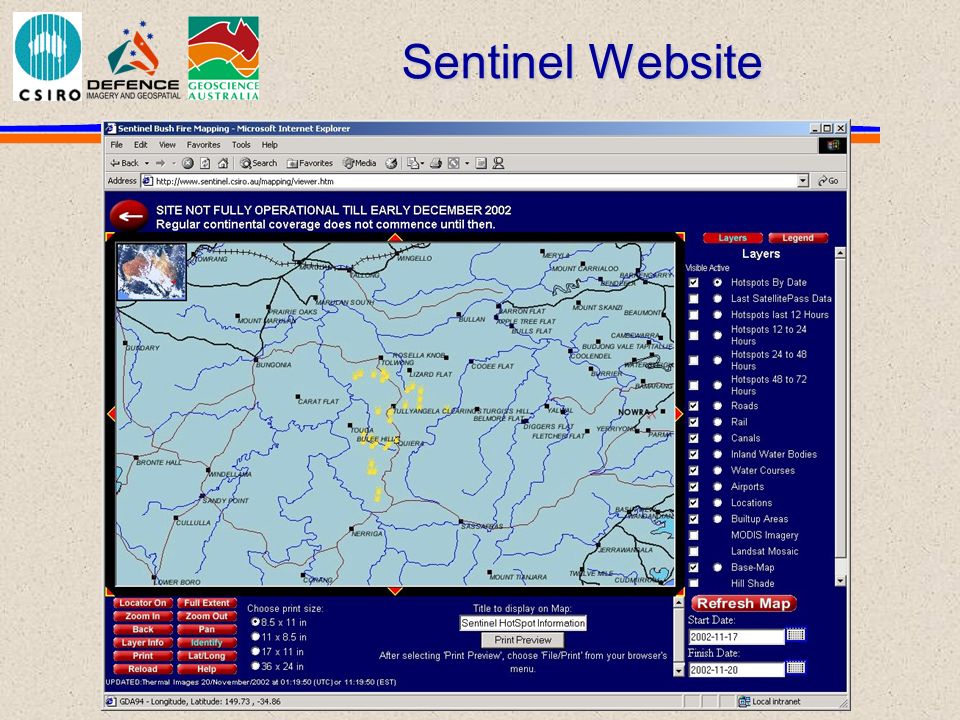
Web Maps are Dynamic. Fire Locations are displayed in relation to other Geographic data Maps are rendered and displayed on according to user interaction Contextual layers can be added or removed. Maps can be panned and zoomed. Maps Layers are scale sensitive providing more information at large scales without cluttering the display at small scales.

21
Sentinel Website - links

22
Sentinel Website - Links

23
Sentinel Website

29
Future Earth Observing System Concept SENTINEL AUSTRALIA FireMapLandCamCoastCam RiverCam Linkages: : DIGO EMA RFS E-Australia FP HC-FP NRM Landcare Rainforest CRC ‘Wealth from Oceans’ Coastal Managers HC-FP Fisheries/Aquaculture Rainforest-Reef Joint Bid MDBC NRM Boards SugarCam QSL Canegrowers, Mills ReefCam GBMPA/AIMS Delivery System: Top Level Projects: Specialised Projects:

Similar presentations


 M. Fujita, T. Tachikawa, M. Kato, H. Tsu ( ERSDAC, Japan), M.J. Abrams, L. Maldonado.>")


>")


 A demonstration space mission dedicated to land surface environment (Vegetation and Environment New.>")


