Download presentation
Presentation is loading. Please wait.

1
Drivers of Health Spending Growth and the Sustainability of Three Major Social Health Insurance Programs in the Long Run Junqiang LIU, Professor SYSU liujq26@mail.sysu.edu.cn

2
Combined coverage

3
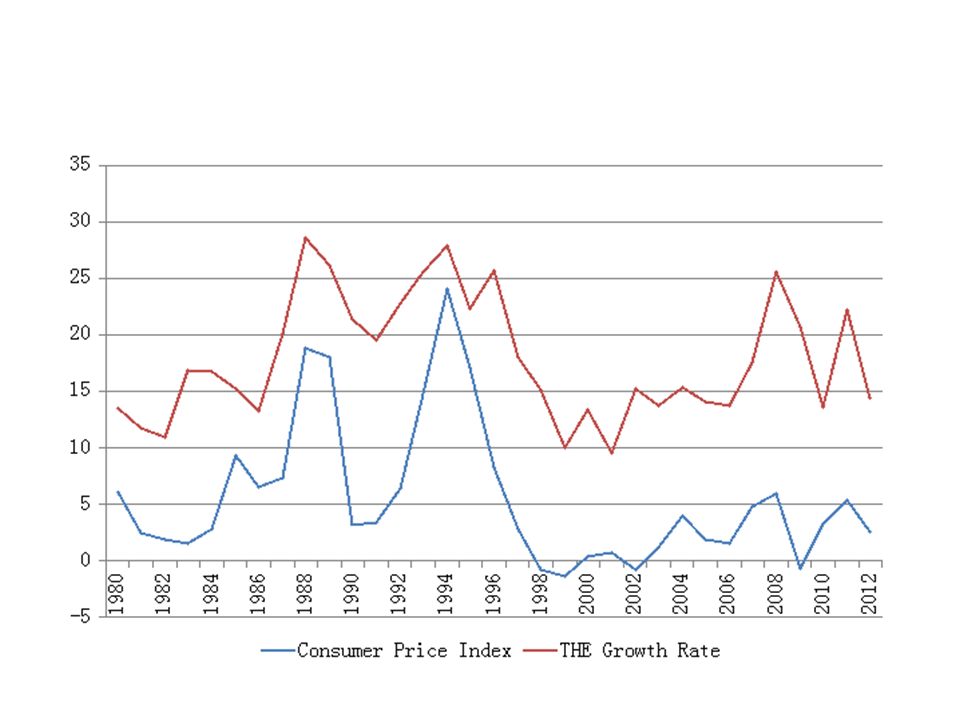
Growth Trend of THE

4
If this trend holds------- THE is predicted to reach: RMB 10326 billion in 2020, RMB 53136 billion in 2030, RMB 273429 billion in 2040.

5
Sustainability Looking back: health cost growth in the past three decades. Look beyond: what will happen to BHIE, BHIR and NCMS? Policy options: How effective are they?

6
1. Dynamics of health cost growth Decomposition method P t+1 * Q t+1 – P t * Q t = (P t+1 * Q t+1 – P t+1 * Q t ) + (P t+1 * Q t – P t * Q t ) = P t+1 * (Q t+1 – Q t ) + (P t+1 – P t ) * Q t = P t+1 * ΔQ + ΔP * Q t
 + (P t+1 * Q t – P t * Q t ) = P t+1 * (Q t+1 – Q t ) + (P t+1 – P t ) * Q t = P t+1 * ΔQ + ΔP * Q t.")
7
Measurements Scope of research: Chinese hospitals Price: the average cost of inpatient and outpatient services as their prices. Utilization: the number of outpatient services provided by hospitals divided by population. We adjust the inflation using the consumer price index, and all amounts are presented in 2012 RMB.

8
Proportion of medical spending paid to hospitals in THE

9
Inpatient services

10
Outpatient services

12
Average utilization levels

13
Explanations 1. health insurance coverage (1) rural areas (2) urban areas 2. health reform: (1) financial incentives (2) government contribution to hospitals (3) compensation method
 financial incentives (2) government contribution to hospitals (3) compensation method.")
14
Proportion of uninsured people, % Year UrbanRuralOverall 199327.384.169.9 199844.187.376.4 200350.479.077.9 200828.17.512.9 Source: Center for Health Statistics and Information of Ministry of Health, 2004, 2010.

16
Structure of hospital revenues

17
Composition of outpatient service spending

18
2. Why Actuarial Projection? 1. Simulating & estimating the cash flow of basic health insurance fund in the future and proving warning for the health insurance fund. 2. If the health insurance fund will incur surpluses in the future, the government can adjust the policies in advance and estimate the impact of each policy. 3. Doing actuarial projection can ensure the solvency of health insurance fund and improve the sustainability of health insurance system.

19
Actuarial Hypothesis 1. The starting age for participating in BHIE, BHIR and NCMS are set at 20, 0 and 0 respectively. The maximum age for all three programs is set at 100. 2. The retirement ages are set at 60 for males and 55 for females. 3. The administration cost of the three programs is covered by governmental budget. 4. We assume that BHIE has a block model design, which means that the medical savings accounts (MSAs) cover outpatient costs and social pooling funds cover inpatient costs. In this study, we only analyze the social pooling funds of BHIE. Similarly, we only consider the social pooling funds of BHIR and NCMS. 5. The reimbursement rates of the three programs are assumed to be constant at current levels. 6. Models cover a period that starts in 2013 and ends in 2060.
 cover outpatient costs and social pooling funds cover inpatient costs. In this study, we only analyze the social pooling funds of BHIE. Similarly, we only consider the social pooling funds of BHIR and NCMS. 5. The reimbursement rates of the three programs are assumed to be constant at current levels. 6. Models cover a period that starts in 2013 and ends in")
20
Actuarial Models 1. The revenue-expenditure forecasting model (1) That for BHIE (2) That for BHIR (3) That for NCMS It is similar to that of BHIR
 That for BHIE (2) That for BHIR (3) That for NCMS It is similar to that of BHIR.")
21
Actuarial Models 2. Models for accumulated surpluses/deficits (1) If the accumulated surpluses is positive (2) If there is no accumulated surpluses
 If the accumulated surpluses is positive (2) If there is no accumulated surpluses.")
22
Calculation of related parameters 1. Covered people in each insurance program 2. Premium rate 3. The growth rate of wage per captia 4. The growth rate of inpatient medical expenditure in each insurance program

23
Covered people Method: cohort component method

24
Covered people-continued

25
Premium rate 1. BHIE: premium rate is 6.74% (real premium rate). 60% of the total premiums is going into the social pooling fund. 2. BHIR: premium is 322 RMB per captia in 2012. It will increase 45 RMB per year. 3. NCMS: premium is 308 RMB per captia in 2012. It will increase 50 RMB per year.

26
The growth rate of wage per captia 2013-2020: 8% 2021-2030: 7% 2031-2040: 6% 2041-2050: 5% 2051-2060: 4%

27
The growth rate of inpatient medical expenditure Method: “growth factor” method developed by Mayhew (2000)
")
28
Financial status of BHIE YearRevenueExpenditure Current-year surplus Accumulated surplus 201346537195516 202010689501171416 202414281453-251613 203021722722-550-125 203529734300-1327-5045 204040796619-2540-15138 204551219490-4369-32967 2050625513261-7005-62363 2055747817423-9945-105911 2060912222495-13374-165622

29
Financial status of BHIR YearRevenueExpenditure Current-year surplus Accumulated surplus 201371531794 20201058719245 2027160 -0.37328 2030181204-24288 2036220314-93-76 2040244410-165-622 2045276543-267-1749 2050308703-395-3454 2055334868-534-5847 20603541060-706-9018

30
Financial status of NCMS YearRevenueExpenditure Current-year surplus Accumulated surplus 20132312171499 202044541232353 2024553567-14384 2029672839-167-91 20357881268-480-2120 20408601725-866-5631 20459042183-1279-11160 20509212679-1757-18966 20559133090-2177-28996 20608853472-2587-41114

31
Policy options 1. Postponing retirement age 2. The integration of MSAs and pooling fund 3. Adjusting contribution policy (including retirees as contributors to BHIE and increasing premium rate) 4. Abolishing the one-child policy 5. Extending coverage of BHIE, BHIR and NCMS 6. Adjusting interest rate policy
 4. Abolishing the one-child policy 5. Extending coverage of BHIE, BHIR and NCMS 6. Adjusting interest rate policy.")
32
Postponing the retirement age

33
Proposal First year with negative cash flow First year with deficits and amounts (RMB billion) Implications Delay (years) of negative cash flow Delay (years) of deficit occurrence Reduced deficits (RMB billion) and percentage changes in 2060 Scenario 12026 2033 (151746) 23 -13876 (-8.38%) Scenario 22028 2035 (137171) 45 -28451 (-17.18%) Scenario 32030 2038 (123078) 68 -42544 (-25.69%)
 Implications Delay (years) of negative cash flow Delay (years) of deficit occurrence Reduced deficits (RMB billion) and percentage changes in 2060 Scenario (151746) (-8.38%) Scenario (137171) (-17.18%) Scenario (123078) (-25.69%)")
34
The integration of MSAs and pooling fund Proposal First year with negative cash flow First year with deficits and amounts (RMB billion) Implications Delay (years) of negative cash flow Delay (years) of deficit occurrence Reduced deficits (RMB billion) and percentage changes in 2060 Combining MSAs and social pooling fund 2028 2035 (163187) 45 -2436 (-1.47%)
 Implications Delay (years) of negative cash flow Delay (years) of deficit occurrence Reduced deficits (RMB billion) and percentage changes in 2060 Combining MSAs and social pooling fund (163187) (-1.47%)")
35
Including retirees as contributors to BHIE Proposal First year with negative cash flow First year with deficits and amounts (RMB billion) Implications Delay (years) of negative cash flow Reduced deficits (RMB billion) and percentage changes in 2060 Retirees: 1%2025 2031 (155514) 11 -10108 (-6.10%) Retirees: 2%2026 2033 (145402) 23 -20220 (-12.21%) Retirees: 3%2027 2034 (135284) 34 -30339 (-18.32%) Retirees: 4%2028 2035 (125159) 45 -40463 (-24.43%) Retirees: 5%2029 2037 (115026) 57 -50596 (-30.55%) Retirees: 6%2030 2038 (104882) 68 -60740 (-36.67%) Retirees: 6.74% 2031 2040 (97368) 710 -68254 (-41.21%) Retirees and working enrollees: 9.3% 2047 2061 (-229) 2331 -165851 (-100.14%)
 Implications Delay (years) of negative cash flow Reduced deficits (RMB billion) and percentage changes in 2060 Retirees: 1% (155514) (-6.10%) Retirees: 2% (145402) (-12.21%) Retirees: 3% (135284) (-18.32%) Retirees: 4% (125159) (-24.43%) Retirees: 5% (115026) (-30.55%) Retirees: 6% (104882) (-36.67%) Retirees: 6.74% (97368) (-41.21%) Retirees and working enrollees: 9.3% (-229) ( %)")
36
Increasing premium rate-BHIE Proposal First year with negative cash flow First year with deficits and amounts (RMB billion) Implications Delay (years) of negative cash flow Reduced deficits (RMB billion) and percentage changes in 2060 Increase: 1%2028 2036 (138404) 46 -27218 (-16.43%) Increase: 2%2032 2041 (111035) 811 -54587 (-32.96%) Increase: 3%2035 2046 (83435) 1116 -82187 (-49.62%) Increase: 4%2040 2051 (55522) 1621 -110100 (-66.48%) Increase: 5%2043 2056 (27208) 1926 -138414 (-83.57%) Increase: 5.95%2046 2061 (-195) 2231 -165817 (-100.12%)
 Implications Delay (years) of negative cash flow Reduced deficits (RMB billion) and percentage changes in 2060 Increase: 1% (138404) (-16.43%) Increase: 2% (111035) (-32.96%) Increase: 3% (83435) (-49.62%) Increase: 4% (55522) (-66.48%) Increase: 5% (27208) (-83.57%) Increase: 5.95% (-195) ( %)")
37
Increasing premium rate-BHIR Proposal First year with negative cash flow First year with deficits and amounts (RMB billion) Implications Delay (years) of negative cash flow Reduced deficits (RMB billion) and percentage changes in 2060 Increase by RMB 10 per year 2031 2040 (7278) 44 -1740 (-19.29%) Increase by RMB 20 per year 2035 2045 (5523) 89 -3495 (-38.76%) Increase by RMB 30 per year 2038 2050 (3747) 1114 -5271 (-58.45%) Increase by RMB 40 per year 2041 2055 (1942) 1419 -7076 (-78.47%) Increase by RMB 50 per year 2044 2060 (100) 1724 -8918 (-98.89%) Increase by RMB 51 per year 2044 2061 (-87) 1725 -9104 (-100.96%)
 Implications Delay (years) of negative cash flow Reduced deficits (RMB billion) and percentage changes in 2060 Increase by RMB 10 per year (7278) (-19.29%) Increase by RMB 20 per year (5523) (-38.76%) Increase by RMB 30 per year (3747) (-58.45%) Increase by RMB 40 per year (1942) (-78.47%) Increase by RMB 50 per year (100) (-98.89%) Increase by RMB 51 per year (-87) ( %)")
38
Increasing premium rate-NCMS Proposal First year with negative cash flow First year with deficits and amounts (RMB billion) Implications Delay (years) of negative cash flow Reduced deficits (RMB billion) and percentage changes in 2060 Increase by RMB 10 per year 2028 2035 (34570) 46 -6522 (-15.87%) Increase by RMB 20 per year 2031 2040 (27997) 711 -13096 (-31.87%) Increase by RMB 30 per year 2035 2045 (21352) 1116 -19740 (-48.04%) Increase by RMB 40 per year 2038 2050 (14613) 1421 -26479 (-64.44%) Increase by RMB 50 per year 2040 2055 (7759) 1626 -33334 (-81.12%) Increase by RMB 60 per year 2043 2060 (761) 1931 -40331 ) (-98.15%) Increase by RMB 62 per year 2044 2061 (-657) 2032 -41750 (-101.60%)
 Implications Delay (years) of negative cash flow Reduced deficits (RMB billion) and percentage changes in 2060 Increase by RMB 10 per year (34570) (-15.87%) Increase by RMB 20 per year (27997) (-31.87%) Increase by RMB 30 per year (21352) (-48.04%) Increase by RMB 40 per year (14613) (-64.44%) Increase by RMB 50 per year (7759) (-81.12%) Increase by RMB 60 per year (761) ) (-98.15%) Increase by RMB 62 per year (-657) ( %)")
39
Abolishing the one-child policy Program First year with negati ve cash flow First year with deficits and amounts (RMB billion) Implications Delay (years) of negative cash flow Reduced deficits (RMB billion) and percentage changes in 2060 BHIE2024 2030 (150800) 00 -14822 (-8.95%) BHIR2033 2042 (82066) 66 -8110 (-8.99%) NCMS2024 2030 (426275) 01 15352 (3.74%)
 Implications Delay (years) of negative cash flow Reduced deficits (RMB billion) and percentage changes in 2060 BHIE (150800) (-8.95%) BHIR (82066) (-8.99%) NCMS (426275) (3.74%)")
40
Extending coverage of BHIE, BHIR and NCMS Program First year with negative cash flow First year with deficits and amounts (RMB billion) Implications Delay (years) of negative cash flow Reduced deficits (RMB billion) and percentage changes in 2060 BHIE2024 2030 (166298) 00 676 (0.41%) BHIR2030 2039 (7853) 33 -1164 (-12.91%) NCMS2024 2029 (43317) 00 2224 (5.41%)
 Implications Delay (years) of negative cash flow Reduced deficits (RMB billion) and percentage changes in 2060 BHIE (166298) (0.41%) BHIR (7853) (-12.91%) NCMS (43317) (5.41%)")
41
Adjusting interest rate policy Program First year with negativ e cash flow First year with deficits and amounts (RMB billion) Implications Delay (years) of negative cash flow Reduced deficits (RMB billion) and percentage changes in 2060 BHIE2024 2031 (165278) 01 -344 (-0.21%) BHIR2027 2037 (8922) 01 -96 (-1.06%) NCMS2024 2030 (41011) 01 -82 (-0.20%)
 Implications Delay (years) of negative cash flow Reduced deficits (RMB billion) and percentage changes in 2060 BHIE (165278) (-0.21%) BHIR (8922) (-1.06%) NCMS (41011) (-0.20%)")
Similar presentations


>")
