Download presentation
Presentation is loading. Please wait.

1
Social Return on Investment: Practical Tools for Cost Benefit Analysis Reclaiming Futures Webinar Kristina Smock Consulting July 28, 2010

2
What is Cost-Benefit Analysis? BenefitsCosts Do the economic benefits of providing this service outweigh the economic costs?

3
Benefit-to-Cost Ratio monetary value of benefits monetary costs of obtaining them

4
Case Study Prevention Engagement Housing Education and jobs

6
Calculating Costs Divide budget into individual program areas that each match with a specific outcome Include all costs that are necessary in order to achieve the outcome Time period for costs should match time period for outcomes Make sure all relevant costs are captured in your final cost-benefit ratio

7
New Avenues’ Costs

8
Outputs and Outcomes Intervention OutputsOutcomes

9
No Outcome Data? Apply your output data to studies showing the outcomes of similar interventions. Calculate how many people would have to benefit for the program to pay for itself. Compare the costs of two alternatives.

10
Sample Outcomes 104 homeless youth exited street life 32 homeless youth obtained GEDs 99 homeless youth obtained jobs 182 homeless youth committed to case management

11
Identifying Benefits Direct benefits to individual participants Benefits to other individuals Cost savings to society Financial returns to society

12
Sample Benefits Reduction in victimization rates and criminal activity for youth who exit street life Increase in lifetime earning potential for youth who earn GEDs Increase in personal income and tax contributions for youth who obtain jobs Reduction in long-term risks of substance abuse for youth who engage in case management

13
Calculating Monetary Value of Benefits Aggregate actual short-term benefits for all participants Estimate long-term benefits by applying formulas from research Financial benefits Convert to monetary value based on research studies Some benefits cannot be converted to monetary value Non- financial benefits

14
Calculating Actual Cost Savings Based on Government Records

15
Challenges of Calculating Actual Cost Savings from Records Privacy issues Data base incompatibility Time lags Getting cost data Finding a comparison group

16
Examples from New Avenues

17
Example 1: Reception Center 1,392 youth diverted from juvenile detention system $144: Reception Center intake $365: Juvenile detention intake Total cost savings: $307,632

18
Example 2: Runaways 456 runaways accessed Reception Center Outcome 40% of runaways become homeless 50% of homeless youth access shelter Average shelter stay: 4 months National data $62 per day Cost of shelter: $677,040 Cost savings:

19
Example 3: Jobs 99 youth placed in jobs Average earnings: $20,294 for 65 full- time workers and $7,382 for 34 part time workers Estimated annual tax contributions in first year of employment: $337,490

20
Example 4: Victimization 104 homeless youth exited street life Outcome Half of street youth have been robbed Half of street youth have been attacked National data Robbery: $15,600 per incident Assault: $40,700 per incident Cost of victimization: $2.9 million Cost savings:

21
New Avenues’ Findings $4.12$1.00 New Avenues saved the community the equivalent of $4.12 for every $1.00 it spent in 2004-05 across all of its programs

22
Challenges of the Methodology Multi-layered research Time consuming and labor intensive Detailed documentation required Not all benefits can be captured

23
PLANNING TOOLS

28
Cost-Benefit Worksheet Example 1. Cost of program or program component: $195,203 2. Unit of cost: Per year 3. Number of youth served by program component during time period covered by unit of cost: 456 runaway youth were served 4. Outcome during same time period: 100% of runaway youth served were reunited with their families or connected to appropriate services when reunification wasn’t possible. 5. Primary or secondary data tied to outcome showing what would have likely happened to participants without the intervention: Nationally, 40% of runaways end up homeless. 6. Data showing per unit monetary equivalent of outcome: Nationally, about half of all homeless youth access shelter services, for an average of 4 months. The cost to provide shelter and basic services for each youth who accesses it is $62 per night, or an average of $7,440 for 4 months. Since only half of all homeless youth access shelter services, the average cost per youth is $3,720.

29
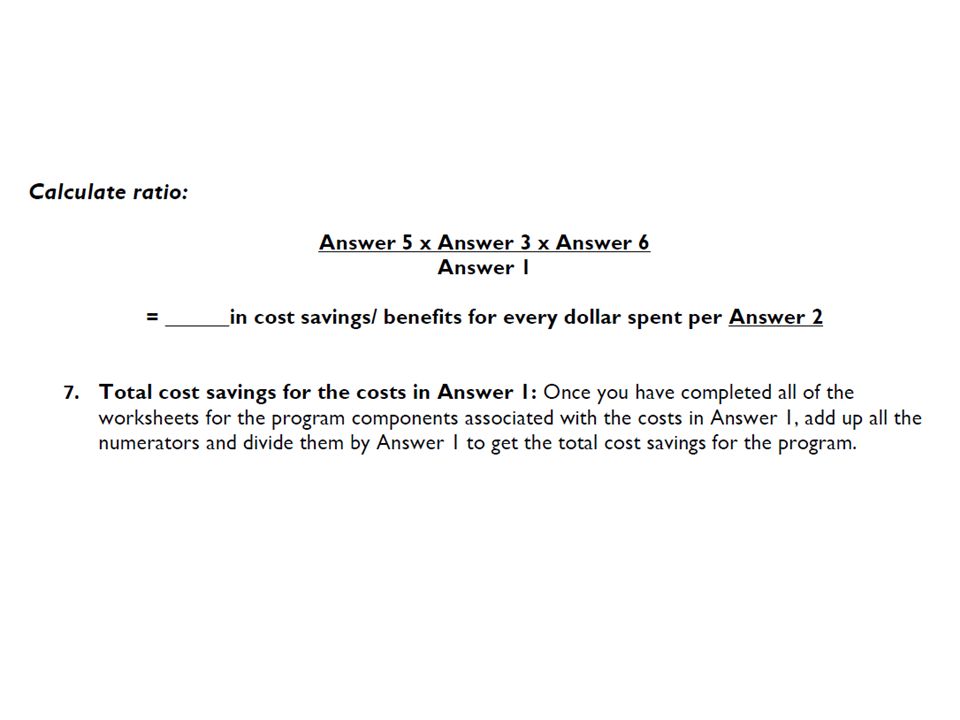
Calculate Ratio 100% x 1,392 x $221 Answer 5 x Answer 3 x Answer 6 Answer 1 195,203 = $1.58 in benefits for every dollar spent per year

30
Total Cost Benefit Total cost savings for the costs in Answer 1: $678,528 + $307,632 $195,203 = $5.05 in benefits for every dollar spent per year Note: Numerator and cost benefit ratio are slightly different than in the report because of differences in rounding.

31
Questions and Discussion

Similar presentations


 586-2740 Institute Publications:>")

