Download presentation
Presentation is loading. Please wait.

1
Variables Control Chart Chapter 10

2
Variables Control Chart Dr. Walter Shewhart (1891-1967) –Father of Statistical Process Control –Inventor of Control Charts –Proposed concept of common cause and special cause variation
 –Father of Statistical Process Control –Inventor of Control Charts –Proposed concept of common cause and special cause variation.")
3
Variables Control Chart Dr. Walter Shewhart (1891-1967) –A phenomenon will be said to be controlled when, through the use of past experience, we can predict, at least within limits, how the phenomenon may be expected to vary in the future. Here it is understood that prediction within limits means that we can state, at least approximately, the probability that the observed phenomenon will fall within the given limits.
 –A phenomenon will be said to be controlled when, through the use of past experience, we can predict, at least within limits, how the phenomenon may be expected to vary in the future. Here it is understood that prediction within limits means that we can state, at least approximately, the probability that the observed phenomenon will fall within the given limits..")
4
Variables Control Chart Controlled variation, chance, or common causes –variation present in a process due to the very nature of the process. –small random changes in the process that cannot be avoided. –consistently affect the process and its performance day after day, every day. –This type of variation can be removed from the process only by changing the process.

5
Variables Control Chart Uncontrolled variation, special or assignable causes – comes from sources external to the process. – This type of variation is not normally part of the process. – Assignable causes are variations in the process that can be identified and isolated as the specific cause of a change in the behavior of the process. – This type of variation arises because of special circumstances.

6
Variables Control Chart Control charts serve two basic functions: 1. Decision-making tools. They provide an economic basis for making a decision as to whether to investigate for potential problems, to adjust the process, or to leave the process alone. a. Control charts provide information for timely decisions concerning recently produced items. b. Control chart information is used to determine the process capability, or the level of quality the process is capable of producing. Samples of completed product can be statistically compared with the process specifications. This comparison provides information concerning the process’s ability to meet the specifications set by the product designer.

7
Variables Control Chart 2. Problem-solving tools. They point out where improvement is needed. a. Control chart information can be used to help locate and investigate the causes of the unacceptable or marginal quality. By observing the patterns on the chart the investigator can determine what adjustments need to be made. b. During daily production runs, the operator can monitor machine production and determine when to make the necessary adjustments to the process or when to leave the process alone to ensure quality production.

8
Variables Control Chart Several types of variation are tracked with statistical methods. These include: 1.Within-piece variation, or the variation within a single item or surface. 2.Piece-to-piece variation, or the variation that occurs among pieces produced at approximately the same time. 3.Time-to-time variation, or the variation in the product produced at different times of the day.

9
Variables Control Chart The centerline of a variables control chart shows where the process average is centered, the central tendency of the data The upper control limit (UCL) and lower control limit (LCL) describe the spread of the process
 and lower control limit (LCL) describe the spread of the process")
10
Variables Control Chart To construct a variables control chart: 1. Define the Problem 2. Select the Quality Characteristic to Be Measured 3. Choose a Rational Subgroup Size to Be Sampled 4. Collect the Data 5. Determine the Trial Centerline for the X-bar Chart 6. Determine the Trial Control Limits for the X-bar Chart 7. Determine the Trial Control Limits for the R Chart 8. Examine the Process: Interpret the Control Chart

11
Variables Control Charts

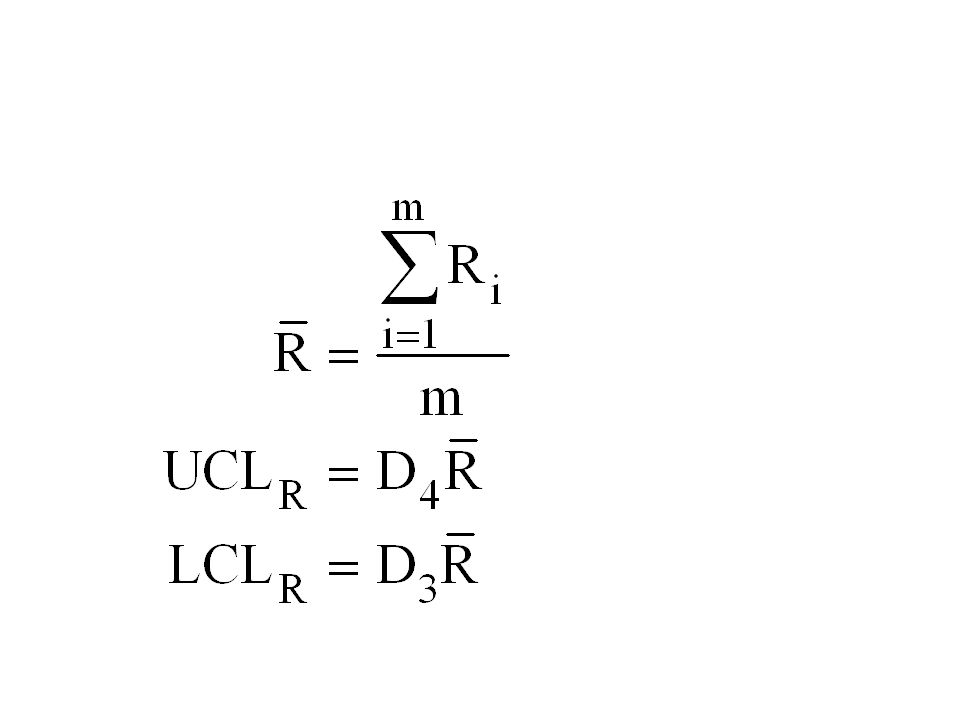
13
Variables Control Chart A control chart exhibits a state of control when: 1.Two-thirds of the points are near the center value. 2.A few of the points are on or near the center value. 3.The points appear to float back and forth across the centerline. 4.The points are balanced (in roughly equal numbers) on both sides of the centerline. 5.There are no points beyond the control limits. 6.There are no patterns or trends on the chart.
 on both sides of the centerline. 5.There are no points beyond the control limits. 6.There are no patterns or trends on the chart..")
Similar presentations


 2009 John Wiley & Sons, Inc.>")


