Download presentation
Presentation is loading. Please wait.

1
How do we know whether a marker or model is any good? A discussion of some simple decision analytic methods Carrie Bennette (on behalf of Andrew Vickers) University of Washington
 University of Washington.")
2
Overview of talk Marker research in cancer: state of the science Traditional statistical methods for evaluating predictions Decision analytic approaches

3
Overview of talk Marker research in cancer: state of the science Traditional statistical methods for evaluating predictions Decision analytic approaches

4
A combination of common and minor variations in five regions of DNA can help predict a man’s risk of getting prostate cancer, researchers reported Wednesday. A company formed by researchers at Wake Forest University School of Medicine is expected to make the test available in a few months …. It should cost less than $300. This is, some medical experts say, a first taste of what is expected to be a revolution in medical prognostication

5
SNP panel Predictive accuracy of SNP panel: 0.57 Predictive accuracy of single PSA in middle age: 0.75 Doesn’t add to standard predictors (Nam et al.)
")
6
Systematic review of molecular markers in cancer 129 papers published in 2005 and 2006 eligible for analysis More markers than papers 97% included inference statistics 36% included marker in a multivariable model 11% measured predictive accuracy 0 used decision analytic techniques

7
Overview of talk Marker research in cancer: state of the science Traditional statistical methods for evaluating predictions Decision analytic approaches

8
Example: Binary test for cancer on biopsy Patients with high PSA are referred to biopsy But most patients with high PSA don’t have prostate cancer Could a second marker help? Study of biopsy cohort: 26% had cancer –Assess presence of two markers

9
Traditional biostatistical metrics SensitivitySpecificityPPVNPVLR+LR- AUC (Youden) Brier (mean squared error) Test A91%40%35%92%1.520.230.650.47 Test B51%78%45%82%2.320.630.640.29
 Brier (mean squared error) Test A91%40%35%92% Test B51%78%45%82%")
10
Which test is best? Sensitivity / specificity insufficient to determine which test should be used: –“Depends on whether sensitivity or specificity is more important”

11
Conclusion about traditional metrics Traditional biostatistical techniques for evaluating models, markers and tests do not incorporate clinical consequences Accordingly, they cannot inform clinical practice

12
Overview of talk Marker research in cancer: state of the science Traditional statistical methods for evaluating predictions Decision analytic approaches

13
A hierarchy of evidence Inference statistics –Marker “not unassociated with outcome” Predictive accuracy –How much information does the marker give you? Decision analytic techniques –Do you make better decisions on the basis of the marker?

14
Threshold probability Predicted probability of disease is p ̂ Define a threshold probability of disease as p t Patient accepts treatment if p ̂ ≥ p t p t describes how patients values relative harm of false positive and false negative

15
Decision theory “I would biopsy a man if his risk of prostate cancer was 20% or more, that is, I would conduct no more than 5 biopsies to find one cancer. I consider the harms associated with delaying the diagnosis of prostate cancer to be four times worse than the harms, risks and inconvenience of biopsy.”

16
Treat:Sens.Spec.Prev.Net benefit Test A91%40%26% 91% × 26% - (1 – 40%) × (1 – 26%) × (0.2 ÷ 0.8) = 0.1256 Test B51%78%26% 51% × 26% - (1 – 78%) × (1 – 26%) × (0.2 ÷ 0.8) = 0.0919 Everyone100%0%26% 100% × 26% - (1 – 0%) × (1 – 26%) × (0.2 ÷ 0.8) = 0.075 No-one0%100%26% 0% × 26% - (1 – 100%) × (1 – 26%) × (0.2 ÷ 0.8) = 0 Worked example at p t of 20%
 × (1 – 26%) × (0.2 ÷ 0.8) = Test B51%78%26% 51% × 26% - (1 – 78%) × (1 – 26%) × (0.2 ÷ 0.8) = Everyone100%0%26% 100% × 26% - (1 – 0%) × (1 – 26%) × (0.2 ÷ 0.8) = No-one0%100%26% 0% × 26% - (1 – 100%) × (1 – 26%) × (0.2 ÷ 0.8) = 0 Worked example at p t of 20%")
17
Net benefit has simple clinical interpretation Net benefit of 0.126 at p t of 20% Using the model is the equivalent of a strategy that led to 126 patients per 1000 with cancer being biopsied with no unnecessary biopsies

18
Net benefit has simple clinical interpretation Difference between model and treat all at p t of 20%. – 0.051 Divide by weighting 0.051/ 0.25 = 0.204 –204 fewer false positives per 1000 patients for equal number of true positives –E.g. 204 fewer patients undergoing biopsy without missing any cancers

19
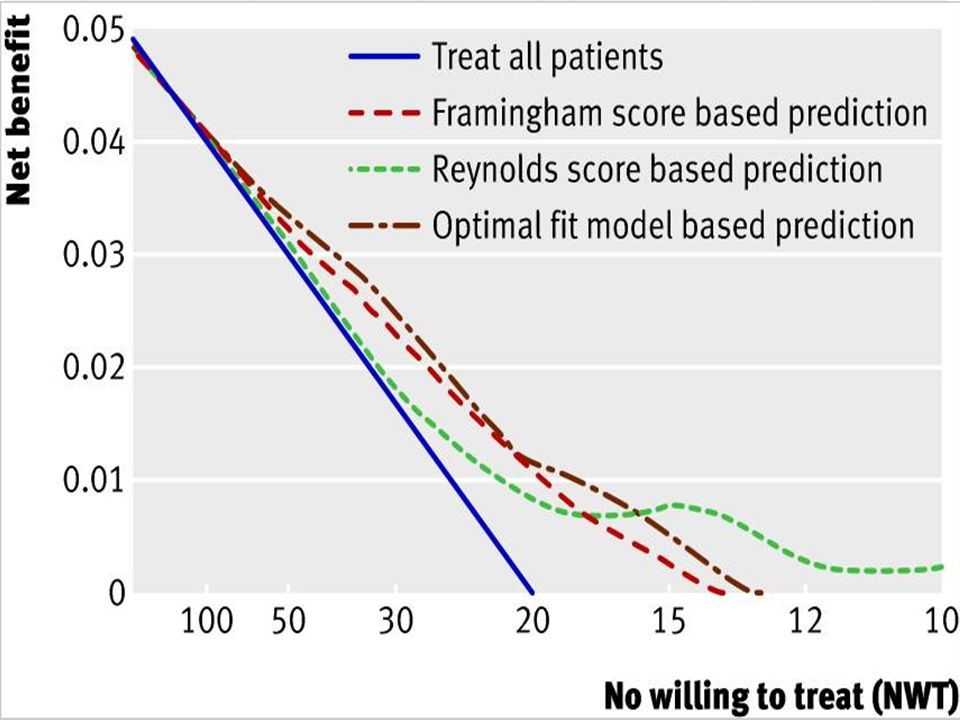
Decision curve analysis 4. Vary p t over an appropriate range Vickers & Elkin Med Decis Making 2006;26:565–574 1. Select a p t 2. Positive test defined as 3. Calculate “Clinical Net Benefit” as:

20
Decision analysis All markers PSA Free, Total PSA Biopsy all Biopsy none Vickers JCO 2009

21
Parry-Jones A R et al. Stroke. 2013;44:1840-1845

25
Conclusion Huge number of markers proposed Evidence base is very weak for most Traditional biostatistical methods do not assess clinical value of a marker Simple decision analytic methods can distinguish potentially useful from useless models and markers

Similar presentations


 Training Modules for.>")

 Curves>")


 URVASHI VAID MD, MS AUG 2012.>")


