Download presentation
Presentation is loading. Please wait.

1
U.S. Geological Survey Woods Hole Field Center Background, Data & Visualization Background, Data & Visualization Matthew Arsenault USGS Woods Hole Science Center

4
Current usSEABED data coverage (~340,000 data pts) and sediment mean grain size Coastal & Marine Geology Program (CMGP) Publications: usSEABED Sediment Database
 and sediment mean grain size Coastal & Marine Geology Program (CMGP) Publications: usSEABED Sediment Database")
5
Integration of surficial & sub-bottom geophysical data, sediment grab, core, video, and photographic data Sidescan Sonar Swath Bathymetry Seismic Reflection Bottom Video and Photographs Samples Sediment Core and Grab Samples WHSC Sea Floor Mapping Geologic Mapping of the Sea Floor

6
USGS Coastal & Marine Geology Program Why Visualization? Just a few years ago…we were still here in “flat mapland”

7
USGS Coastal & Marine Geology Program Why Visualization? Just a few years ago…we were still here in “flat mapland”

8
USGS Coastal & Marine Geology Program Why Visualization? Cognitive learning studies show that geologists & earth scientists self- select to be able to understand the relationship between 2D maps and the 3D world.

10
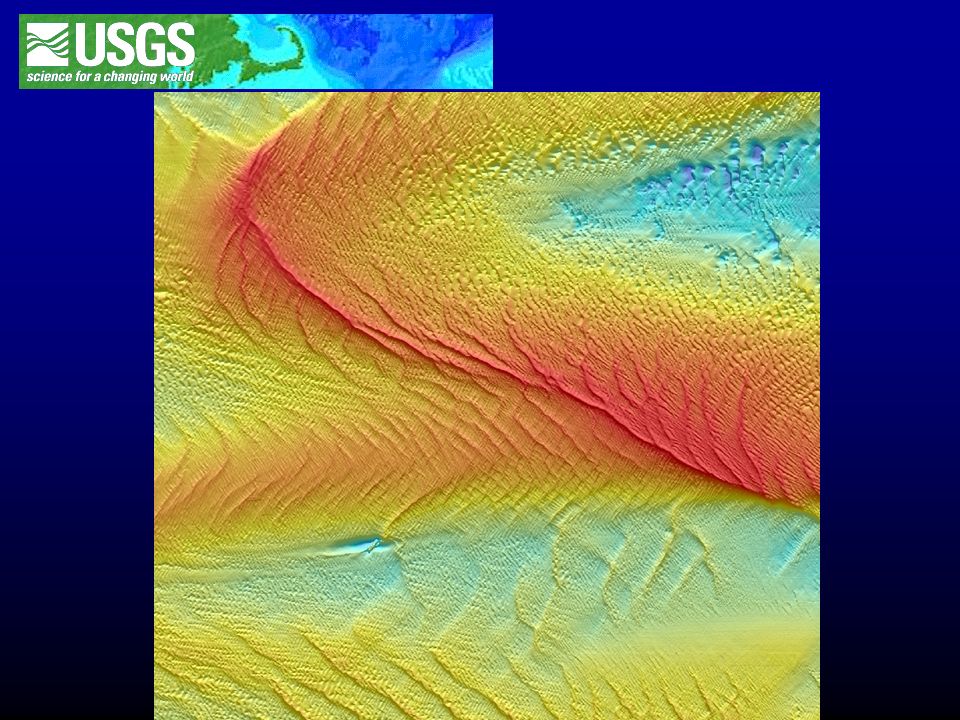
Complexities of High-Resolution data Repeatability Monitoring Change in Shoal Morphology 1200 m 800 m Rich Signell, USGS Middle Ground (sand shoal), Vineyard Sound, Massachusetts Water Depth ~5 – 20 m Woods Hole, MA Martha’s Vineyard Bedform Height ~1- 6 m
, Vineyard Sound, Massachusetts Water Depth ~5 – 20 m Woods Hole, MA Martha’s Vineyard Bedform Height ~1- 6 m")
Similar presentations


 and Senior Geophysicist Titan Environmental.>")


