Download presentation
Presentation is loading. Please wait.

1
Course Title: Financial Statement Analysis Course Code: MGT-537 Course Instructor: Dr. Hafiz Muhammad Ishaq Total Lectures: 32

2
Previous Lecture Summary Liquidity of Short-Term Assets, Related Debt Paying Ability Current Assets Current Liabilities and the Operating Cycle Cash, Marketable Securities, Receivable, Inventories, Prepayments, Other Current Assets,

3
Today's Lecture Topics Current Liabilities Current Assets Compared with Current Liabilities Working Capital Current Ratio Acid Test Ratio (Quick Ratio) Cash Ratio Sales to Working Capital (Working Capital Turnover) Liquidity Considerations Not on the Face of the Statements LIFO-FIFO, Rising Prices, a Time to Switch off LIFO? The Other Side of LIFO

4
Current Assets: Inventories A company's merchandise, raw materials, finished and unfinished products which have not yet been sold. These are considered liquid assets, since they can be converted into cash quite easily. There are various means of valuing these assets, but to be conservative the lowest value is usually used in financial statements. Held for sale in the normal course of business Used in the production of goods Trading business –Wholesale to retail –Retail to end consumer –Single inventory (merchandise) account Manufacturer has three distinct inventories –Raw materials inventory –Work in process inventory –Finished goods inventory
 account Manufacturer has three distinct inventories –Raw materials inventory –Work in process inventory –Finished goods inventory.")
5
Inventory Perpetual A method of accounting for inventory that records the sale or purchase of inventory in near real-time, through the use of computerized point-of-sale and enterprise asset management systems. Perpetual inventory provides a highly detailed view of changes in inventory and allows real-time reporting of the amount of inventory in stock, hence, accurately reflecting the level of goods on hand. –A continuous record of Physical quantities is maintained Inventory and cost of goods sold, updated as sales and purchases take place –Records are verified through physical inventory

6
Periodic A method of inventory valuation for financial reporting purposes where a physical count of the inventory is performed at specific intervals. This accounting method for inventory valuation only keeps track of the inventory at the beginning of a period, the purchases made and the sales during the same period and is recorded under the asset section of the balance sheet. Periodic physical inventories to determine quantity Attach costs to ending inventory based on selected cost flow assumption(s)
.")
7
Inventory Cost Specific identification This method of identification allows investors to reduce or offset capital gains by picking a specific lot of securities to be used as basis for a sale. – Tracking of specific cost normally impractical – Exceptions: large and/or expensive items Cost flow assumptions – FIFO (first-in, first-out) – LIFO (last-in, first-out) – Average
 – LIFO (last-in, first-out) – Average.")
8
April 1 Beginning Balance 20 units @ Rs.15 10 April Purchase 10 units @ 20 20 April Purchase 25 Units @ 30 25 April Purchase 30 Units @40 Total Issued Units 50 (30 from 25 th April, 10 from 20 th April, and 10 from April 1)
")
9
FIFO Cost Flow Assumption First inventory acquired is the first sold Cost of goods sold is oldest costs – Current costs are not matched against revenue – Inflates profit Ending inventory reflects latest costs – Approximates replacement cost – Slow turnover can distort the approximation of replacement cost by ending inventory value

10
LIFO Cost Flow Assumption Cost of most recently-acquired goods are matched against sales revenue – Profit is reflective of replacement cost Ending inventory contains oldest costs – Inventory valuation can be based on costs that are years or decades old

11
Cost Flow Assumption Example 800 units of ending inventory are valued at the most recent costs. 800 units of ending inventory are valued at the oldest costs. 2,100 units available for sale.

12
Cost Flow Assumption Example 800 units of ending inventory are valued at average unit cost. Ending inventory (800 × $7.95) =$6,360 Cost of goods sold ($16,700 – $6,360) =$10,340 2,100 units available for sale. Average Cost
 =$6,360 Cost of goods sold ($16,700 – $6,360) =$10,340 2,100 units available for sale. Average Cost.")
13
Analysis Problems and Inventory Short-term debt-paying ability is understated – Understatement is reduced by reported operating expenses that reduce gross profit to net income – Replacement cost exceeds LIFO or FIFO cost of goods sold

14
Impact on Financial Statements Cash flow is higher when LIFO is used for tax reporting LIFO profit generally lower than FIFO profit LIFO profit reflects current costs of sales LIFO reserve – Measures the spread between LIFO and FIFO inventory value – Discloses the approximate FIFO inventory value FIFO inventory is closer to replacement value of the asset

15
Inventory: Lower-of-Cost-or- Market Cost flow assumptions use historical data If “utility” (market) is below cost, inventory must be written down to reflect the diminished value Definitions of market – Replacement cost – Net realizable value
 is below cost, inventory must be written down to reflect the diminished value Definitions of market – Replacement cost – Net realizable value")
16
Liquidity of Inventory Number of days’ sales in inventory Inventory turnover in times per year Inventory turnover in days

17
Days’ Sales in Inventory Indicates the length of time needed to sell all inventory on hand Use of a natural business year – Understates number of day’s sale in inventory – Overstates liquidity of inventory Implications of extremes – High: excessive inventory for sales activity – Low: inventory shortage and lost sales

18
Inventory Turnover Indicates the liquidity of inventory Determining average inventory – End of year and beginning of year base points for average mask seasonal fluctuations – Internal analysis: use monthly or weekly amounts – External analysis: use quarterly data

19
Inventory Turnover Comparison Issues Use caution when comparing a mix of natural and calendar year companies Cost flow assumption issues – LIFO yields lower inventory value and higher inventory turnover Inter-industry comparisons may not be reasonable

20
Inventory Turnover in Days Inventory Turnover per Year

21
Current Assets: Operating Cycle The time period between acquisition of goods and the final cash realization from sales Subject to potential understatement from understatement of turnover measures –Use of LIFO –Use of a natural business year –Averages are computed on beginning-of-year and end-of-year data

22
Current Assets: Prepayments Prepayments – Unexpired costs for which payment has been made – Have minor influence on short-term debt-paying ability – Valuation: use carrying cost – Liquidity: not an issue since no cash is expected to be received

23
Current Assets: Other Will be realized in cash or conserve the use of cash within the operating cycle of the business or one year, whichever is longer If material, and nonrecurring, may misrepresent liquidity Examples – Property held for sale – Advances or deposits

24
Current Liabilities Obligations whose liquidation is reasonably expected to require the use of existing resources properly classifiable as current asset or the creation of other current liabilities Liquidity: not applicable Valuation: carried at face value – Difference between present value and face value is immaterial and disregarded

25
Working Capital Subject to understatement if certain assets are understated (i.e., LIFO inventory) Longitudinal comparison appropriate Inter-firm comparison is of no value Current Assets –Current Liabilities =Working Capital
 Longitudinal comparison appropriate Inter-firm comparison is of no value Current Assets –Current Liabilities =Working Capital")
26
Current Ratio Acid-Test (Quick) Ratios
 Ratios")
27
Current Ratio Determines short-term debt-paying ability Focus is on the relationship between current assets and current liabilities – Inter-firm comparison is possible and meaningful Traditional benchmark: 2.00 – Decreased current ratio indicates lower liquidity – Industry averages provide contextual benchmark Considerations – Quality of inventory and receivables – Inventory cost flow assumptions

28
Acid-Test (Quick) Ratio Measures the immediate liquidity of the firm Relates the most liquid assets to current liabilities – Exclude inventory – More conservative variation: Also exclude other current assets that do not represent current cash flow Traditional benchmark: 1.00 – Industry averages provide contextual benchmark Consideration – Quality of receivables
 Ratio Measures the immediate liquidity of the firm Relates the most liquid assets to current liabilities – Exclude inventory – More conservative variation: Also exclude other current assets that do not represent current cash flow Traditional benchmark: 1.00 – Industry averages provide contextual benchmark Consideration – Quality of receivables")
29
Cash Ratio Extremely conservative – Unrealistic for a firm to have sufficient cash and securities to cover all its current liabilities Appropriate context – Firms with naturally slow-moving inventory and receivables – Firms that are highly speculative

30
Sales to Working Capital Measures the turnover of working capital per year Compare with – Historical data – Industry competitors – Industry averages Assessment – Low: potentially unprofitable use of working capital – High: potential undercapitalization

31
Other Liquidity Considerations Liquidity is better than indicated by financial statements – Unused bank credit lines – Noncurrent assets that can be converted to cash quickly Liquidity is weaker than indicated by financial statements – Co-signer on debt of another entity – Subject to recourse obligation on discounted receivables – Significant contingent (unaccrued) liabilities
 liabilities")
32
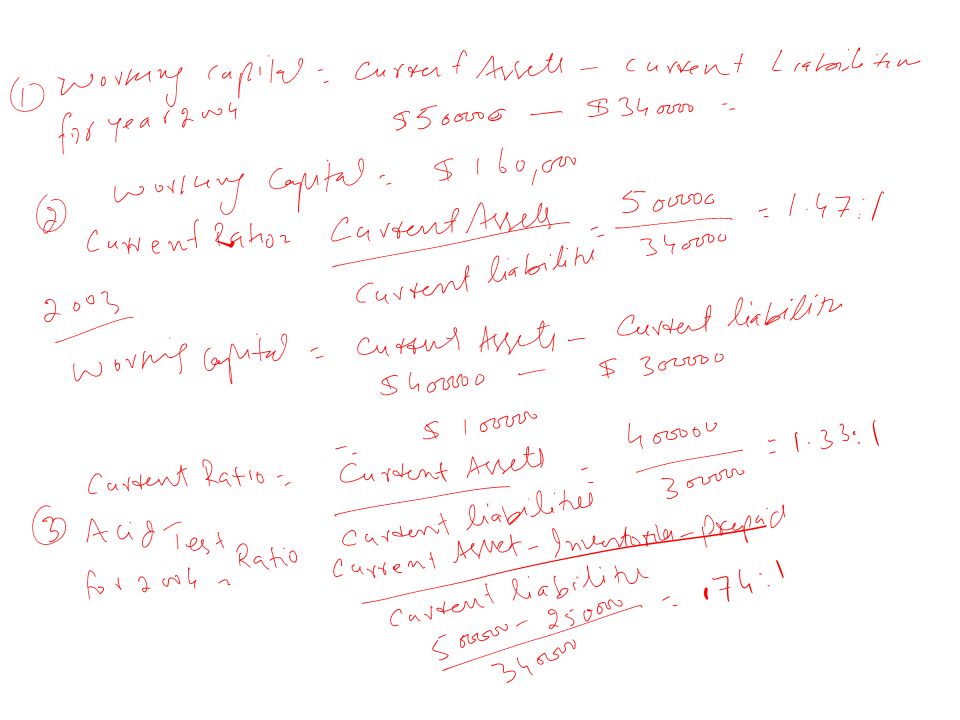
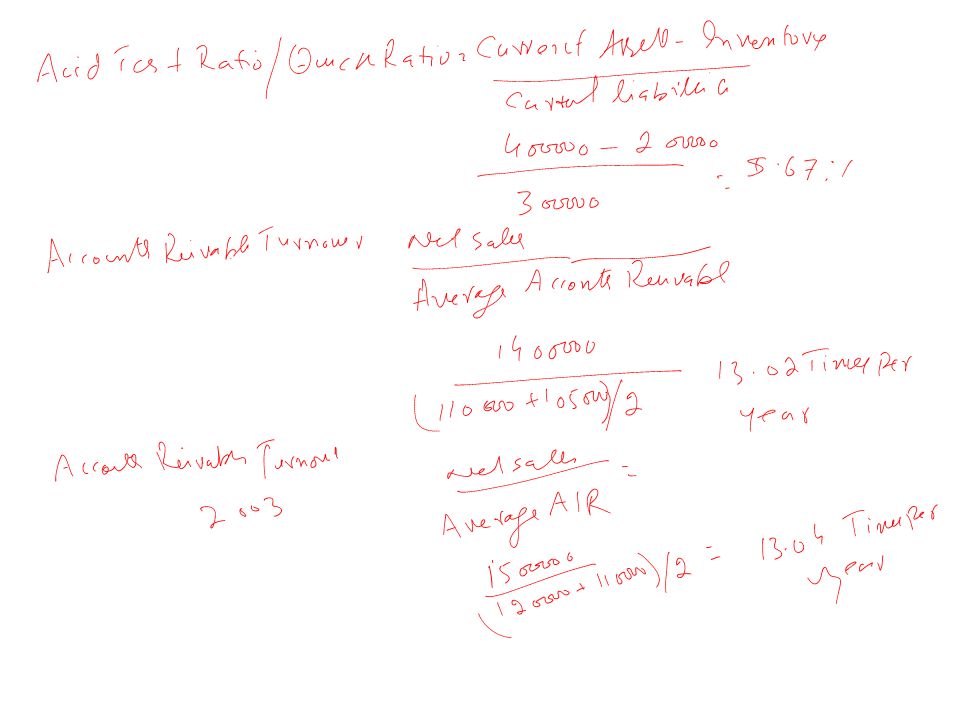
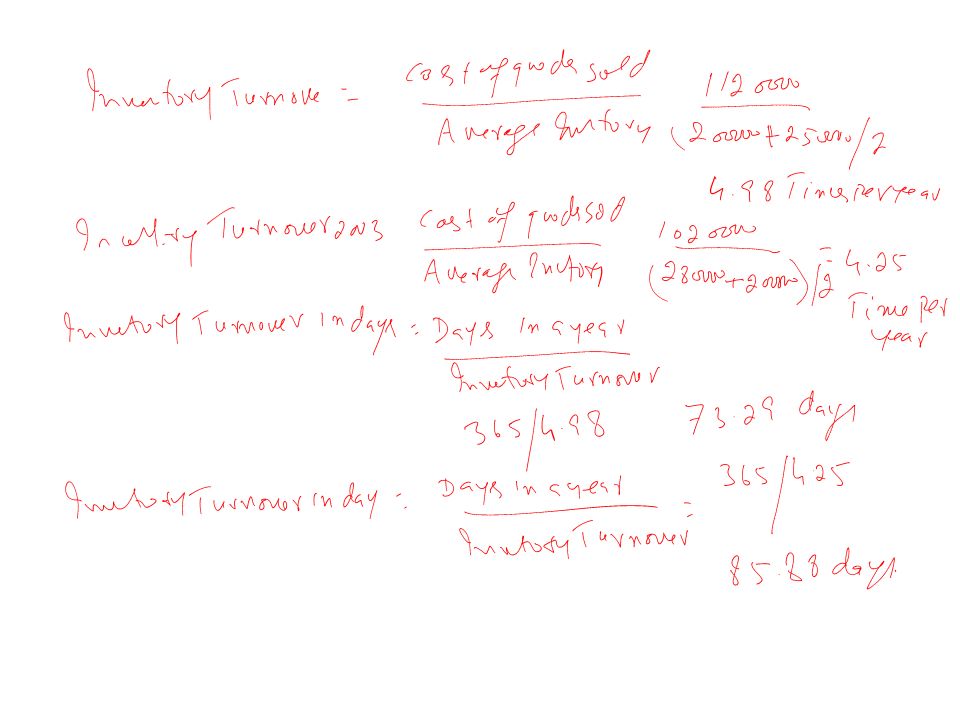
Practical Exercise The accompanying financial data were taken from the annual financial statement of Smith Corporation. 2002 2003 2004 Current assets$ 450,000$400,000 $500,000 Current liabilities 390,000 300,000 340,000 Sales1,450,0001,500,000 1,400,000 Cost of goods sold1,180,0001,020,000 1,120,000 Inventory 280,000 200,000 250,000 Accounts receivable 120,000 110,000 105,000 Required: a.Based on these data, calculate the following for 2003 and 2004 1.Working capital4. Account receivable turnover 2.Current ratio5. Merchandise inventory turnover 3.Acid – test ratio6.Inventory turnover in days b. Evaluate the result of your computations in regard to the short term liquidity of the firm

36
The short-term liquidity of the firm has improved between 2003 and 2004. The working capital increased by $60,000 while the current ratio increased from 1.33 to 1.47. The acid-test ratio increased from.67 to.74. Using a rule of thumb of two for the current ratio and one for the acid-test, this firm needs to improve its current liquidity position. The accounts receivable turnover stayed the same, while the inventory improved from 4.25 to 4.98. The days' sales in inventory improved from 85.88 to 73.29 days. Much of the improvement in the current position can be attributed to the improved control of the inventory.

37
Lecture Summary Current Liabilities Current Assets Compared with Current Liabilities Working Capital Current Ratio Acid Test Ratio (Quick Ratio) Cash Ratio Sales to Working Capital (Working Capital Turnover) Liquidity Considerations Not on the Face of the Statements LIFO-FIFO, Rising Prices, a Time to Switch off LIFO? The Other Side of LIFO

Similar presentations


 Perpetual – Updates inventory and cost of goods sold after every purchase.>")
