Download presentation
Presentation is loading. Please wait.

1
Ch3. Analysis of Financial Statement

2
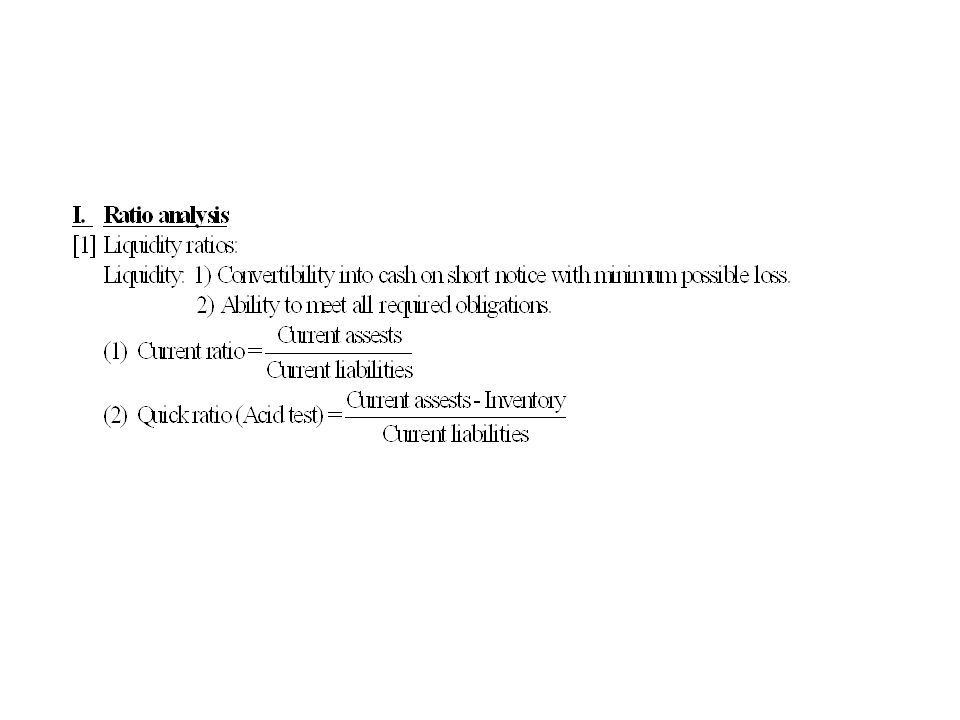
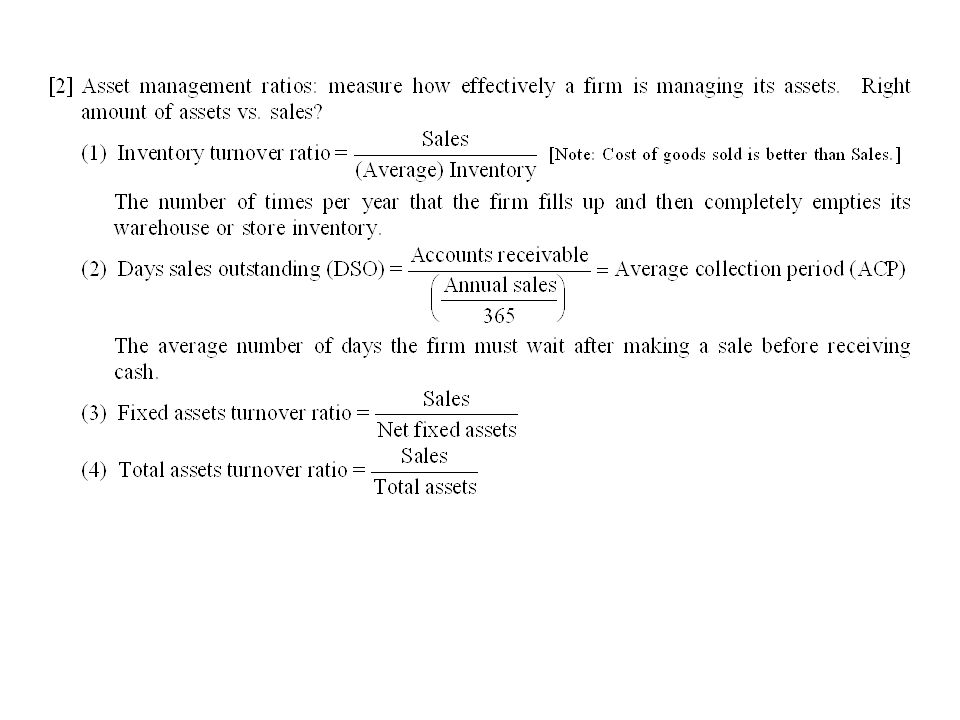
1. Why we need ratios? Specialized information Comparison Issue Predicting future performance 1)5 types of financial ratios (handout) Liquidity ratios Asset management ratios Debt management ratios Profitability ratios Market value ratios
5 types of financial ratios (handout) Liquidity ratios Asset management ratios Debt management ratios Profitability ratios Market value ratios.")
3
Goals To calculate financial ratios To understand how to use them

6
[3] Debt management ratio Debt ratio = total liabilities/total assets Debt to equity ratio = Total liabilities/(Total asset – total liabilities). But it ignore the market value. Market debt ratio = Total liabilities / (Total liabilities + market value of equity). Time-interest-earned (TIE) = Earnings before interest and taxes (EBIT)/Interest charges. But it ignores lease payment related to bankruptcy. Lease payment was deducted when EBIT is calculated.
![[3] Debt management ratio Debt ratio = total liabilities/total assets Debt to equity ratio = Total liabilities/(Total asset – total liabilities).](http://images.slideplayer.com/24/7575667/slides/slide_6.jpg "But it ignore the market value. Market debt ratio = Total liabilities / (Total liabilities + market value of equity). Time-interest-earned (TIE) = Earnings before interest and taxes (EBIT)/Interest charges. But it ignores lease payment related to bankruptcy. Lease payment was deducted when EBIT is calculated..")
7
Many companies have debts and lease. Failure to pay interests and to meet lease payments forces them into bankruptcy. EBIT is affected by non-cash item such as depreciation. Thus the next ratio is introduced. EBITDA coverage ratio = (EBITDA+ Lease payment) / (Interest + Principal payments + Lease payment). It is useful for short term lenders to evaluate financial status of firms with large amount of depreciation and amortization. Equity Multiplier=Total asset/ common equity
 / (Interest + Principal payments + Lease payment). It is useful for short term lenders to evaluate financial status of firms with large amount of depreciation and amortization. Equity Multiplier=Total asset/ common equity.")
8
4) Profitability ratios Net profit margin = Net income / Sales Operating margin = Operating Income (EBIT)/Sales Gross profit margin = (Sale – COGS)/Sales Basic Earning Power (BEP) = EBIT / Total Assets
 Profitability ratios Net profit margin = Net income / Sales Operating margin = Operating Income (EBIT)/Sales Gross profit margin = (Sale – COGS)/Sales Basic Earning Power (BEP) = EBIT / Total Assets")
9
Return on common equity = ROE =Net income /common equity Return on total assets = ROA =Net income /total assets

10
5) Market value ratio Price/ Earnings ratio = price / earnings per share. Price / Cash flow ratio = price / cash flow per share. Cash flow = NI + depreciation. Price/EBITDA Book value per share = common equity / shares outstanding. Market / book ratio = market price per share / book value per share.

11
2. Trend analysis, Common size analysis, and Percentage change analysis: An analysis of a firm’s financial ratios over time – plotting ratios over time periods It is used to estimate the likelihood of improvement or deterioration in its financial condition. 3. Du Pont Analysis: Decomposing the ROA and ROE

12
ROA = Net income / Total assets = Net Income/Sales * Sales/Total assets = Profit margin * Total asset turnover If a company has only equity without any liability, ROA =ROE

13
ROE = Net Income /Common Equity = Net Income/Total Assets*Total asset/Common Equity = Net Income/Sales * Sales/Total Assets * Total assets/Common equity =Profit margin * Total asset turnover*Equity multiplier Here Equity multiplier will increase with debts

14
4. Benchmarking: The process of comparing a particular company with a group of benchmark companies The bench mark companies can be leading companies, peer groups or competitors in the industry Comparative ratios are available from a number of sources, including value lines

15
5. Limits of ratio analysis Ratio analysis is more useful for small, narrowly focused firms than for large, multidivisional ones For high level performance, it is better to focus on the industry leaders’ ratios Seasonal factors: impacts on the inventory turnover ratio. Using monthly averages for inventory can minimize this problem Window dressing: making financial statements look better than they really are

16
Different accounting practices: FIFO &LIFO or Depreciation methods It is difficult to generalize whether a particular ratio is good or bad. 6. Problems with ROE Some problems raises if ROE is used as only sole measure of performance

17
(1) ROE doesn’t consider risks (2) ROE doesn’t consider amounts of invested capital
 ROE doesn’t consider risks (2) ROE doesn’t consider amounts of invested capital")
18
7. Working capital management 1.Working capital = current asset – current liabilities 2.Conservative working capital policy: larger working capital, low profitability and high liquidity. 3.Aggressive working capital policy: smaller working capital, high profit and low liquidity.

19
4. Operating cycle = number of days in inventory + number of days receivable Number of days in inventory = 365 or 360/inventory turn over (inventory turn over = net (credit) sale / average inventory) Number of days receivable = 365 or 360/receivable turn over (receivable turn over = net (credit) sale / average account receivable)
 sale / average inventory) Number of days receivable = 365 or 360/receivable turn over (receivable turn over = net (credit) sale / average account receivable).")
20
5. Cash conversion cycle: a length of time between cash payments (raw materials) and cash collection (sales of products). = number of days in inventory + number of days receivable – days in payable deferral. (days in payable deferral is a length of time between purchase and cash payment)
 and cash collection (sales of products). = number of days in inventory + number of days receivable – days in payable deferral. (days in payable deferral is a length of time between purchase and cash payment).")
21
Figure 16-3

Similar presentations


>")


 Analysis Of Financial Statements>")


