Download presentation
Presentation is loading. Please wait.

2
Next Big Q How good are you in making your goods…

4
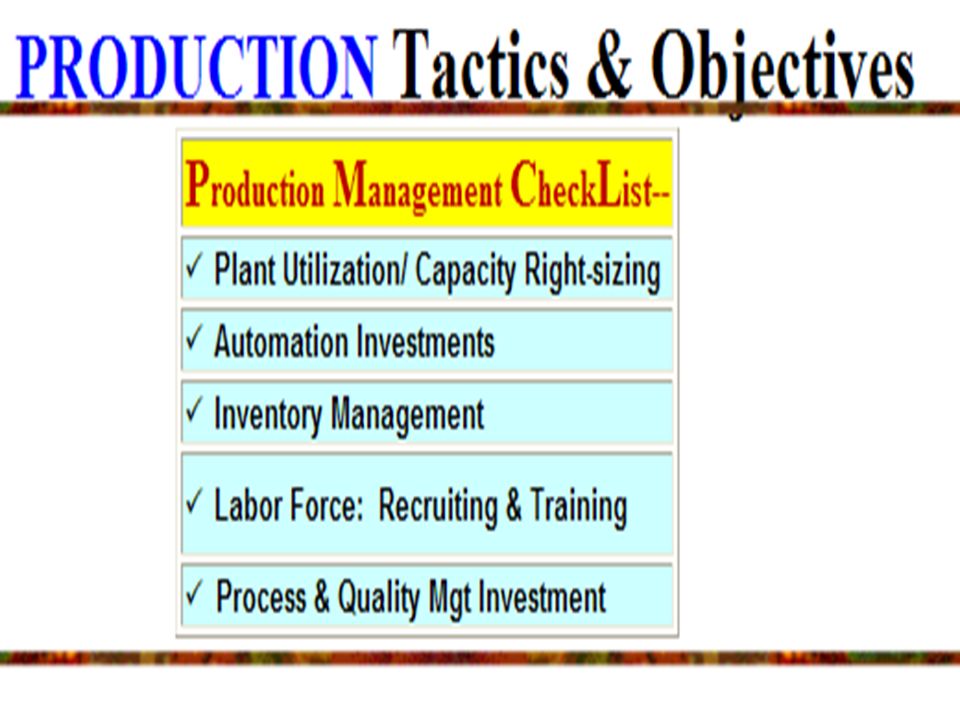
1) Assess your Production Efficiencies- Plant Utilization & Automation: 2) Assess your Company's HR & Labor Force Productivity: 3) Assess levels of automation on each of your production lines:
 Assess your Production Efficiencies- Plant Utilization & Automation: 2) Assess your Company s HR & Labor Force Productivity: 3) Assess levels of automation on each of your production lines:")
5
FAIR SHARE ESTIMATES: 3-4 Rnds out: ROW #1

6
ROW#2

7
Utilize 2 nd Shift? ROW#3

8
Why run 2 nd shift –when labor costs 50% higher?

9
Answer by using your proformas: 1- On production spreadsheet build at capacity- if have 1000 units – build 1000 units 2-On Marketing display- FORECAST 1000 UNITS 3.-ON Proforma Income statement- note NET MARGIN – Answer by using your proformas: 1- On production spreadsheet build at capacity- if have 1000 units – build 1000 units 2-On Marketing display- FORECAST 1000 UNITS 3.-ON Proforma Income statement- note NET MARGIN – THE BIQ Q: If we double sales will we double our net margin?– Will we make less because labor costs are 50% higher for 2nd shift?

10
Why run 2 nd shift –when labor costs 50% higher? Answer by using your proformas: 1- On production spreadsheet double output-run full 2 nd shift 2-On Marketing display- double forecast 3.-ON Proforma Income statement- NET MARGIN –will more than double Answer by using your proformas: 1- On production spreadsheet double output-run full 2 nd shift 2-On Marketing display- double forecast 3.-ON Proforma Income statement- NET MARGIN –will more than double THE BIQ Ar: When run 1 shift- must pay all fixed costs- 2 nd shift gets a free ride-only has to pay lbor premium…

11
Optimum Automation Levels? ROW#4

12
FAIR SHARE ESTIMATES: 3-4 Rnds out: ROW #1

13
S I M U L A T I O N M A R K E T I N G M G T. A Historical Consideration… RE: Projected Share LOW END: 0-1 product killed.. 0-1 repositioned or introduced TRADITIONAL: 3-6 repositioned from High…0-1 killed…1-2 introduced SIZE: 0-1 killed, 0-1 repositioned to Traditional, 1-2 introduced PERFORMANCE: 1-2 killed, 0-1 repositioned to Traditional, 0-1 introduced HIGH: 1-3 killed or repositioned to Traditional, 1-3 new products arrive in rounds 2 or 3

14
S I M U L A T I O N M A R K E T I N G M G T. Round 3- Forecast Segment Competitive Density LOW END: 6 products=rivalry unchanged TRADITIONAL: 9 products, w/ 3 repositioned= increased competition SIZE: 7 products, w/ 2 new= increased competition PERFORMANCE: 4 products, w/ 1 new= reduced competition HIGH: 6 products, w/ 2 new= increased competition 6 9 7 4 6

15
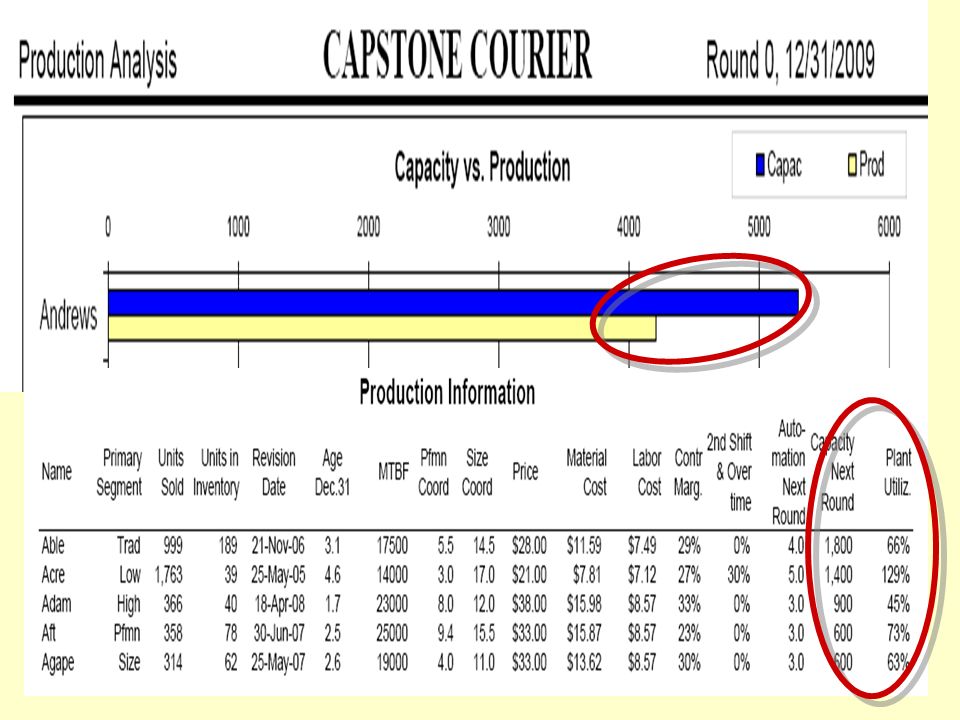
S I M U L A T I O N M A R K E T I N G M G T. -Given Round 3 Scenario- How should adjust your production capacities? Round 0- 1 st shift Capacity Round 3- Unit Demand Traditional18001068 Low End14002081 High End900668 Performance600823 Size600469

16
S I M U L A T I O N M A R K E T I N G M G T. Capacity Adjustments one might make-- based on how much capacity you would need for the 1 st 4 roundsCapacity Adjustments

17
Evaluate Your Company’s Production & HR Production & HR

18
Worst Case: BIG INVENTORY / no cash – risk seeing Big Al Best case: Lots of CASH / no Inventory -you risk stockout How Big is your Slinky?

19
Determining A Reasonable Spread Want to avoid generating an ultra Conservative Worst case scenario …matched w/ an ultra Optimistic Best case scenario Should be able to sell excess inventory in ~betw. 6 & 16 weeks

20
Take your total inventory costs $23,900M Take your total inventory costs $23,900M How to measure your slinky slack--

21
& Divide by total variable costs of inventory sold: $23,900M/$131,119M =.18 52weeks *.18 = 9 Risk ~9weeks of Inventory to avoid stockout & Divide by total variable costs of inventory sold: $23,900M/$131,119M =.18 52weeks *.18 = 9 Risk ~9weeks of Inventory to avoid stockout

Similar presentations