Download presentation
Presentation is loading. Please wait.

1
Steven Biegalski, Ph.D., P.E. Director, Nuclear Engineering Teaching Laboratory Associate Professor, Mechanical Engineering Dusting off the Atom: Nuclear Energy Futures

2
Outline Energy Policy Act of 2005 What has changed in the last 25 years? Common questions about nuclear power Future plans for nuclear Nuclear Power Plant Basics Conclusions

3
Energy Policy Act of 2005 The Energy Policy Act of 2005 had specific provisions to encourage the development of nuclear power in the United States Some specific examples: Liability limits Cost-overrun support Tax credits Research and development Steps up DoE work to address high-level waste problem.

4
What has changed in the last 25 years? Growth – Energy Demands In US Total electricity sales increase by 29 percent in the AEO2008 reference case, from 3,659 billion kilowatthours in 2006 to 4,705 billion in 2030, at an average rate of 1.1 percent per year. (Energy Information Association) Worldwide increase by 50 percent from 2005 to 2030. Nuclear industry capacity factor up to 90% Increased Environmental Awareness (e.g., Global warming) World politics Reduction in dependence on foreign countries for energy Cost – “Days of cheap energy sources are behind us.” No new accidents Increased operational efficiency of nuclear power plants.
 Worldwide increase by 50 percent from 2005 to Nuclear industry capacity factor up to 90% Increased Environmental Awareness (e.g., Global warming) World politics Reduction in dependence on foreign countries for energy Cost – Days of cheap energy sources are behind us. No new accidents Increased operational efficiency of nuclear power plants..")
5
Growth

6
U.S. Nuclear Plant Capacity Factor Source: Energy Information Administration Updated: 5/10

7
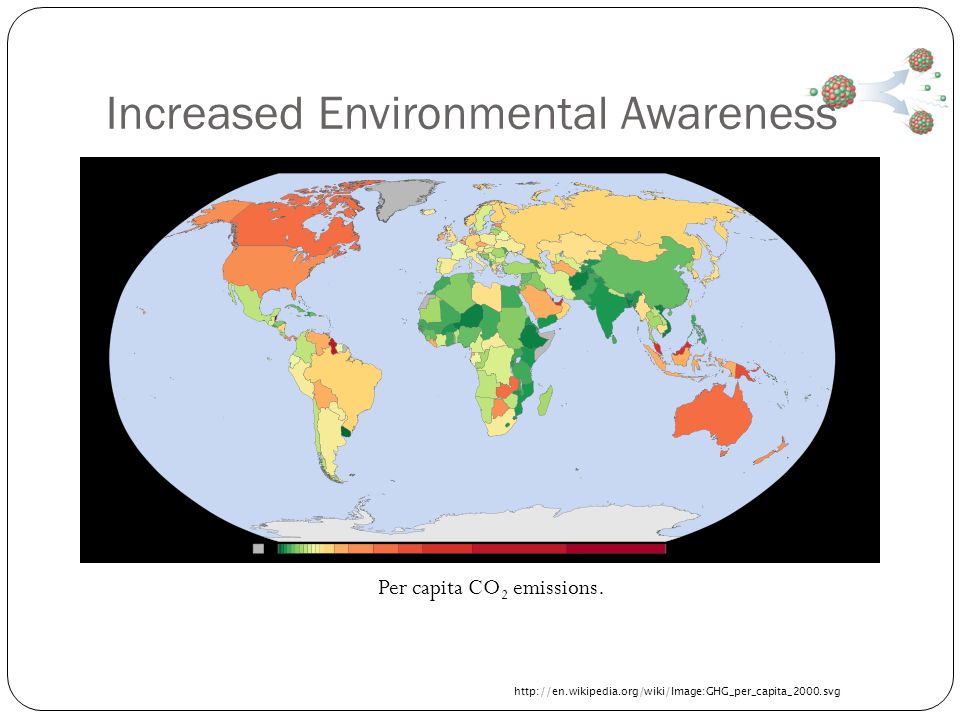
Increased Environmental Awareness Per capita CO 2 emissions. http://en.wikipedia.org/wiki/Image:GHG_per_capita_2000.svg
8
Carbon Footprints

9
Reduction in dependence on foreign countries for energy

10
Cost Data from U.S. DoE

11
OECD electricity generating cost projections for year 2010 NuclearCoalGas Finland2.763.64- France2.543.333.92 Germany2.863.524.90 Switzerland2.88-4.36 Netherlands3.58-6.04 Czech Rep2.302.944.97 Slovakia3.134.785.59 Romania3.064.55- Japan4.804.955.21 Korea2.342.164.65 USA3.012.714.67 Canada2.603.114.00 Source: OECD/IEA NEA 2005.

12
Common questions about nuclear power What is the nuclear waste problem? What is the nuclear proliferation risk? How much uranium is left? How much radiation comes from a nuclear power plant? How much water does a commercial nuclear reactor consume?

13
Nuclear Waste Nuclear reactors produce nuclear waste. Waste is produced throughout the entire fuel cycle. The high-level waste (spent nuclear fuel) is the primary concern. Disposal is being paid for by a combination of a tax on each kilowatt hour of nuclear power.
 is the primary concern. Disposal is being paid for by a combination of a tax on each kilowatt hour of nuclear power..")
14
Yucca Mountain On June 3, 2008 DOE submitted a license application to the NRC for Yucca mountain. The NRC now has a statute time limit of 3 to 4 years to complete its safety analysis and public hearings. In 2010 DOE withdrew its application for Yucca Mountain licensing.

15
Reprocessing

16
Nuclear Non-Proliferation Nuclear proliferation is a term now used to describe the spread of nuclear weapons, fissile material, and weapons-applicable nuclear technology and information, to nations which are not recognized as "nuclear weapon States" by the Treaty on the Nonproliferation of Nuclear Weapons, also known as the Nuclear Nonproliferation Treaty or NPT.

17
Nuclear Non-Proliferation ? Things to be done: Control of world-wide nuclear fuel cycle. Monitoring of nuclear activities. Proliferation resistant fuels and fuel cycles.

18
Uranium Resources The Organization for Economic Cooperation and Development (OECD) and the International Atomic Energy Agency (IAEA) in 2005 jointly produced a report on uranium resources. The report states that uranium resources are adequate to meet the needs of both existing and projected reactors.

19
Uranium Resources

20
Radiation

21
Water Resources Nuclear power plants consume water through water vapor emissions. This water is from a condenser loop that does not run through the reactor core. Electricity generation accounts for3.3 % of water consumption in U.S.. 6.7 % for residential use 81.3% for irrigation

22
Future Plans for Nuclear Nuclear power capacity worldwide is increasing steadily but not dramatically, with about 35 reactors under construction in 12 countries. Most reactors on order or planned are in the Asian region, though plans are firming for new units in Europe, the USA and Russia. Significant further capacity is being created by plant upgrading.

23
http://www.nrc.gov/reactors/new-reactors/col/new-reactor-map.html Location of Projected New US Nuclear Power Reactors

24
World Growth for Nuclear Power Data from U.S. DoE

25
Nuclear Power Plant Basics The basic premises for the majority of power plants is to: 1) Create heat 2) Boil Water 3) Use steam to turn a turbine 4) Use turbine to turn generator 5) Produce Electricity Some other power producing technologies work differently (e.g., solar, wind, hydroelectric, …)
 Create heat 2) Boil Water 3) Use steam to turn a turbine 4) Use turbine to turn generator 5) Produce Electricity Some other power producing technologies work differently (e.g., solar, wind, hydroelectric, …)")
26
Nuclear Power Plants use the Rankine Cycle

27
Heat From Fission

28
Fission Chain Reaction

29
PWR

30
BWR

31
World-wide demand for electricity continues to grow. Environmental concerns play a part in selecting electricity sources to meet the demand. Nuclear energy will play a vital role in the production of electricity for the foreseeable future. Conclusions

Similar presentations


 454-4689 Nuclear Energy Technology.>")


