Download presentation
Presentation is loading. Please wait.

1
Module Overview Risk—what is it? How do we perceive risks-socioecological model? It’s all relative.. Where do health statistics come from? How can I learn about my risk of having a disease from a given medical test?

2
Today’s Overview Housekeeping Remember, journal entries are due by 4pm on Sunday and comments are due by the start of class on Tuesday Guidelines are posted at: http://riskybusiness.web.unc.edu/assignments/ Short lecture about reading concepts for the week Talk about the video and best practices in reporting numbers Group activity: How can we report more responsibly? What is more risky?

3
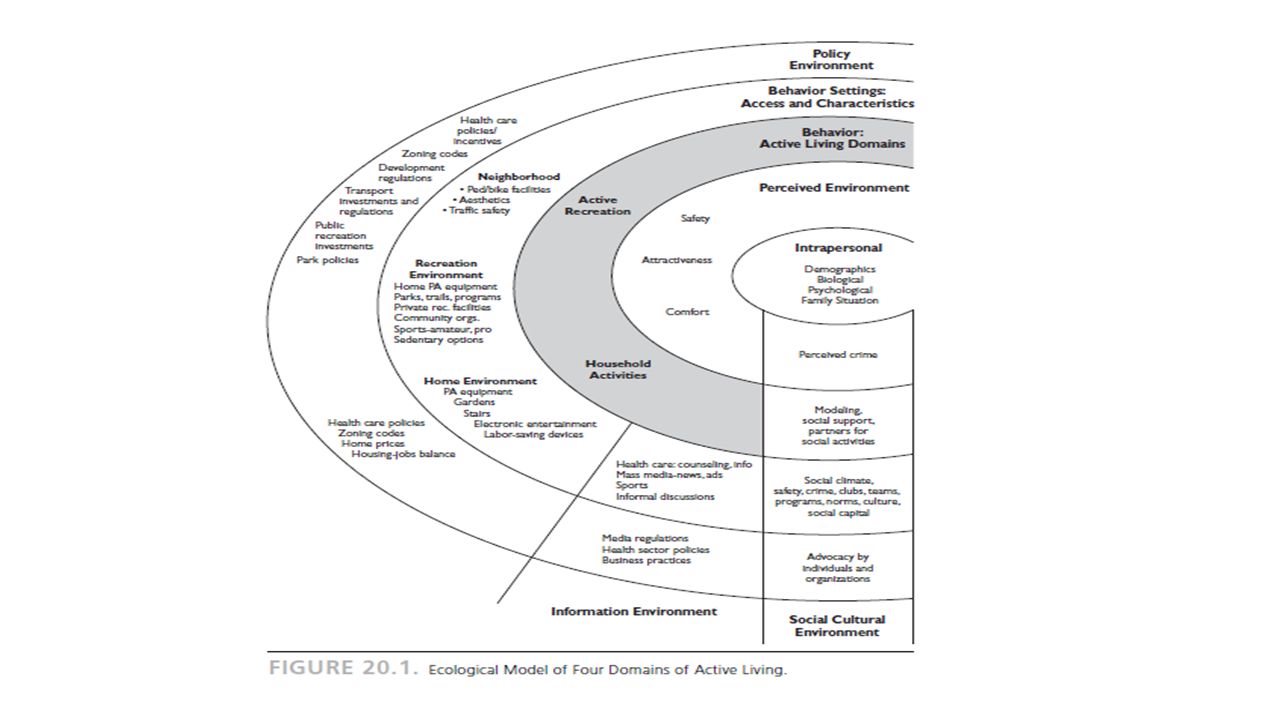
Four Components of Ecological Health behavior theory 1.There are multiple influences on specific health behaviors, including factors at the intrapersonal, interpersonal, organizational, community, and public policy levels. 2.Influences on behaviors interact across these different levels. 3.Ecological models should be behavior-specific, identifying the most relevant potential influences at each level. 4. Multi-level interventions should be most effective in changing behavior.

5
How do we report risk- related numbers? Kashika Sahay 1/15/2014

6
Epidemiology Epidemiology can be defined as the study of the distribution and determinants of health-related states in specified populations, and the application of this study to control health problems.

7
Distribution (Location) Epidemiologists study the distribution of frequencies and patterns of health events within groups in a population. To do this, they use descriptive epidemiology, which characterizes health events in terms of time, place, and person.

8
Determinants (Risk factors) Epidemiologists also attempt to search for causes or factors that are associated with increased risk or probability of disease. This type of epidemiology, where we move from questions of "who," "what," "where," and "when" and start trying to answer "how" and "why," is referred to as analytical epidemiology.

9
Populations (not Individuals) One of the most important distinguishing characteristics of epidemiology is that it deals with groups of people rather than with individual patients.
 One of the most important distinguishing characteristics of epidemiology is that it deals with groups of people rather than with individual patients.")
10
Count Simple measure of quantity Example: The number of stillbirths at Emory University Hospital in 2009 The number of M and Ms in a bag

11
Ratio Obtained by dividing one quantity by another. These quantities may be related or may be independent. Example: The number of stillbirths per thousand live births at Emory University Hospital in 2009 Examples of ratios Male:Female ratio of students Odds of winning a bet Risk of disease for exposed group compared to risk of disease for unexposed group A ratio compares the magnitude of one quantity relative to another

12
Proportion A ratio in which the numerator is included in the denominator Example: The number of stillbirths out of the total number of births at UNC Hospital in 2009 (may be expressed as %)
")
13
Proportions, Rates and Ratios have different properties Proportion the numerator is a subset of the denominator Always between 0 and 1 (or 0% and 100% when expressed as %) Rate Number of events per unit of time Number of events per population where events are counted over a specified time interval – these rates are similar to proportions Change rate – not a proportion Ratio Not a proportion Similar quantities from two different groups: the numerator is not a subset of the denominator
 Rate Number of events per unit of time Number of events per population where events are counted over a specified time interval – these rates are similar to proportions Change rate – not a proportion Ratio Not a proportion Similar quantities from two different groups: the numerator is not a subset of the denominator")
14
Measures of Disease Frequency Incidence (I): Measures new cases of a disease that develop over a period of time. Prevalence (P): Measures existing cases of a disease at a particular point in time or over a period of time.
: Measures existing cases of a disease at a particular point in time or over a period of time..")
15
RISK Probability that an event will occur RATE A measure of how quickly something happens

16
Measures of Frequency Risk Rate Proportion exposed Ratio of exposed to non-exposed 16 Comparisons Ratio Difference Disease Exposure

17
Relative Risk The Relative risk is the ratio of risks for two different populations If the risk of having disease is 2/10 in one population and 1/10 in the reference population, then the relative risk is:

19
Ideas in the video Context Matters Make big numbers and small numbers relatable (ex. Disease frequency that is low or high); avoid nonsensical comparisons Be wary of surveys and who collects data Survey people on Facebook– on a Taylor Swift webpage Conflict of interest, What types of questions Mean, Median, Mode—when do you use which? Variance and uncertainty P-values—debates with the values, statistical significance 14:44 Trends Random v. likely events (flood warning v. winning the lottery) Relative Risk (21:24)
; avoid nonsensical comparisons Be wary of surveys and who collects data Survey people on Facebook– on a Taylor Swift webpage Conflict of interest, What types of questions Mean, Median, Mode—when do you use which. Variance and uncertainty P-values—debates with the values, statistical significance 14:44 Trends Random v. likely events (flood warning v. winning the lottery) Relative Risk (21:24).")
20
Activity Get into groups of 4-5 Read through the news article Discuss: Find a number in the article. Discuss if it is responsibly reported. Discuss the reasons why it may not be responsibly reported.

Similar presentations


 Director of Evidence-Based Practice, Quality Management Assistant Professor,>")


 Betty C. Jung, RN, MPH, CHES.>")
 Impacts personal decisions about our lifestyles Affects government, public health agency and.>")


 In a case-control study, we do not know the incidence in the exposed population or the incidence in the nonexposed population.>")


 Feedback about posts/Readings for this week 2) Some discussion of your thoughts and comments.>")
