Download presentation
Presentation is loading. Please wait.

1
TB and Poverty in The Global Plan to Stop TB 2006-2015 Valerie Diaz, Sarah England, Knut Lönnroth, Giorgio Roscigno Stop TB Partnership Stop TB Department, WHO FIND

2
What is the Global Plan to Stop TB 2006-2015? I.General strategic directions for Stop TB Partners for next decade, in relation to recent achievements and remaining challenges II.Scenarios for implementation for 7 "epidemiological regions", including epidemiological and costing predictions III.Summary of strategic plans of 7 Working Groups DOTS Expansion, including Subgroups on TB/Poverty PPM-DOTS, Lab Strengthening, and Childhood TB DOTS Plus for MDR TB TB/HIV New TB Diagnostics New TB Drugs New TB Vaccines Advocacy, Communications and Social Mobilization

3
…in line with WHO-recommended Stop TB strategy to reach the Stop TB Partnership's targets for 2015 1.Pursuing quality DOTS expansion and enhancement Political commitment Case detection through bacteriology Standardised treatment, with supervision and patient support Effective drug supply system Monitoring system and impact evaluation Additional components: 2Addressing TB/HIV and MDR-TB, and other challenges (prisoners, refugees, other risk groups) 3. Contributing to health system strengthening 4. Engaging all care providers (PPM DOTS) 5. Empowering patients and communities 6. Enabling and promoting research Stop TB Department
 5. Empowering patients and communities 6. Enabling and promoting research Stop TB Department.")
4
The targets for Global Plan Process / outcome: By 2005, and to be sustained or exceeded by 2015: At least 70% of people with infectious TB will be diagnosed under the DOTS strategy and at least 85% of those diagnosed will be cured. Epidemiological impact: By 2015: TB prevalence and deaths will be reduced by 50% relative to 1990 levels. (MDG 6)
.")
5
Summary of the global scenario for DOTS Expansion DOTS Expansion 2006-15 means: 1.DOTS coverage (presence of a DOTS programme) Improving quality and access: 2. DOTS quality package (HR, microscopy, supervision, drug supply, IEC) 3. Public Private Mix DOTS (PPM DOTS) 4. Community DOTS 5. Practical Approach to Lung health (PAL) 6. Culture and drug susceptibility testing (DST) 7. Pro-poor strategy (part of all above) DOTS coverage: All countries by 2010 DOTS quality package: All countries by 2015, treatment success ≥85% in all countries by 2015
 3. Public Private Mix DOTS (PPM DOTS) 4. Community DOTS 5. Practical Approach to Lung health (PAL) 6. Culture and drug susceptibility testing (DST) 7. Pro-poor strategy (part of all above) DOTS coverage: All countries by 2010 DOTS quality package: All countries by 2015, treatment success ≥85% in all countries by")
6
Trend scenario for population to be covered by "new" DOTS Expansion approaches

7
DOTS-Plus expansion Vision: Drug resistance surveillance and DOTS-Plus integrated as routine components of TB control providing access to diagnosis and treatment for all TB patients and by all health care providers. 100% availability of culture and drug susceptibility testing by 2015 By 2015: Treatment with quality-assured 2 nd -line drugs to all detected MDR-TB patients following WHO guidelines

8
TB/HIV expansion Vision: TB/HIV collaborative activities scaled up in line with the UN target (endorsed by G8) of universal access by 2010 in all areas where HIV prevalence >1% in general adult population. Coordinate research to inform policy Increase political and resource commitment to collaborative TB/HIV activities

9
86% treatment success by 2015 81% case detection by 2015

13
The Stop TB Partnership mission To ensure that every TB patient has access to effective diagnosis, treatment and cure; To stop transmission of TB; To reduce the inequitable social and economic toll of TB; To develop and implement new preventive, diagnostic and therapeutic tools and strategies to stop TB.

14
…and "Addressing poverty in TB control" is part of Global Plan: Step 1. Establish the profile of poor and vulnerable groups Step 2. Assess the barriers to accessing TB services faced by the poor and vulnerable Step 3. Take action to overcome barriers to access. Step 4. Work with situations and population groups requiring special consideration Step 5. Harness resources for pro-poor TB services Step 6. Assess the pro-poor performance of TB control and the impact of pro-poor measures

15
…but, the equity dimension is not yet reflected in the targets: By 2005, and to be sustained or exceeded by 2015: At least 70% of people with infectious TB will be diagnosed under the DOTS strategy and at least 85% of those diagnosed will be cured. By 2015: TB prevalence and deaths will be reduced by 50% relative to 1990 levels. No specific target related to equity in access or financial protection ! Do we need that?

16
Poverty / equity in the strategic plans of the Implementing Working Groups DOTS Expansion WG (DEWG) DOTS Plus for MDR TB WG TB / HIV WG Advocacy,Communication, Social Mobilisation WG (ACSM)
 DOTS Plus for MDR TB WG TB / HIV WG Advocacy,Communication, Social Mobilisation WG (ACSM)")
17
DEWG framework linking activities to outcomes and MDGs Planned activities 1. DOTS coverage 2. DOTS quality package: -HR strategy -Supervision -Quality microscopy -Drug management -IEC 3. PPM DOTS 4. Community DOTS 5. PAL 6. Culture and DST 7. Pro-poor strategy Improve TB management Improve diagnostic quality Improve case management Improve referral routines Improve recording and reporting TB control outcomes Increase case detection Improve treatment success rate Equity outcomes Reach all patients, especially the poor Decrease diagnostic delay Reduce patients' direct and indirect costs MDG6 TB control impact Reduce TB incidence Halve TB prevalence Halve TB death rate MDG1 Poverty impact Halve poverty and hunger Reduce poverty and hunger among people with TB and their families InputsProcessOutcomeImpact Adapt services to the poor Involve communities Involve providers that serve the poor Provide free services Reduce unnecessary tests Decentralize DOT Pro-poor strategies

18
Planned activities 1. DOTS coverage 2. DOTS quality package: -HR strategy -Supervision -Quality microscopy -Drug management -IEC 3. PPM DOTS 4. Community DOTS 5. PAL 6. Culture and DST 7. Pro-poor strategy Improve TB management Improve diagnostic quality Improve case management Improve referral routines Improve recording and reporting TB control outcomes Increase case detection Improve treatment success rate Equity outcomes Reach all patients, especially the poor Decrease diagnostic delay Reduce patients' direct and indirect costs MDG6 TB control impact Reduce TB incidence Halve TB prevalence Halve TB death rate MDG1 Poverty impact Halve poverty and hunger Reduce poverty and hunger among people with TB and their families InputsProcessOutcomeImpact Adapt services to the poor Involve communities Involve providers that serve the poor Provide free services Reduce unnecessary tests Decentralize DOT No uniform indicators. No standard methods. No targets Pro-poor strategies DEWG framework linking activities to outcomes and MDGs

19
DOTS Plus equity framework The DOTS-Plus for MDR-TB strategic plan, 2006-2015, does not include explicit measures for reaching the poor and marginalized groups MDR-TB often hits poor people and marginalized groups WHO and the Green Light Committee strive to reach poor people and vulnerable groups through: –Urging NTPs to include all patients in the MDR-TB project (homeless, alcoholics, prisoners etc.) –Urging NTPs to provide incentives and enablers such as food, emotional support, and education of patients, family and peers on MDR-TB treatment –Encourage NTPs to provide social and emotional support to patients and their families
 –Urging NTPs to provide incentives and enablers such as food, emotional support, and education of patients, family and peers on MDR-TB treatment –Encourage NTPs to provide social and emotional support to patients and their families")
20
TB HIV WG equity framework "Ensure that TB/HIV services are appropriate, accessible, acceptable and affordable to populations not specifically covered in existing policy, including women, children, mobile or remote populations, the poor, intravenous drug users and prisoners" "Monitoring and evaluation should demonstrate whether services are accessible and responding to the needs of the poor, women and marginalized groups."

21
ACSM framework The poor lack: Food security Income stability Access to health care Adequate housing Income poverty TB disease TB may lead to: Loss of 20-30% of annual wages among poor Global economic costs: $12 billion annually Increased Social stigma Stigma enhances the effects of poverty Role for ACSM to break the cycle

22
Questions How to refine pro-poor strategies outlined in Global Plan and translate them into action? What is the evidence base concerning the extent to which current implementation (DOTS, DOTS Plus, TB/HIV) and new approaches (such as Community DOTS and PPM DOTS) are effective in reaching the poor? What indicators, targets and methods are needed to monitor equity in access and financial protection?
 and new approaches (such as Community DOTS and PPM DOTS) are effective in reaching the poor. What indicators, targets and methods are needed to monitor equity in access and financial protection .")
23
New tools WGs New TB Diagnostics New TB Drugs New TB Vaccines

25
EVOLUTION OF STRATEGY FOR TB DIAGNOSTIC TOOLS 2000 TBDI Strategy informed by DELPHI (ask experts) 2003 FIND Strategy informed by Epidemiology 2005 FIND Strategy informed by Mathematical model Market analysis Diagnosis delay studies SOLUTIONS Enabling industry LIST OF TOOLS (lower barriers to entry) Co-investment with industry for existing applications Product development driven EASIER DOTS OBJECTIVE PRIORITISATION OF PROBLEMS PERIOD
 2003 FIND Strategy informed by Epidemiology 2005 FIND Strategy informed by Mathematical model Market analysis Diagnosis delay studies SOLUTIONS Enabling industry LIST OF TOOLS (lower barriers to entry) Co-investment with industry for existing applications Product development driven EASIER DOTS OBJECTIVE PRIORITISATION OF PROBLEMS PERIOD")
26
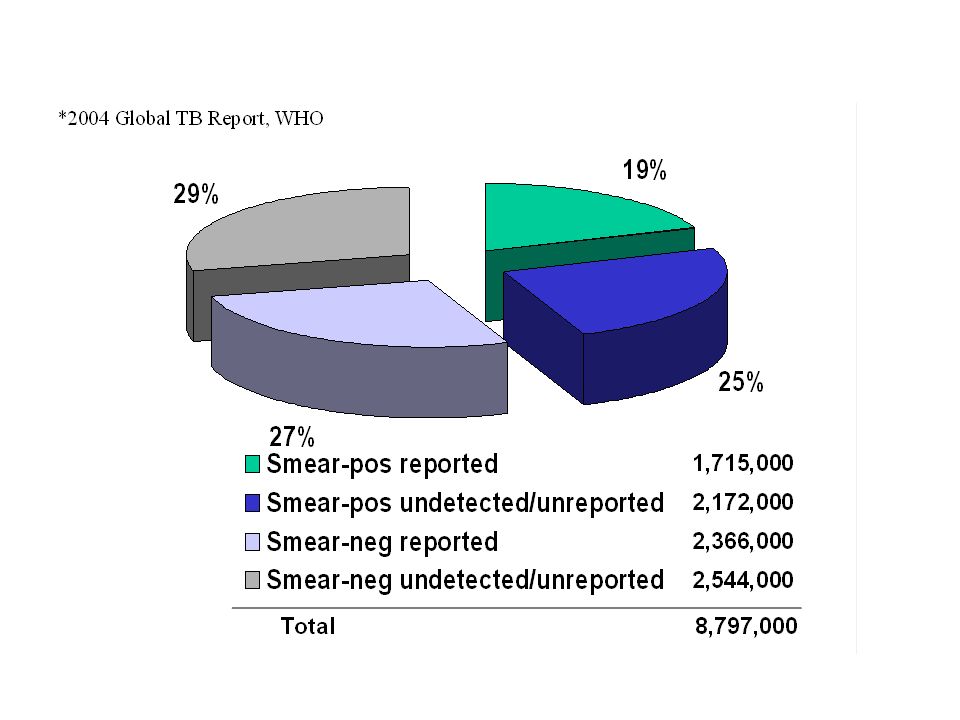
Current global direct expenditures on TB diagnostic tests The diagnostic yield of this expenditure is limited, with only 19% of all incident TB cases detected and reported as smear-positive.*

28
Availability of diagnostic services Culture facilities for TB are widely available in the US and Europe, with a culture-capable laboratory for every 1000-4000 TB suspects. Among the 22 countries accounting for 85% of the global TB burden, however, only Brazil and Russia have more than one culture laboratory per 10,000 TB suspects. Among the high-burden countries in Africa, culture-capable laboratories play a negligible role in TB diagnosis, with an average of only one such facility per 500,000 TB suspects (often one facility per country).
..")
29
In Lima, 22% of 259 TB patients first sought health care from pharmacists. Once getting to a physician, only 56% of TB patients were requested to submit sputum specimens and did so. In Chennai, 13% of 1000 patients being evaluated for symptomatic respiratory disease did not complete the diagnostic process, and 11% of patients in whom TB was detected were not notified of the diagnosis. In Lusaka, on the other hand, due primarily to the necessity for patients to purchase the sputum collection container, only 0.5% of patients completed the diagnostic process and only 6 of 600 patients even submitted a single sample. Delays to diagnosis within the health system varied widely, but were in many cases substantial, and could be limited by introducing technologies that could be used more peripherally, where patients first seek care.

30
EVOLUTION OF STRATEGY FOR TB DIAGNOSTIC TOOLS 2000 TBDI Strategy informed by DELPHI (ask experts) 2003 FIND Strategy informed by Epidemiology 2005 FIND Strategy informed by Mathematical model Market analysis Diagnosis delay studies SOLUTIONS Enabling industry LIST OF TOOLS (lower barriers to entry) Co-investment with industry for existing applications Product development driven EASIER DOTS Creating new applications for existing technologies PRIORITISATION OF TECHNOLOGIES Only 19 % (1.7 million) of all incident cases are detected by microscopy (smear +) Annual Cost TB diagnostic testing: 1.2 Billion $ Cost of testing: $376 million 32 M cultures performed per year Annual cost testing: $324 million 88 million smear microscopy tests per year Regional / OBJECTIVE PRIORITISATION OF PROBLEMS 2 M undetected unreported smear + patients TB Global Incidence: 8.8 million cases Cost of NAAT testing: $ 35 million 2.5M Molecular testings reference portable highly integrated NAT PATIENT FOCUSED IMPACT DRIVEN APPROACH PERIOD
 2003 FIND Strategy informed by Epidemiology 2005 FIND Strategy informed by Mathematical model Market analysis Diagnosis delay studies SOLUTIONS Enabling industry LIST OF TOOLS (lower barriers to entry) Co-investment with industry for existing applications Product development driven EASIER DOTS Creating new applications for existing technologies PRIORITISATION OF TECHNOLOGIES Only 19 % (1.7 million) of all incident cases are detected by microscopy (smear +) Annual Cost TB diagnostic testing: 1.2 Billion $ Cost of testing: $376 million 32 M cultures performed per year Annual cost testing: $324 million 88 million smear microscopy tests per year Regional / OBJECTIVE PRIORITISATION OF PROBLEMS 2 M undetected unreported smear + patients TB Global Incidence: 8.8 million cases Cost of NAAT testing: $ 35 million 2.5M Molecular testings reference portable highly integrated NAT PATIENT FOCUSED IMPACT DRIVEN APPROACH PERIOD")
Similar presentations


 From: Disease specificity.>")


>")
 cases in the world. Thailand ranks 17 th among the 22 high-burden.>")


 in India Dr Jitendra.>")
 update ACSM workshop, Amman, Jordan April 13-17, 2008 Dr. Sevil Huseynova.>")