Download presentation
Presentation is loading. Please wait.

1
Possibility of Synchronizing Multiple Data for Monitoring One Goal Monitoring One Goal By Amara Satharasinge Deputy Director Department of Census and Statistics Sri Lanka

2
Sri Lanka is demarcated into an administrative hierarchy of 9 provinces, 25 districts, 325 Divisional Secretariat (DS) divisions and 14,009 Grama Niladhari (GN) divisions.
 divisions and 14,009 Grama Niladhari (GN) divisions.")
3
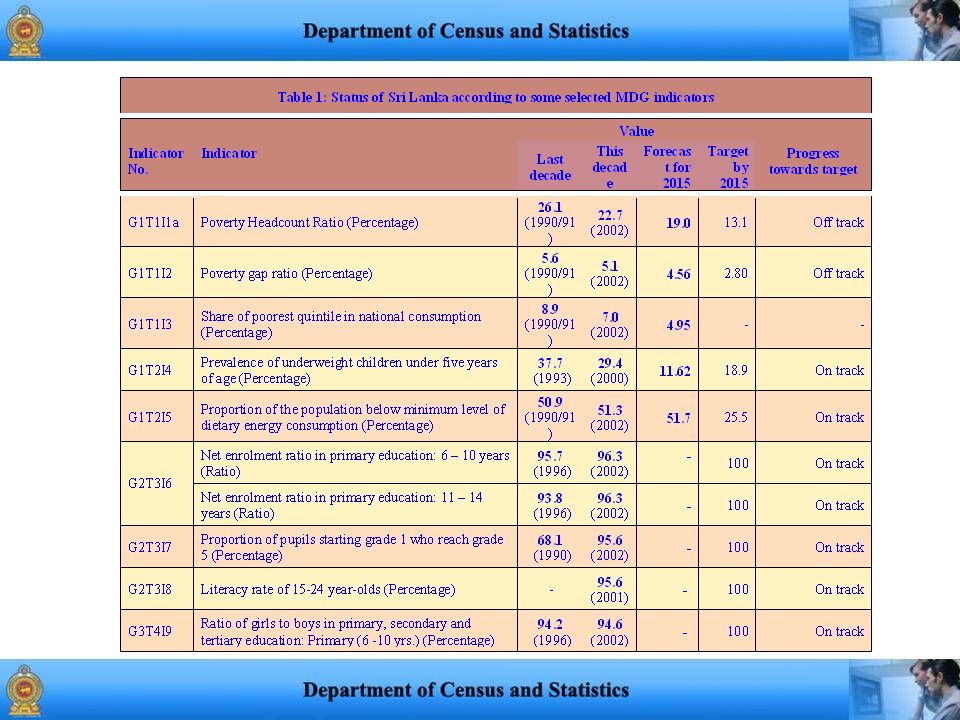
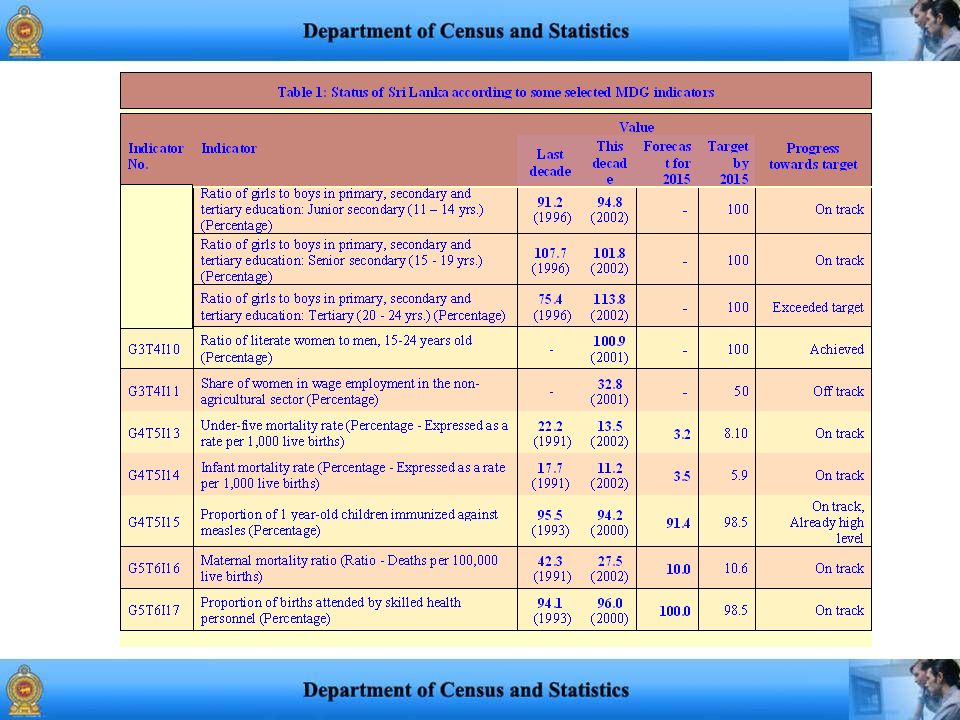
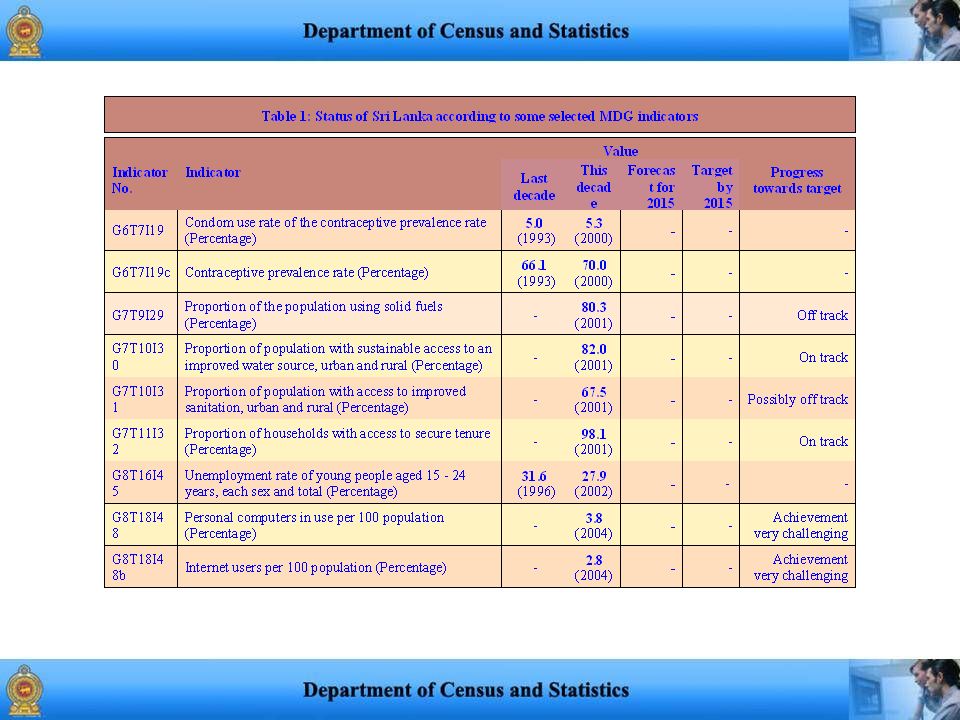
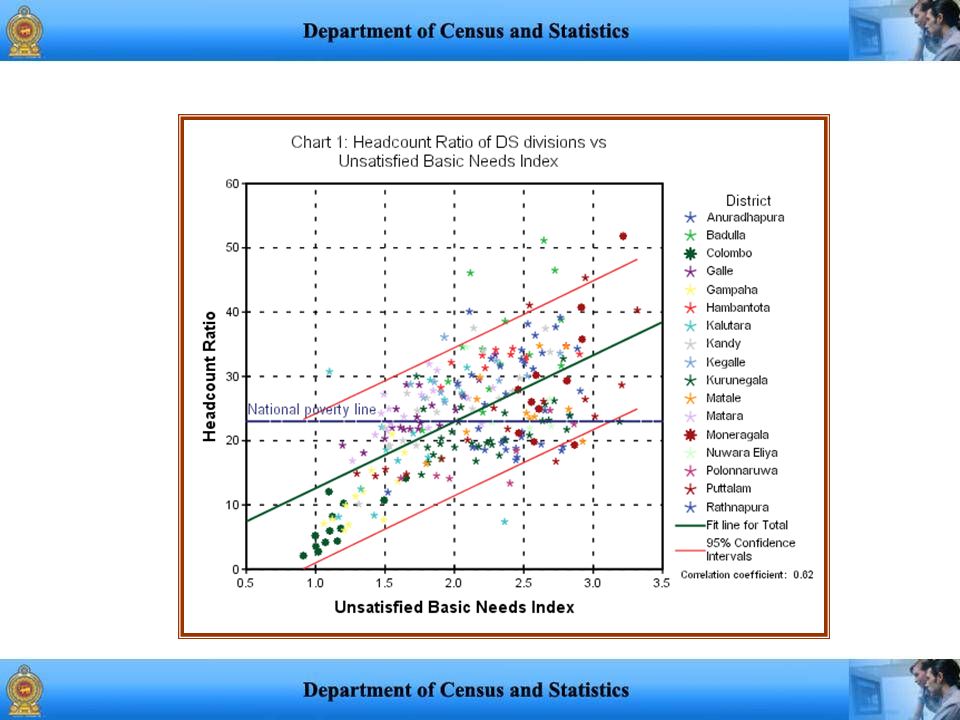
Sri Lanka is potentially on tract on most of the available MDG indicators. Among the key achievements are access to safe drinking water, equitable primary education, literacy, child and maternal health. A significant achievement is that there is no gender disparity in these achievements. However, there remain considerable challenges. The critical challenge is that 23% of Sri Lanka’s population is still living below the national poverty line.

7
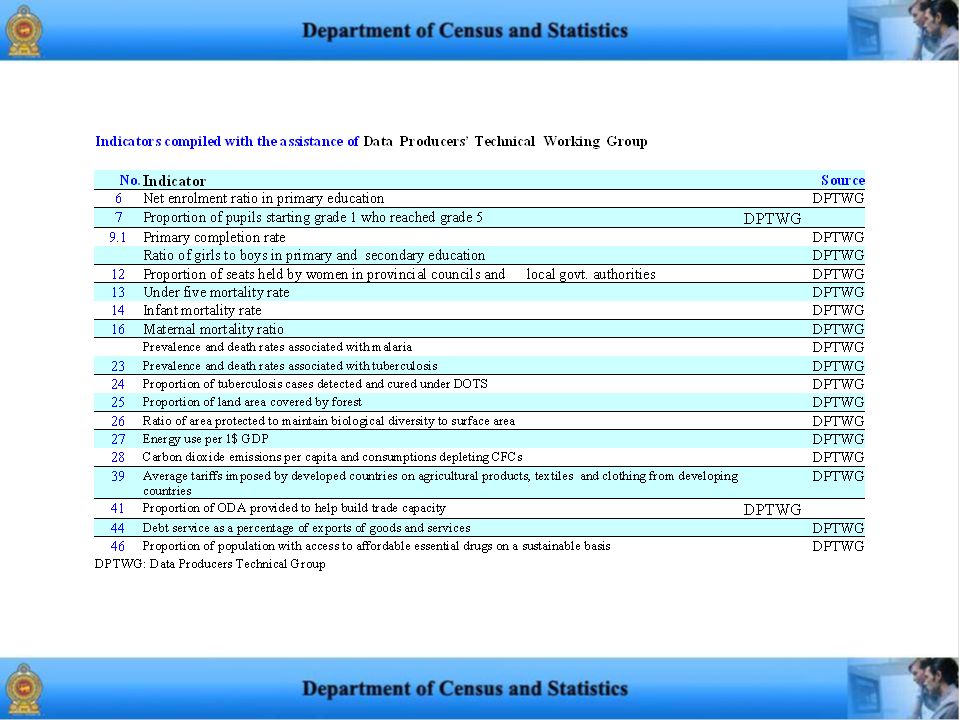
Available from regular stat. activities of DCS (15) New survey for MDG indicators (12) Expected from the Data Producers’ Working Group (13) Not possible to prepare (03) Not applicable (09) Status of indicators at a glance
 New survey for MDG indicators (12) Expected from the Data Producers’ Working Group (13) Not possible to prepare (03) Not applicable (09) Status of indicators at a glance.")
8
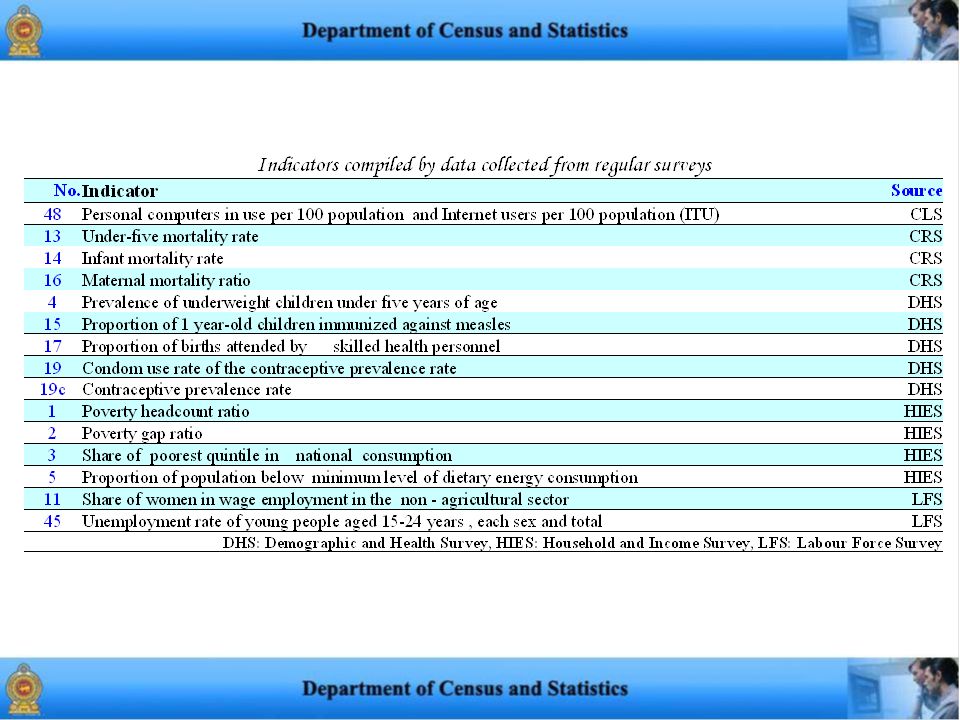
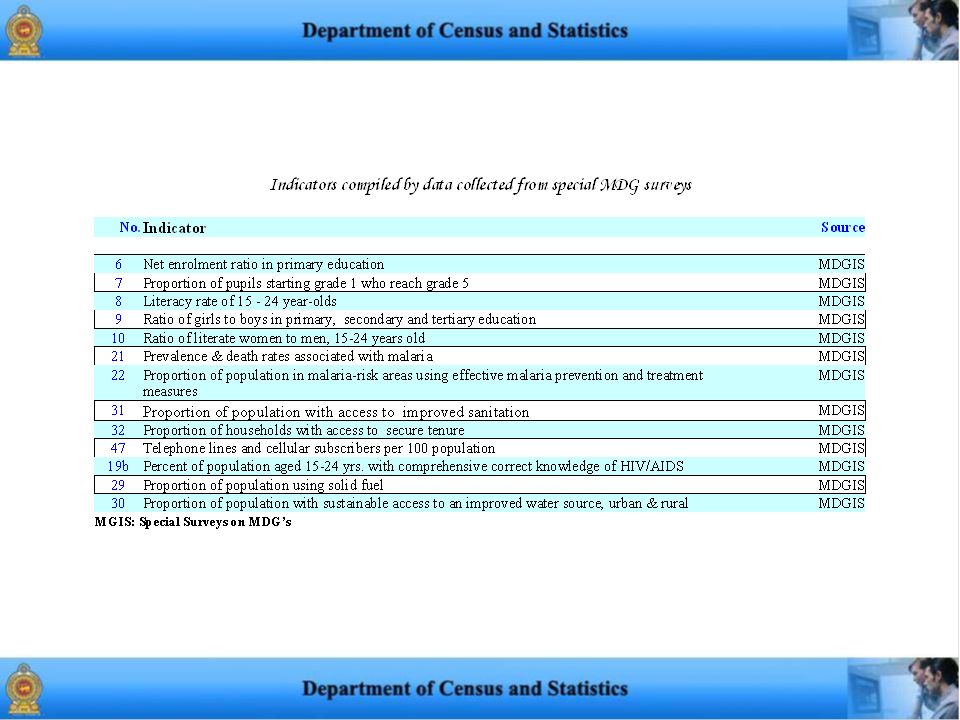
Regular Surveys New Survey Household Income & Expenditure Survey (HIES) Labour Force Survey (LFS) Demographic and Health Survey (DHS) Computer Literacy Survey (CLS) New Survey Administrative Records Survey to capture selected MDG indicators (MDGIS) Administrative Records Civil Registration System (CRS) DCS sources related to MDG indicators
 Labour Force Survey (LFS) Demographic and Health Survey (DHS) Computer Literacy Survey (CLS) New Survey Administrative Records Survey to capture selected MDG indicators (MDGIS) Administrative Records Civil Registration System (CRS) DCS sources related to MDG indicators")
10
Data Gaps and Remedial Action Data from outside sources Data from outside sources Data not available Data not available Data available with limitations Data available with limitations

13
Data not available Three indicators had to be abandoned as it is not possible to collect the required data from surveys or administrative records. Indicator No. and Name 18. HIV prevalence among pregnant women aged 15-24 yrs. 19a. Condom use at last high-risk sex 20. Ratio of school attendance of orphans(due to HIV) to school attendance of non-orphans 10-14 yrs.
 to school attendance of non-orphans yrs..")
14
1.Maps at DS division level – 2002 (An application of Small Area Estimation Technique) 2.Maps at GN division level (compiled based on the analysis measurable characteristics reflecting poverty) 3.Reports based on the analysis of HIES data Tools for monitoring poverty reduction programmes
 2.Maps at GN division level (compiled based on the analysis measurable characteristics reflecting poverty) 3.Reports based on the analysis of HIES data Tools for monitoring poverty reduction programmes")
15
a) Head count ratio (Goal 1) b) Share of poorest quintile in national consumption (Goal 1) c) Literacy rate of 15 – 24 year-olds (Goal 2) d) Net enrolment ratio in primary education (Goal 2) e) Share of women in wage employment in the non-agricultural sector (Goal 3) f) Ratio of girls to boys in education (Goal 3) g) Infant mortality rate (Goal 4) h) Under five mortality rate (Goal 4) i) Maternal mortality (Goal 5) j) Proportion of the population using solid fuels (Goal 7) k) Proportion of households with sustainable access to safe drinking water (Goal 7) l) Proportion of population with access to improved sanitation (Goal 7) Classification of districts by overall status of selected MDG indicators
 Head count ratio (Goal 1) b) Share of poorest quintile in national consumption (Goal 1) c) Literacy rate of 15 – 24 year-olds (Goal 2) d) Net enrolment ratio in primary education (Goal 2) e) Share of women in wage employment in the non-agricultural sector (Goal 3) f) Ratio of girls to boys in education (Goal 3) g) Infant mortality rate (Goal 4) h) Under five mortality rate (Goal 4) i) Maternal mortality (Goal 5) j) Proportion of the population using solid fuels (Goal 7) k) Proportion of households with sustainable access to safe drinking water (Goal 7) l) Proportion of population with access to improved sanitation (Goal 7) Classification of districts by overall status of selected MDG indicators")
16
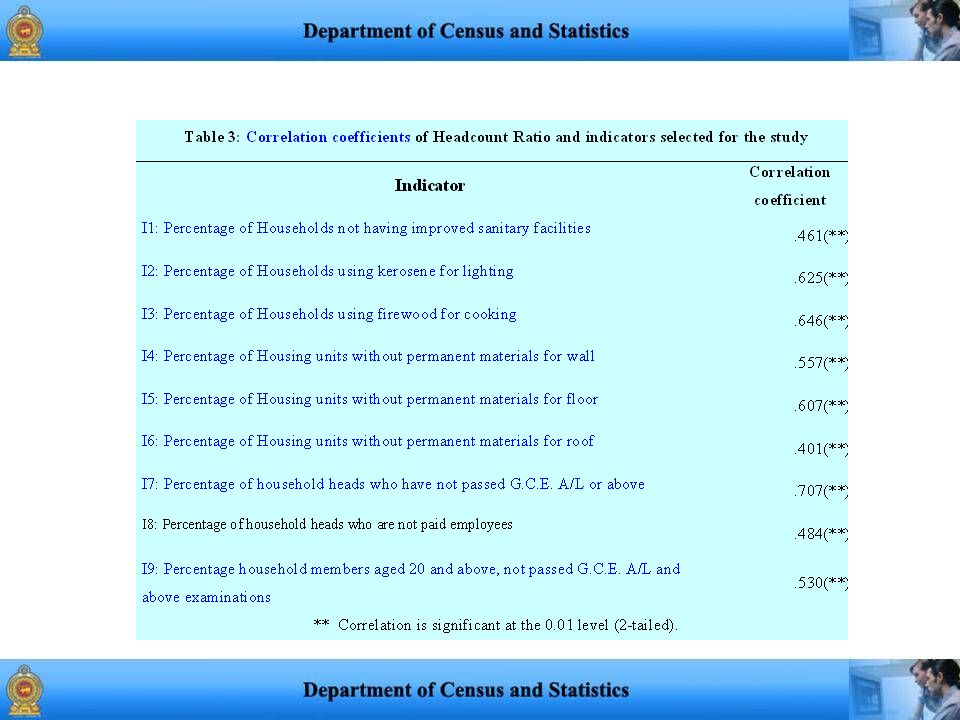
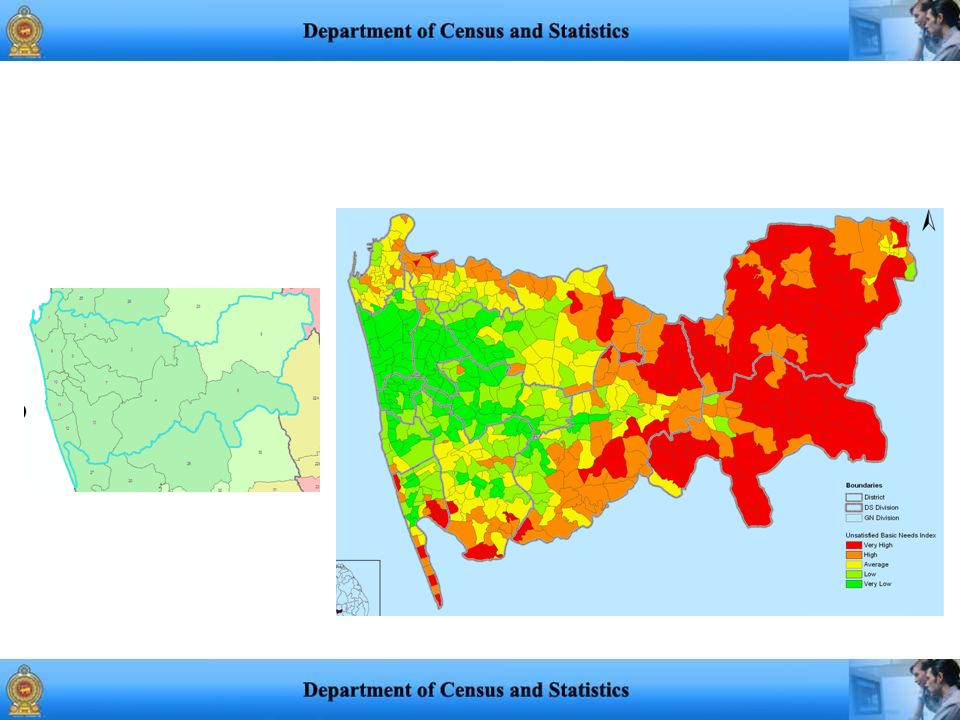
An index reflecting the overall situation with respect to a set of selected MDG indicators at district level was computed 12 indicators representing all goals but goal 6 were selected for the analysis. By applying Principal Component Analysis 12 indicators were reduced to an index retaining 80% of the total variation Districts were classified into 5 groups based on the values of this index using Natural Break method Districts shaded in red are the most backward in terms of achieving the MDGs The most deprived districts (most unsatisfactory class) are Rathnapura, Polonnaruwa, Badulla and Anuradhapura This map will be updated as data become available Comments/suggestions on this methodology are welcome A tool to facilitate monitoring progress in achieving MDG’s Findings of an exploratory study
 are Rathnapura, Polonnaruwa, Badulla and Anuradhapura This map will be updated as data become available Comments/suggestions on this methodology are welcome A tool to facilitate monitoring progress in achieving MDG’s Findings of an exploratory study.")
17
DCS has carried out several activities to disseminate available MDG indicators for Sri Lanka and to bridge data gaps. Some activities are Developing tools for monitoring impacts of poverty eradication projects Preparation of two publications Preparation of a database using DevInfo software Preparation of the web version of the MDGInfo database, which will be launched shortly Preparation of GN division boundary maps for data presentation Conducting two surveys to bridge some data gaps

18
In 2005, DCS prepared a publication presenting available indicators for monitoring MDG goals. Preparation of publications

19
MDGInfo Sri Lanka Millennium Development Goals in Sri Lanka – A Statistical Review In 2006, DCS prepared a publication presenting the trends and patterns of the available indicators and a user friendly database for monitoring MDG goals. Preparation of publications

20
Trends and patterns and whether the targets are likely to be achieved is briefly reviewed in the publication titled “ Millanium Development Goals in Sri Lanka – A Statistical Review” Preparation of publications

21
A database titled “MDGINFO – Sri Lanka” was released in 2006. This was prepared using DevInfo software. User friendly tools for storing, retrieving and presenting retrieved data by tables, charts and maps are available in this database. MDGInfo Sri Lanka Preparation of databases

22
Preperation of “MDGInfo” Online Database for Monitoring Millennium Development Goals

23
Provision of information for local level planning poverty eradication projets

24
Classification of GN Divisions by Unsatisfied Basic Needs

28
Factor extraction: communalities Communalities 1.000.553 1.000.851 1.000.822 1.000.452 1.000.940 1.000.895 1.000.776 1.000.662 1.000.867 wallper floorper roofper toityper edualper gcealper non_kero non_firw emp52pec InitialExtraction Extraction Method: Principal Component Analysis. Extraction communalities are estimates of the variance in each variable accounted for by the factors (or components) in the factor solution.
 in the factor solution..")
29
Factor extraction: Total variance explained The "Total" column gives the amount of variance in the observed variables accounted for by each component or factor.

30
This table reports the factor loadings for each variable on the components or factors after rotation. Each number represents the partial correlation between the item and the rotated factor. These correlations can help you formulate an interpretation of the factors or components.

31
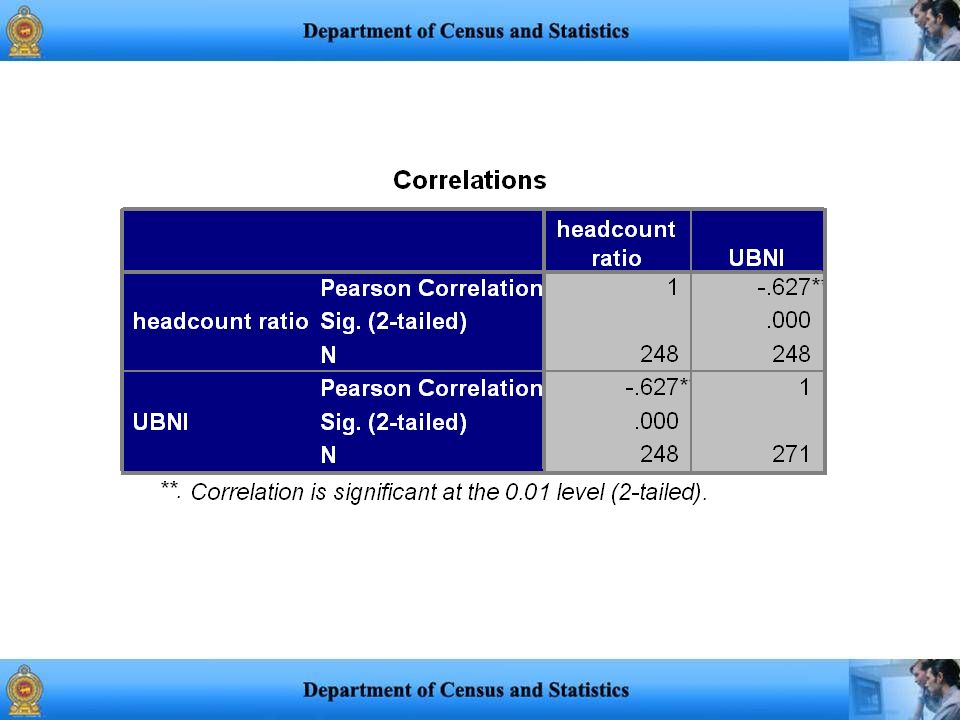
Unsatisfied Basic Needs Index compute f1 = fac1_1*.65 + fac2_1*.19 + fac3_1*.16. Natural breaks Classes are based on natural groupings of data values. ArcMap identifies break points by looking for groupings and patterns inherent in the data. The features are divided into classes whose boundaries are set where there are relatively big jumps in the data values.

32
Badulla district

34
Gampaha district

35
Galle district

Similar presentations
 and the ESCWA Region Economic and Social Commission for Western Asia (ESCWA)>")


 PEMERINTAH ACEH.>")
 Indicators on Employment, Philippines: 1999-2010 (In percent) GOAL 1: ERADICATE EXTREME POVERTY AND HUNGER Target 1.B:>")


