Download presentation
Presentation is loading. Please wait.

1
Credit Default Swaps (CDS) /Options Description A pays B a regular premium (for a CDS)/one-off premium (for a option) B pays A the credit-event payment if a credit event takes place on the reference entity Result A is short the credit risk of the reference entity B is long the credit risk of the reference entity Details What is the credit-event payment? What is the reference entity? What is a credit-event? Setting a price for the settlement: auction Uses As for TRS, BUT cleaner: no exposure to interest rate risk and no capital appreciation/depreciation adjustment There are numerous variants on the CDS: e.g. Constant Maturity CDS (CMCDS), Constant Spread Swap, Recovery Swap Credit Derivative Instruments
, Constant Spread Swap, Recovery Swap Credit Derivative Instruments.")
2
CDS Market Growth-Reference Entities

3
Credit Default Swaps - What is a credit event? –Bankruptcy – i.e. official/legal filing –Failure to pay – usually subject to a threshold –Restructuring Under ISDA definitions there are 4 standard options –Full Restructuring »Reduction in interest or principal »Delay in interest payments »Extension of maturity »Subordination of reference obligation »Restructuring as a result of credit deterioration –Modified Restructuring »As above BUT deliverable obligation limited to a maximum maturity, and must be fully transferable Credit Derivative Instruments

4
Credit Default Swaps - What is a credit event? –Modified Modified Restructuring »As for Modified restructuring BUT deliverable obligation can have a longer maturity than the restructured security and/or some conditional transferability –Cross Default/Cross Acceleration »No specific failure to pay, but a breach of covenant or other obligation »Currently rare Sovereign Credit Events –Repudiation –Moratorium These must be followed by actual failure to pay or restructuring –Within the later of 60 days or the next reference obligation payment Credit Derivative Instruments

5
Credit Default Swaps - What is a credit event payment? –Fixed Amount (digital) An amount to be paid in the case of a credit event is fixed at the outset. –Used in recovery rate swaps –Physical Delivery The protection buyer delivers obligations of the reference entity from an agreed basket with face value of the notional of the trade: the protection seller pays par –Cash Settled Default value is determined by a dealer poll and the protection seller pays the difference between par and the default value on the notional amount of the trade to the protection buyer –Auction The are often more CDS outstanding than debt obligations of the reference entity To preclude vast artificial turnover, an auction process has been established to determine the default value, which is then applied across the market. –The terms are too complex to discuss here, but see Markit/Creditex Credit Event Auction Primer Credit Derivative Instruments
 An amount to be paid in the case of a credit event is fixed at the outset. –Used in recovery rate swaps –Physical Delivery The protection buyer delivers obligations of the reference entity from an agreed basket with face value of the notional of the trade: the protection seller pays par –Cash Settled Default value is determined by a dealer poll and the protection seller pays the difference between par and the default value on the notional amount of the trade to the protection buyer –Auction The are often more CDS outstanding than debt obligations of the reference entity To preclude vast artificial turnover, an auction process has been established to determine the default value, which is then applied across the market. –The terms are too complex to discuss here, but see Markit/Creditex Credit Event Auction Primer Credit Derivative Instruments.")
6
What is the reference entity? Or on what is the credit protection? –Reference Entity The specific entity subject to the CDS –Mergers/Spin-offs are covered by rules –Reference Obligations Used to determine the seniority of the deliverable obligation –Obligations Which obligations can trigger a credit event –All borrowed money »Including loans, bonds, deposits etc –Bonds and/or loans –A specific security of loan »e.g. the 5% of 2020 Credit Derivative Instruments

7
What is the reference entity? Or on what is the credit protection? –Deliverable Obligations What can be delivered by the protection buyer in the case of a credit event –Bonds, Loans –Maximum maturity –Currency –Etc –These conditions determine the pool of potential deliverable assets in the case of a credit event, from which the protection buyer will choose the cheapest to deliver. –The wider the definition, the greater the value of the protection And the greater its cost Credit Derivative Instruments

8
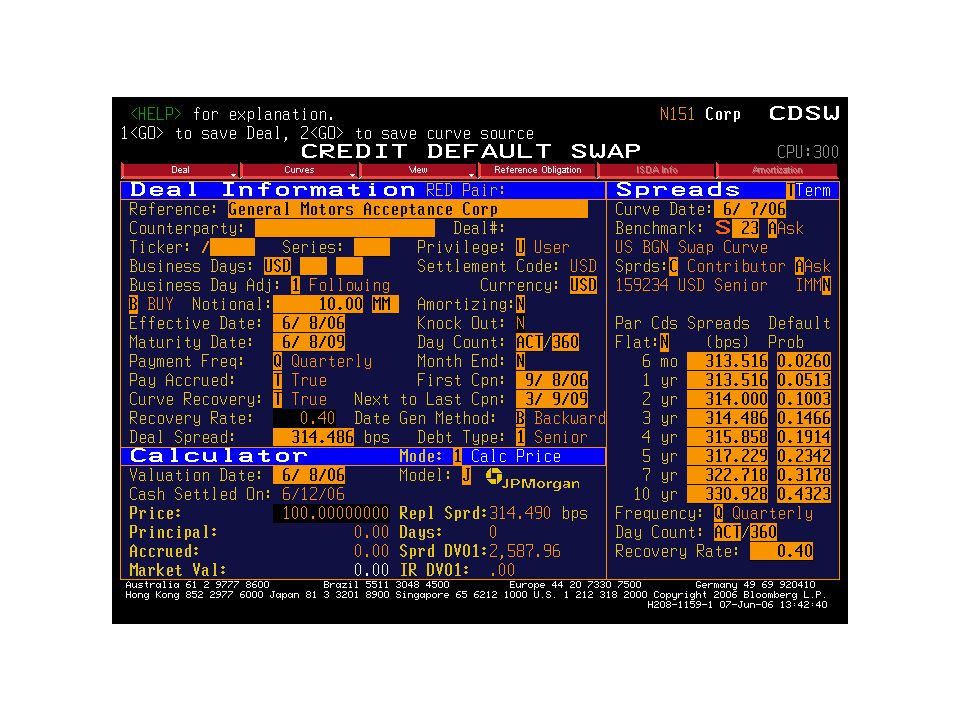
Credit Default Swaps (Recap) A Credit Default Swap (CDS) is a contract in which the writer offers the buyer protection against a credit event in a reference name for a specified period of time in return for a premium payment. Typical CDS cash flows –The buyer pays a premium quarterly in arrears. –The contract pays par in return for 100 nominal of debt if the reference name suffers a credit event before the maturity of the deal. –Note that settlement can take various forms, but as seen above is definitely moving towards an auction procedure

9
CDS Structure Protection Buyer Protection Seller Quarterly premium in arrears Protection Buyer Protection Seller Defaulted debt of reference name Par less fraction of premium Pre-default Post-default

14
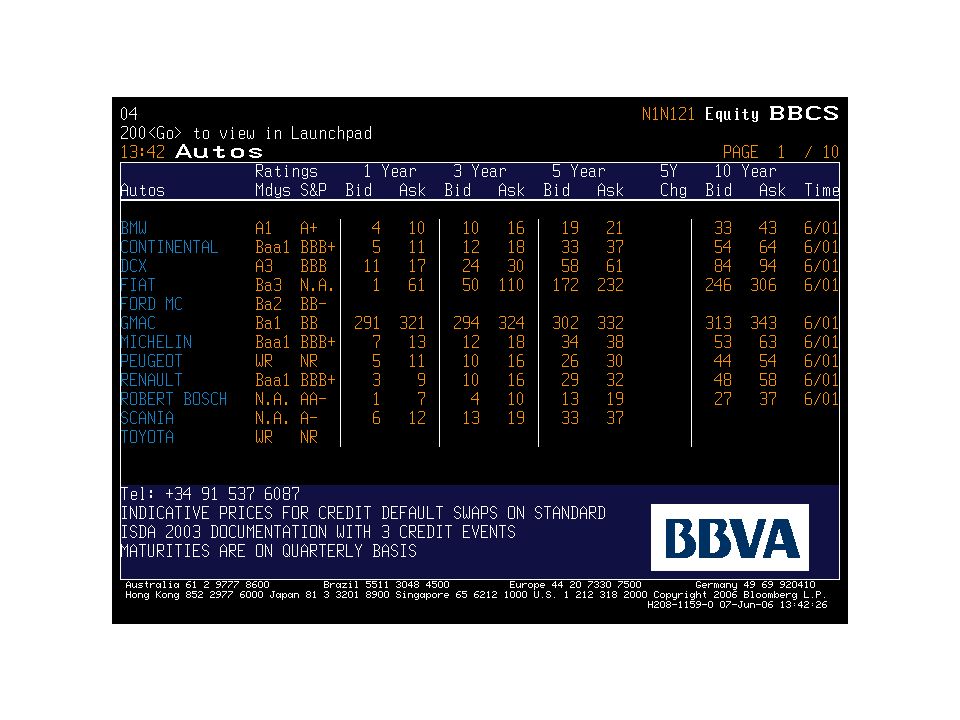
CDS Example Protection Buyer Protection Seller 314.486 bps quarterly in arrears Protection Buyer Protection Seller $1,000,000 plus fraction of premium Pre-default Post-default $1,000,000 Par GMAC

15
Par Asset Swap Example Interest Rate Swap Desk AS Trading Desk Investor FloatingFloating payments +par at maturity ParFixed Market Cash=Bond Dirty Price Fixed Coupon Credit Bond

16
CDS - Asset Swap Hedge Interest Rate Swap Desk AS Trading Desk Investor/ Protection Buyer FloatingFloating payments +par at maturity ParFixed Market Cash=Bond Dirty Price Fixed Coupon Credit Bond Protection Seller Quarterly premium in arrears and defaulted debt upon default Par less fraction of premium upon default

21
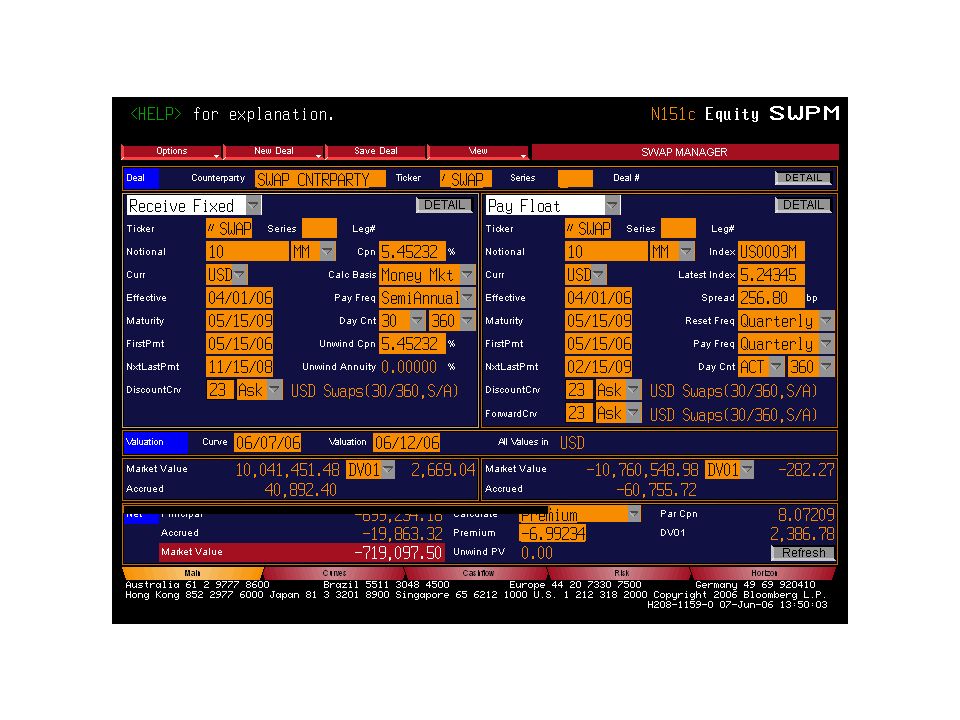
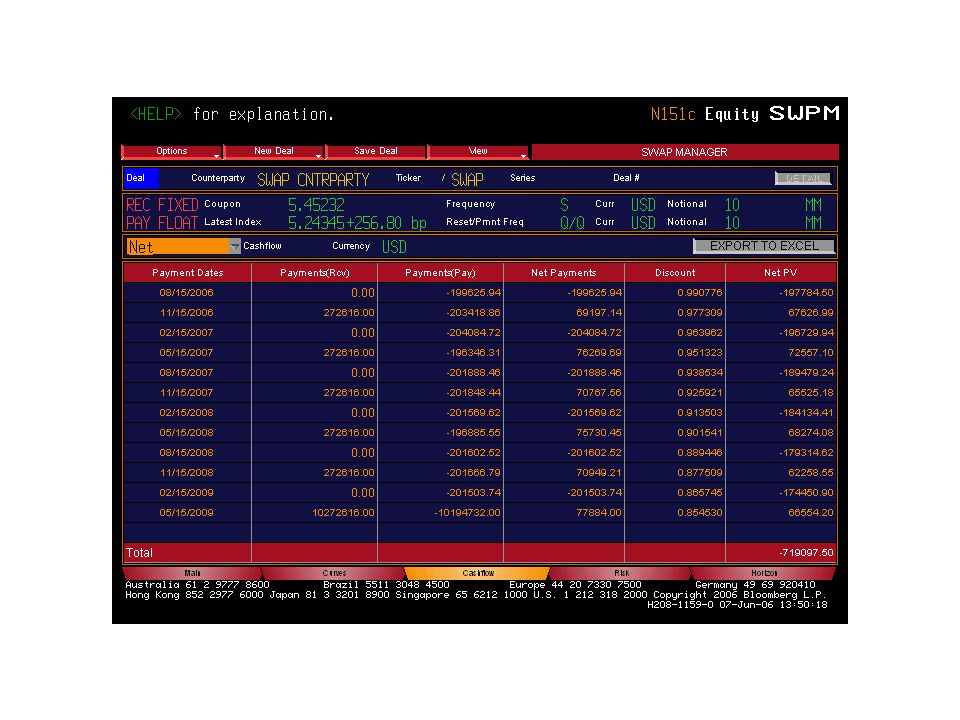
CDS - Asset Swap Hedge Example Interest Rate Swap Desk AS Trading Desk Investor/ Protection Buyer Market Protection Seller $10,000,000 Par GMAC 5 5/8s of 5/15/2009 Floating 3M LIBOR+273.7bps $10,000,000 initially Fixed 5.45232% semi-annual Floating 3M LIBOR+256.8 bps 314.486 bps quarterly in arrears $10,000,000 less partial premium on default event $10,000,000 par of GMAC debt on default event $9,300,000+$42,187.50=$9,342,187.50

22
Initial Cash flows Interest Rate Swap Desk AS Trading Desk Investor/ Protection Buyer Market Protection Seller $10,000,000 Par GMAC 5 5/8s of 5/15/2009 $9,300,000+$42,187.50=$9,342,187.50 $10,000,000 initially $719,881

23
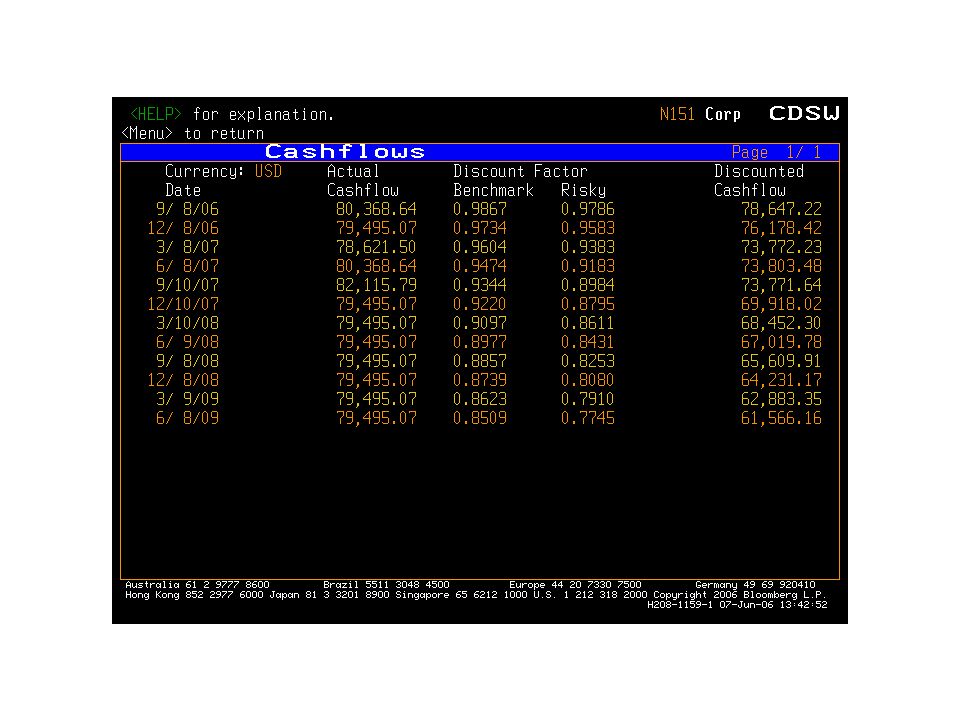
Typical Periodic Cash flows Interest Rate Swap Desk AS Trading Desk Investor/ Protection Buyer Market Protection Seller $281,250 semi-annually LIBOR+$68,425 quarterly (approx. $204,200) $272,616 semi-annually LIBOR+$64,200 quarterly (approx. $200,000) $79,495 quarterly
 $272,616 semi-annually LIBOR+$64,200 quarterly (approx. $200,000) $79,495 quarterly.")
24
Cash flows on Default Interest Rate Swap Desk AS Trading Desk Investor/ Protection Buyer Market Protection Seller $10,000,000 Par defaulted GMAC 5 5/8s of 5/15/2009 $10,000,000 less partial premium Unwind IR swap $10,000,000 Par defaulted GMAC 5 5/8s of 5/15/2009 or similar

25
Is the Protection Buyer Hedged? Upon default, the protection buyer –receives $10m from the protection seller and (assuming 40% recovery) –delivers defaulted debt worth $4m. At the inception of the contract, the GMAC note was only worth $9.3m. So the buyer receives a net of $6m from the CDS, –but has really lost only 9.3-4=$5.3m. So the buyer has too much CDS. The correct hedge ratio is given by In this case the protection buyer should buy $10m x (.93-.4)/(1-.4)=$8.9m notional CDS to be hedged. (Note the assumption of the recovery rate!)
 –delivers defaulted debt worth $4m. At the inception of the contract, the GMAC note was only worth $9.3m. So the buyer receives a net of $6m from the CDS, –but has really lost only 9.3-4=$5.3m. So the buyer has too much CDS. The correct hedge ratio is given by In this case the protection buyer should buy $10m x (.93-.4)/(1-.4)=$8.9m notional CDS to be hedged. (Note the assumption of the recovery rate!).")
26
CDS Basis A number of factors observed in the market serve to make –the price of credit risk that has been established synthetically using credit default swaps to differ from –the price as traded in the cash market using asset swaps. Identifying such differences gives rise to arbitrage opportunities that may be exploited by basis trading in the cash and derivative markets. This in known as trading the credit default basis and involves either buying the cash bond and buying a CDS on this bond, or selling the cash bond and selling a CDS on the bond. The difference between the synthetic credit risk premium and the cash market premium is known as the basis. CDS Premium – Z-Spread = basis (Z-spread = spread vs discount curve/zero-coupon curve)
.")
27
CDS Basis Basis=314.486-291.9=22.586 Interest Rate Swap Desk AS Trading Desk Investor/ Protection Buyer Market Protection Seller $930,000+$4,218.75=$934,218.75 Floating 3M LIBOR+273.7bps $1,000,000 Fixed 5.45232% semi-annual Floating 3M LIBOR+256.8 bps 314.486 bps quarterly in arrears $10,000,000 Par GMAC 5 5/8s of 5/15/2009 Z-Spread=291.9

28
CDS Basis The basis is usually positive, occasionally negative, and arises from a combination of several factors, including –Bond identity: The bondholder is aware of the exact issue that they are holding in the event of default However, default swap sellers may receive potentially any bond from a basket of deliverable instruments that rank pari passu with the cash asset. This is the delivery option held by the protection buyer –Depending on the precise reference credit, the CDS may be more liquid than the cash bond, resulting in a lower CDS price, –or less liquid than the bond, resulting in a higher price –Shorting the bond/asset swap may be expensive or impossible –The CDS events of default may be broader than bankruptcy/failure to pay

29
Basket Swaps /Options Description A pays B a regular premium (for a swap)/one-off premium (for an option) B pays A a set notional amount when (if) the nth (usually the FIRST) credit event takes place on ANY of the reference entities in the basket Result A is short the credit risk of the whole basket of reference entities B is long the credit risk of the basket of reference entities Details The basket will usually contain between 3 and 10 reference entities The premium will depend on the number and quality of the credits, as well as the correlation between the credits. Note that the LOWER the correlation, the HIGHER the risk of one credit event (and so the higher the premium) Credit Derivative Instruments
 Credit Derivative Instruments.")
30
Collateralised Debt Obligations (CDOs), and variants Description STANDARD A pool of bonds or loans is restructured into tranches: payments from the pool’s cash-flows are first made to the highest rated tranche, then to the second-highest rated tranche etc so that any default is borne by the lower tranches first. SYNTHETIC As above, except that a pool of CDSs is used instead of cash assets Credit Derivative Instruments

31
CDOs Original objective to remove assets from balance sheet –And achieve capital relief Basic Mechanics –Set up Special Purpose Vehicle (SPV) Independent, non-consolidated, bankruptcy-remote Sole purpose to handle income stream from assets –i.e. receive funds and distribute to note holders –SPV holds assets and issues notes backed by these assets –Notes (CDOs) structured in Tranches First Tranche = Senior Tranche = AAA Mezzanine Tranche(s) <AAA but Investment Grade Lowest Tranche = “Equity”, bears first loss
 structured in Tranches First Tranche = Senior Tranche = AAA Mezzanine Tranche(s) <AAA but Investment Grade Lowest Tranche = Equity , bears first loss.")
32
Generic CDO Structure CDO Special Purpose Vehicle (SPV) Subordinated Notes Equity Mezzanine Fixed or Floating Rate Notes Senior Fixed or Floating Rate Notes Diversified Pool of Underlying Assets (Collateral) Collateral Manager
 Subordinated Notes Equity Mezzanine Fixed or Floating Rate Notes Senior Fixed or Floating Rate Notes Diversified Pool of Underlying Assets (Collateral) Collateral Manager")
33
CDOs Basic Mechanics –If losses on the assets held by the SPV occur They are applied first to the “Equity” or lowest tranche –Which reduces in size –If losses outgrow the size of the Equity tranche They are applied to the next lowest tranche –And so on –INCOME flows to the Senior tranche first and then DOWN –LOSSES flow to the Lowest tranche first and then UP –Note : the Equity tranche is usually retained by the originator

34
CDOs Rating the Tranches –The ratings agencies each have models for evaluating CDOs See their web sites for further details –The key parameters for rating are Quality of underlying assets –Actual ratings apply BUT –If there is no rating for a particular asset going into a CDO »The rating agency may apply a “shadow” rating »Or may rely on mapping the originators internal rating Diversification of underlying assets –Moody’s and S&P rely on geographical and industry categories –Fitch looks to equity correlations

35
CDOs Rating the Tranches –Key Parameters Subordination structure of the tranches –The larger the size of tranches below a given tranche »The more protection the given tranche has (since losses apply first to the ones below) »And the higher the rating Additional Credit Enhancements –Credit Insurance »e.g. from monoline –Credit derivative

36
Synthetic CDOs Basic Mechanics –Tranche system is the same as with standard CDOs Senior through Mezzanine to Equity –But proceeds of the Notes (tranches) used to Purchase high-quality assets (collateral) –Which fund notes issued Purchase portfolio of CDS from originator –i.e. SELL protection to originator –CDS premium also goes to funding notes –Effect is same as with standard CDO Less expensive and faster than using physical assets –In the case of a credit event SPV sells collateral to pay originator And reduces size of relevant tranche –Equity tranche reduced first and so on

37
Partially Funded Synthetic CDOs Senior Tranche is very large (80%+) –Known as “Super Senior” –Effective rating HIGHER than AAA –Retained by originator Only Mezzanine tranches are sold to investors –Proceeds retained to purchase high-quality collateral CDS only created for tranches sold Specialised CDS Tranches from Credit Indices –See below
 –Known as Super Senior –Effective rating HIGHER than AAA –Retained by originator Only Mezzanine tranches are sold to investors –Proceeds retained to purchase high-quality collateral CDS only created for tranches sold Specialised CDS Tranches from Credit Indices –See below")
38
Partially Funded Synthetic CDOs Example –$100 million underlying $5 million in Equity tranche $80 million in Super-Senior Tranche –$15 million Mezzanine Tranche –CDS covering losses beyond the first 5% loss –and up to 20% loss –Loss coverage of 15% –Which constitutes credit exposure of Mezzanine tranches

39
Static vs.. Managed CDOs Original CDOs were static –i.e. the underlying portfolio essentially unchanged for life of CDO CDOs now largely managed Manager can typically –Trade portfolio assets Up to a predefined level –e.g. 5% per annum –Buy additional protection on deteriorating credits held –Sell swaps that have increased in value –Replace positions for higher spreads Time liquidation of defaulted assets –To maximise recovery rates

40
CDO Managers now largely specialised third-party –i.e. NOT originating bank –Own the Equity tranche –Generate excess spread Moral Hazard –Will the managers restructure portfolio to own advantage And to detriment of other tranches? –Senior tranches want higher diversification=lower correlation of assets Higher chance of smaller loss –Absorbed by Equity tranche (etc) –Equity tranche wants lower diversification=higher correlation of assets Lower chance of higher loss Answer: –Reserve pool accumulates excess spread Offsets excess credit losses Only excess spread NET OF LOSSES accrue to Equity tranche Static vs.. Managed CDOs
 –Equity tranche wants lower diversification=higher correlation of assets Lower chance of higher loss Answer: –Reserve pool accumulates excess spread Offsets excess credit losses Only excess spread NET OF LOSSES accrue to Equity tranche Static vs.. Managed CDOs.")
41
Credit Derivative Instruments Credit Indices –Description 1]Corporate indices 2] CDS indices –Result Buyer is long (more or less general) credit Seller is short (more or less general) credit –Details Constituents of Indices and their tranches change –Corporate index constituents change every month –Exclusively rules-based –CDS index constituents change every 6 months –Based on liquidity recommendations from active dealers
![Credit Derivative Instruments Credit Indices –Description 1]Corporate indices 2] CDS indices –Result Buyer is long (more or less general) credit Seller is short (more or less general) credit –Details Constituents of Indices and their tranches change –Corporate index constituents change every month –Exclusively rules-based –CDS index constituents change every 6 months –Based on liquidity recommendations from active dealers](http://images.slideplayer.com/24/7543903/slides/slide_41.jpg "Credit Derivative Instruments Credit Indices –Description 1]Corporate indices 2] CDS indices –Result Buyer is long (more or less general) credit Seller is short (more or less general) credit –Details Constituents of Indices and their tranches change –Corporate index constituents change every month –Exclusively rules-based –CDS index constituents change every 6 months –Based on liquidity recommendations from active dealers")
42
Credit Indices Two groups of banks independently formed companies to create and market indices of CDS prices in 2003 Now merged, and currently (!) Markit Two PRIMARY indices –North American Investment Grade –European Investment Grade –Each consists of 125 most liquid CDS reference credits –Composition reviewed twice a year (“the roll”) Changed to reflect liquidity –New Indices constantly under development
 Markit Two PRIMARY indices –North American Investment Grade –European Investment Grade –Each consists of 125 most liquid CDS reference credits –Composition reviewed twice a year ( the roll ) Changed to reflect liquidity –New Indices constantly under development")
43
Basic Mechanics –Each series has a fixed spread for the life of the index –Current pricing reflected by exchanging the difference between current price and fixed spread Fixed spread is 50bps, current price 53bps –Protection buyer pays up-front (53 – 50 =) 3bps –Protection buyer pays annual fixed spread »To Protection seller Fixed spread is 50bps, current price is 46bps –Protection Buyer receives up-front 4bps »From Protection seller –Protection buyer pays annual fixed spread »To Protection seller Credit Indices
 3bps –Protection buyer pays annual fixed spread »To Protection seller Fixed spread is 50bps, current price is 46bps –Protection Buyer receives up-front 4bps »From Protection seller –Protection buyer pays annual fixed spread »To Protection seller Credit Indices")
44
Basic Mechanics –On default of one of the Reference credits in the index Protection buyer delivers securities –Face amount of 1/125 (i.e. 0.8%) of notional value of trade –To protection seller Protection seller pays 0.8% of the notional trade –To protection buyer Notional on the trade reduced by 0.8% Tranches –Index traded whole –OR in standardised tranches Designed to look like those of a CDO –Described in percentage of loss terms »e.g. 7%-10% tranche of NAIG covers losses on the NAIG index greater than 7% and up to 10% Credit Indices
 of notional value of trade –To protection seller Protection seller pays 0.8% of the notional trade –To protection buyer Notional on the trade reduced by 0.8% Tranches –Index traded whole –OR in standardised tranches Designed to look like those of a CDO –Described in percentage of loss terms »e.g. 7%-10% tranche of NAIG covers losses on the NAIG index greater than 7% and up to 10% Credit Indices.")
45
The Tranche structure –Greatly facilitates the creation and hedging of CDOs –Require highly sophisticated models to value and trade –Have complex interrelational dynamics –Default and Recovery assumptions key Correlation: –Default correlation among constituent reference credits key valuation assumption INCREASE in correlation –INCREASE expected losses in Senior tranches »So value of protection increases –DECREASE expected losses in Equity tranche »So value of protection decreases Credit Indices

46
Specific Implementing a view on the creditworthiness of a specific sector In general Long or short a CDS Index vs. another sector Long or short a CDS Index vs. another Implementing a view on the creditworthiness of a specific issuer In General Long or short a specific CDS “Selling” insurance = going long of the credit “Buying” insurance = going short the credit vs. Another Long CDS on one credit vs. short CDS on another credit Credit Pair Trades 1] Carry Trade 2] Directional trade Implementing a view on the capital structure of one credit e.g. Senior vs. Subordinated or Convertible vs. Straight Using credit instruments practically

47
PARMALAT Parmalat Finanziara SpA Parmalat SpA Parmalat Finance Corp BV (single guarantee from Parmalat SpA) €650mm 6.25% ’05 €350mm 6.125% ‘10 Parmalat Netherlands BV (guaranteed by Parmalat SpA and Parmalat Finanziara SpA) €350mm CB 0.875% ’21 Parmalat Capital Netherlands BV (Single guarantee from Parmalat Finanziara SpA) €281mm CB 1% ‘05 Other Subsidiaries Non-directional pair trade – profit from volatility without directional risk
 €650mm 6.25% ’05 €350mm 6.125% ‘10 Parmalat Netherlands BV (guaranteed by Parmalat SpA and Parmalat Finanziara SpA) €350mm CB 0.875% ’21 Parmalat Capital Netherlands BV (Single guarantee from Parmalat Finanziara SpA) €281mm CB 1% ‘05 Other Subsidiaries Non-directional pair trade – profit from volatility without directional risk")
48
PARMALAT 11/12/03 : Long €1mm Parmalat CB 0.875% ’21 @ 62 – 0.4 accrued 11/12/03 : Short €1mm Parmalat 6.25% ’05@ 64 + 5.5 accrued Performance of the pair trade in a bankruptcy scenario. Base Recovery Rate (RR) for bondholders assumed to be @ 15% Double Guarantee on CB 0.875% 2021 increases RR to 30% in best case outcome. Accrued Interest pickup = 5.1 points Expected Return (Worst Case: both bonds RR @15%) = 2 + 0 + 5.1 = 7.1 points Expected Return ( Best Case: double guarantee gives full 30 point value) = 2 + 15 + 5.1 = 22.1points Non-directional pair trade – profit from volatility without directional risk
 for bondholders assumed to 15% Double Guarantee on CB 0.875% 2021 increases RR to 30% in best case outcome. Accrued Interest pickup = 5.1 points Expected Return (Worst Case: both bonds = = 7.1 points Expected Return ( Best Case: double guarantee gives full 30 point value) = = 22.1points Non-directional pair trade – profit from volatility without directional risk.")
49
PARMALAT Short covered Long / Short Trade Unwind Non-directional pair trade Long Parmalat CB 0.875% ‘21 @ 62 Short Parmalat 6.25% ‘5 @ 64 Accrued Interest pickup = 5.1 points Parmalat files for Bankruptcy on 19/12/03 Long / Short unwound @ Px of 24 & 20 Profit: (24-62) + (64 – 20) +5.1= 11.1 points On €10mm, Gross Profit = €1.11mill. Non-directional pair trade – profit from volatility without directional risk

50
Opportunistic Basis packages: specific arbitrage opportunities Synthetic vs. real bond Basis packages are the purchase (sale) of specific credit exposure in the cash market and the simultaneous sale (purchase) of the same risk in the CDS market, ideally at two different prices. Two “basic” basis strategies. 1]A “negative basis” package strategy (buy bond and buy protection) is typically motivated by a relatively low spread in the CDS market relative to comparable cash bond spread (i.e., an attempt to earn a risk-less return by buying and selling the same credit in different markets). 2]A “positive basis” package strategy (sell bond and sell protection) is the opposite — an attempt to take advantage of a relatively high CDS spread relative to the cash market. Using credit instruments practically
 of specific credit exposure in the cash market and the simultaneous sale (purchase) of the same risk in the CDS market, ideally at two different prices. Two basic basis strategies. 1]A negative basis package strategy (buy bond and buy protection) is typically motivated by a relatively low spread in the CDS market relative to comparable cash bond spread (i.e., an attempt to earn a risk-less return by buying and selling the same credit in different markets). 2]A positive basis package strategy (sell bond and sell protection) is the opposite — an attempt to take advantage of a relatively high CDS spread relative to the cash market. Using credit instruments practically.")
51
Hedging S&P Exposure with CDX Pros and cons of hedging with CDX Indices Historical relationship (2005-2007) How correlation has evolved in recent months Performance during major sell-offs Estimate the “appropriate” hedge ratio Correlation between stocks and credits (Example: S&P 500 and CDX HY) Real world experience: S&P 500 and CDX HV9 – performance since the last roll
 How correlation has evolved in recent months Performance during major sell-offs Estimate the appropriate hedge ratio Correlation between stocks and credits (Example: S&P 500 and CDX HY) Real world experience: S&P 500 and CDX HV9 – performance since the last roll")
52
Pros and cons of hedging with credit indices What the CDX indices can do: One way to hedge against “tail risk” – CDX indices provide an effective hedge against a sharp and unexpected decline in the stock market A potential P&L driver – CDX indices allow equity investors to profit from the diverging trends in the equity and credit markets What the CDX indices cannot do: Not a perfect hedge – Using credit indices to hedge equity exposure entails basis risk Not always the cheapest hedge – Equity futures, ETF, options collars may provide cheaper ways to hedge a long equity position

53
-20% -10% 0% 10% 20% 30% 1/053/055/057/059/05 11/05 1/06 3/06 5/06 7/069/06 11/06 1/073/075/07 7/07 9/07 11/07 1/08 (bp) -200 -100 0 100 200 300 Correlation between S&P 500 and CDX HY Index Source: UBS, Bloomberg Cumulative change: S&P 500 and HY CDX Index Correlation: – 0.7 S&P 500 HY Index (left axis) (right axis)
 Correlation between S&P 500 and CDX HY Index Source: UBS, Bloomberg Cumulative change: S&P 500 and HY CDX Index Correlation: – 0.7 S&P 500 HY Index (left axis) (right axis)")
54
How correlation has evolved over time Source: UBS, Bloomberg S&P 500 (X-axis) and Cumulative Change in CDX HY Index (Y-axis), 2005 - 2007 -200 -150 -100 -50 0 50 100 150 200 10001100120013001400150016001700 Even though spread volatility has gone up in 2H07, correlation between stocks and credits remain quiet strong (bp)
 and Cumulative Change in CDX HY Index (Y-axis), Even though spread volatility has gone up in 2H07, correlation between stocks and credits remain quiet strong (bp)")
55
-20% -10% 0% 10% 20% 30% 1/053/055/057/059/05 11/05 1/06 3/06 5/06 7/069/06 11/06 1/073/075/07 7/07 9/07 11/07 1/08 Correlation spikes during market sell-offs Source: UBS, Bloomberg Cumulative change: S&P 500 and HY CDX Index S&P 500 HY Index (left axis) (right axis)
 (right axis)")
56
What about hedge ratio? Given the strong negative correlation between stocks and credits, the CDX HY Index seems like a reasonably good hedge against “tail risk”… … but what is the appropriate hedge ratio? … if you are long $10mm of stocks, how much HY should you short?

57
Estimate the appropriate hedge ratio: Historical correlation Source: UBS, Bloomberg S&P 500 (X-axis) and Cumulative Change in CDX HY Index (Y-axis), 2005 - 2007 -200 -150 -100 -50 0 50 100 150 200 10001100120013001400150016001700 (bp) –100 +120 2H07 2005 – 1H07
 and Cumulative Change in CDX HY Index (Y-axis), (bp) – H – 1H07")
58
Estimate the appropriate hedge ratio: Focus on the big sell- offs Source: UBS, Bloomberg S&P 500 and HY Index week-over-week performance comparison -4.7% -3.5% -2.5% -1.4% -0.5% 0.5% 1.4% 2.4% 3.4% 4.4% -6.0% -4.0% -2.0% 0.0% 2.0% 4.0% 6.0% Down >4% Down 3-4% Down 2-3% Down 1-2% Down 0-1% Up 0-1% Up 1-2% Up 2-3%Up 3-4% Up >4% S&P 500 average 1-week change in % (left axis) 61 32 25 12 3 -3 -7 -20 -30 -48 -75 -50 -25 0 25 50 75 HY Index average 1 change in bp (right axis)
 HY Index average 1 change in bp (right axis)")
59
S&P 500 average 1-week change in % -75 -50 -25 0 25 50 75 HY Index average 1 change in bp Down >4% Down 3-4% Down 2-3% Down 1-2% Down 0-1% Up 0-1% Up 1-2% Up 2-3%Up 3-4% Up >4% Estimate the appropriate hedge ratio: Focus on the big sell-offs Source: UBS, Bloomberg Focus on the “tail” -4.7% -6.0% -4.0% -2.0% 0.0% 2.0% 4.0% 6.0% 61

60
Real world example: Source: UBS, Bloomberg If you went short HY9 in October against a long position in the S&P, how would you have done? 1375 1425 1475 1525 1575 4/075/076/077/078/079/0710/0711/0712/0713/07

61
Real world example: P&L estimate -$800,000 -$400,000 $0 $400,000 $800,000 $1,200,000 9/27/0710/11/0710/25/0711/8/0711/22/0712/6/0712/20/071/3/08 Total P&L Long S&P 500 ($10mm notional, P&L includes dividend received) Short HY9 ($22mm notional, P&L includes premium paid) Gains from the short HY position more than offset the losses in equities Source: UBS, Bloomberg
 Short HY9 ($22mm notional, P&L includes premium paid) Gains from the short HY position more than offset the losses in equities Source: UBS, Bloomberg")
62
Lessons from the recent credit market turmoil If it’s too good to be true, it probably isn’t true When a new asset class is securitised, what is the historical data for Default probability? Recovery rate? Etc? Sub-prime mortgages could not realistically be modelled using existing data Importance of liquidity Liquidity is essentially subjective i.e. it can change with market perceptions Usually straightforward to ESTIMATE relatively i.e. a UST is more liquid than a AAA and AAA more liquid than BBB etc There are also rules of thumb: Size of issue Age of issue Number of traders (the 2” rule) BUT there can be unexpected (and unpredictable) effects e.g. interbank liquidity Note : LIBOR became illiquid, but not EONIA
 BUT there can be unexpected (and unpredictable) effects e.g. interbank liquidity Note : LIBOR became illiquid, but not EONIA.")
Similar presentations


 is a contract in which the writer offers the buyer protection against a credit event in a reference name.>")


 FIN 200: Personal Finance Topic 19–Bonds Lawrence Schrenk, Instructor.>")


