Download presentation
Presentation is loading. Please wait.

1
Undersea Cable Network Capt Matthew Bohman & LCDR Charles Burton OA 4202 Network Flows & Graphs June 7, 2012

3
Network Overview Physical structure Number of Cables Operations & Ownership

4
Network Capacity Cable design capacity Lit capacity Capacity increases

5
Scope of the Project

6
Cat Island, Bahamas Crooked Island, Bahamas Isla Verde, Puerto Rico, Nassau, Bahamas North Miami Beach, Florida Turks & Caicos Islands Puerto Plata, Dominican Republic Punta Cana, Dominican Republic ARCOS

7
Cat Island, Bahamas Clarence Town, Bahamas Cockburn Town, Bahamas Crooked Island, Bahamas Duncan Town, Bahamas Fresh Creek, Bahamas George Town, Bahamas Governors Harbor, Bahamas Hawksbill, Bahamas Matthew Town, Bahamas Mayaguana, Bahamas Nassau, Bahamas Port Nelson, Bahamas Port-au-Prince, Haiti Sandy Point, Bahamas BDNSi

8
BICS Boca Raton, Florida Spanish River, Florida Caves Point, Bahamas Current, Bahamas Hawksbill, Bahamas Sandy Point, Bahamas

9
America Movil (2012) Americas II (2006) South America I (2001) BICS (2001) ARCOS (2001) BDNSi (2006)
 Americas II (2006) South America I (2001) BICS (2001) ARCOS (2001) BDNSi (2006)")
10
Problem Statement Examine connectivity – Caribbean Islands to Florida – Inter-Island Connectivity Resiliency vs. threats – Natural disaster – Accidental disruptions – Terrorist attack – Additional Cables Measure of Effectiveness – Number of disconnected islands

11
Model Choices Nodes Edges Formulation ? – Shortest Path – Maximum Flow – Minimum Cost – Multi-commodity Flow

12
Multi-Commodity Flow Formulation Every node has both production & demand – Has its own commodity “place name” – Has demand for all other commodities “other places” Arcs are cables connecting islands – Two way flow – Cost = 1 unit per edge Multi-Commodity Combines – Producer-Consumer – Minimum Cost Flow

13
Assumptions If any physical connection is maintained – Insignificant delay – No monetary difference for users Satellite communications – not modeled Capacities – Traffic on arcs never exceeded Equal demand for all vs. population driven

14
Formulation

15
Scenario 1: Mainland Connectivity FLORIDA CockburnTownData: -1 CockburnTownData: 1 Turks&CaicosData: -1 PuertoPlataData: -1 PuntaCanaData: -1 Turks&CaicosData: 1 PuertoPlataData: 1 PuntaCanaData: 1 Etc… C=1, Y={0,1}

16
GAMS attack_arcs_set arc_set arcs_data arcs_commodity_data commodities nodes Nodes_data GAMS Implementation

17
Mainland Connectivity

18
Disconnected Islands Number of Attacks

19
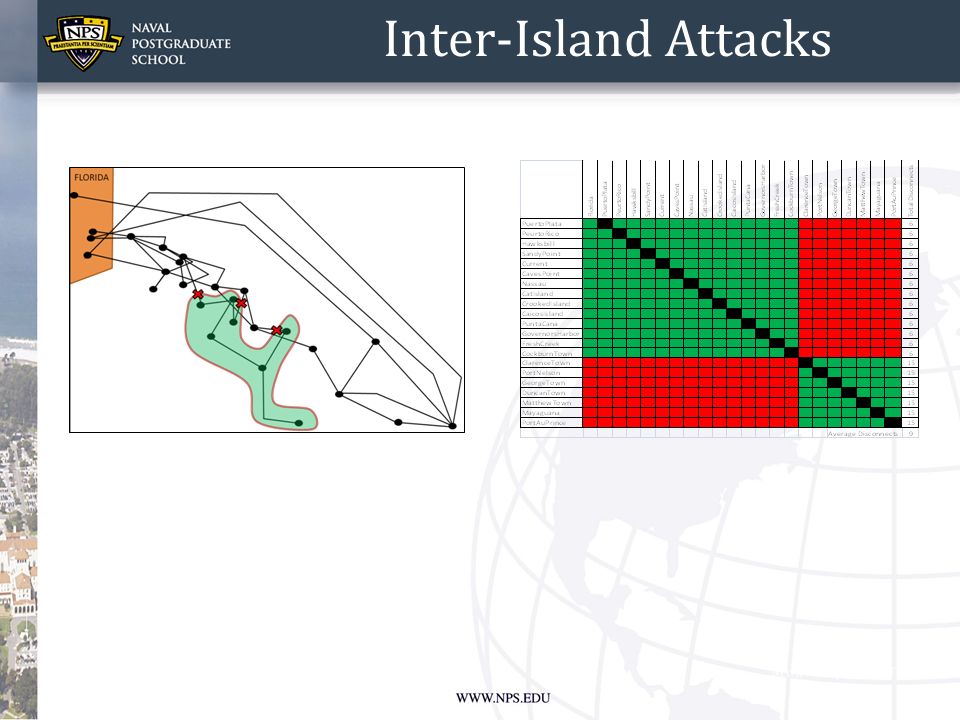
Scenario 2: Inter-Island Connectivity CockburnTownData: -21 CockburnTownData: 1 GeorgeTownData: 1 Etc… GeorgeTownData: -21 C=1, Y={0,1} GovernorsHarborData: -21 CockburnTownData: 1 GovernorsHarborData: 1 Etc… GeorgeTownData: 1 GovernorsHarborData: 1 Etc…

20
Inter-Island Attacks

22
Increasing Resiliency of Network Summary of interdiction analysis – Two nodes can be disconnected with single attacks – Mainland and Inter-Island interdiction is identical – Nested solutions Adding new cables – Majority of network is resilient to multiple attacks – Laying new cables is expensive – Focus on inexpensive fixes

23
New Lines - One Attack FLORIDA Placement of Additional Cables

24
Mainland Connectivity Interdicted Mainland Network Results with Added Cables

25
Revised Performance

26
Resiliency with Added Cables Disconnected Islands Number of Attacks

27
Inter-Island Connectivity Interdicted Inter-Island Network Results with Added Cables

28
Inter-Island (Added Cables)- One Attack OriginalAdded Cables
- One Attack OriginalAdded Cables")
29
OriginalAdded Cables Inter-Island (Added Cables)- Two Attacks
- Two Attacks")
30
OriginalAdded Cables Inter-Island (Added Cables)- Three Attacks
- Three Attacks")
31
Summary Multi-Commodity Flow Caribbean network is robust Recommend short additions to improve resiliency of isolated islands Future modeling – Other regions – Global model – Time & cost estimates for satellite connections

32
Questions?

Similar presentations


 –What is.>")


