Download presentation
Presentation is loading. Please wait.

1
Bioprocess Diagrams Including PFD and P&ID
THE MOST EFFECTIVE WAY OF COMMUNICATING INFORMATION ABOUT A PROCESS IS THROUGH THE USE OF FLOW DIAGRAMS

2
The Generic Block Flow Process Diagram
There are features common to all chemical processes. Figure below provides a generic Block Flow Process Diagram that shows a chemical process broken down into six basic areas or blocks.

3
The Generic Block Flow Process Diagram
Each of these blocks may contain several unit operations. For example, A separation section might contain (four distillation columns, two flash units, and a liquid-liquid decanter) Reactor Feed preparation and Separator Feed Preparation sections mainly involve changing the conditions (temperature and pressure) of the process streams to the conditions required by the reactor or separator.
 Reactor Feed preparation and Separator Feed Preparation sections mainly involve changing the conditions (temperature and pressure) of the process streams to the conditions required by the reactor or separator.")
4
Input/output diagram Generic diagram BFD PFD P&ID.
Flow Diagram Design is an evolutionary process: Input/output is a crude block flow diagram in which only feed and product streams are identified. Generic Diagram Break the process into its basic elements such as reaction and separation , and recycle sections. BFD include the material balance calculations. PFD complete mass and energy balance and preliminary equipment specs. P&ID includes the mechanical and instrumentation details. Input/output diagram Generic diagram BFD PFD P&ID.

5
Chemical Process Diagrams
3 Main Levels of Diagrams Block Flow Diagram (BFD) Process Flow Diagram (PFD) Piping and Instrumentation Diagram (P&ID) – often referred to as Mechanical Flow Diagram Chemical Process Diagrams
 Process Flow Diagram (PFD) Piping and Instrumentation Diagram (P&ID) – often referred to as Mechanical Flow Diagram. Chemical Process Diagrams.")
6
Comparison Level of Conceptual BFD Understanding Increases
Level of Complexity Increases PFD P&ID

7
The Block Flow Diagram (BFD)
Shows overall processing picture of a chemical complex Useful as an orientation tool Used to sketch out and screen potential process alternatives.

8
Definitions of BFD Block Flow Process Diagram (BFPD)
BFPD forms the starting point for developing PFD BFPD is helpful in conceptualizing new processes Block Flow Plant Diagram Gives a general view of a large complex plant

9
The Block Flow Process Diagram

10
The Block Flow Plant Diagram

11
Block Flow Diagrams Conventions and Formats for BFD
Operations shown by blocks Major flow lines shown with arrows Flow goes from left to right whenever possible Light streams toward top with heavy stream toward bottom Critical information unique to process supplied If lines cross, then horizontal line is continuous Simplified material balance provided

12
The Process Flow Diagrams (PFD)
A PFD contains the bulk of the Chem Eng data necessary for the design of a chemical process. Basic information provided by a PFD: Process Topology Stream Information Equipment Information

13
The Process Flow Diagrams (PFD)
A typical commercial PFD will contain the following information: All major pieces of equipments in the process will be represented along with a descriptive name and number. All process flow streams will be shown and identified with a number. A description of the process conditions and chemical composition of each stream will be included. All utility streams supplied to major equipment that provides a process function will be shown. Basic control loops will be shown.

14
The Process Flow Diagram (cont’d)
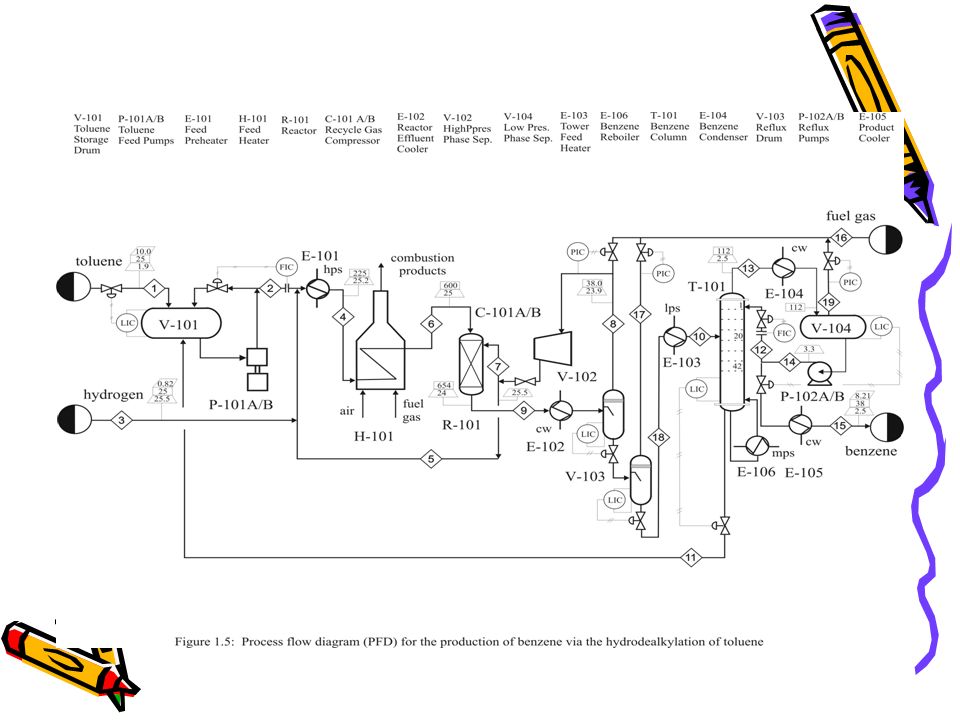
The topology of the process – showing the connectivity of all the streams and the equipment Example for toluene HDA Tables 1.2 lists information that should be on the PFD but cannot fit -Use appropriate conventions – consistency is important in communication of process information . e.g Table 1.2

15
The Process Flow Diagram (cont’d)
")
16
Symbols for Drawing PFD

17
The Process Flow Diagram (cont’d)
Table 1.2 : Conventions Used for Identifying Process Equipment Process Equipment General Format XX-YZZ A/B XX are the identification letters for the equipment classification C - Compressor or Turbine E - Heat Exchanger H - Fired Heater P - Pump R - Reactor T - Tower TK - Storage Tank V - Vessel Y designates an area within the plant ZZ are the number designation for each item in an equipment class A/B identifies parallel units or backup units not shown on a PFD Supplemental Information Additional description of equipment given on top of PFD

18
Equipment Numbering XX-YZZ A/B/…
XX represents a 1- or 2-letter designation for the equipment (P = pump) Y is the 1 or 2 digit unit number (1-99) ZZ designates the equipment number for the unit (1-99) A/B/… represents the presence of spare equipment
 Y is the 1 or 2 digit unit number (1-99) ZZ designates the equipment number for the unit (1-99) A/B/… represents the presence of spare equipment.")
19
The Process Flow Diagram (cont’d)
")
20
Equipment Numbering (cont’d)
Thus, T-905 is the 5th tower in unit nine hundred, P-301 A/B is the 1st Pump in unit three hundred plus a spare XX-YZZ A/B/… Use unambiguous letters for new equipment Example: Turbine use Tb or J not T (for tower) Replace old vessel V-302 with a new one of different design - use V-319 (say) not V-302 – since it may be confused with original V-302 the presence of spare equipment
 Replace old vessel V-302 with a new one of different design - use V-319 (say) not V-302 – since it may be confused with original V-302 the presence of spare equipment.")
22
Stream Numbering and Drawing
Number streams from left to right as much as possible Horizontal lines are dominant

24
Stream Numbering and Drawing (cont’d)
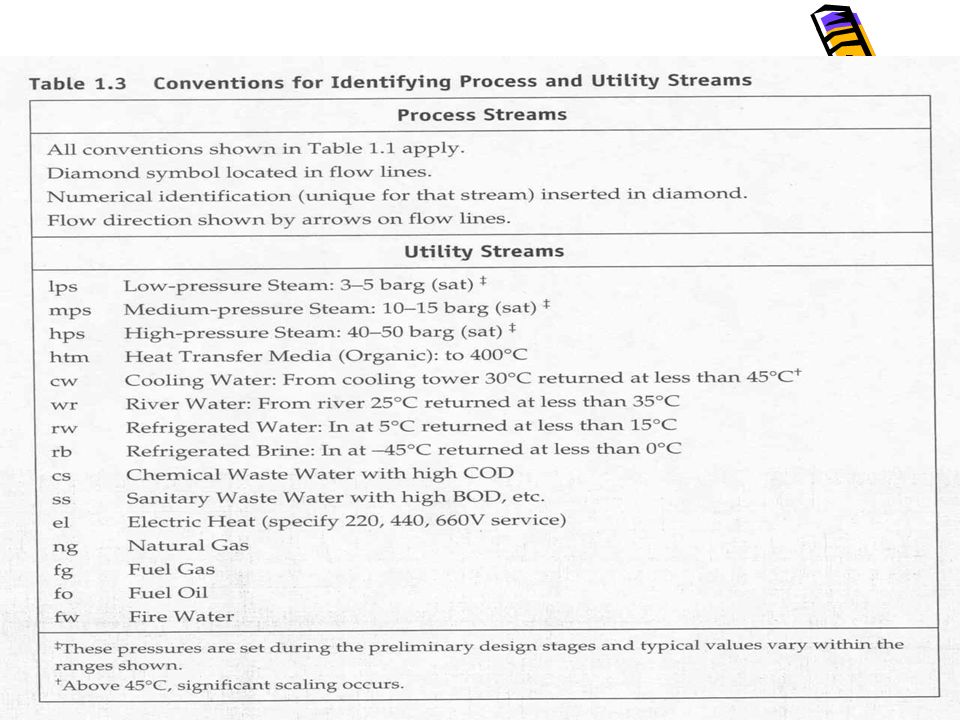
Add arrows for Change in direction Inlet of equipment Utility streams should use convention given in Table 1.3 (lps, cw, fg, etc)
")
25
Stream Information Since diagrams are small not much stream information can be included Include important data – around reactors and towers, etc. Flags are used – see toluene HDA diagram Full stream data, as indicated in Table 1.4, are included in a separate flow summary table – see Table 1.5

27
Stream Information - Flags

28
Stream Information Table 1.4: Information in a Flow Summary
Essential Information Stream Number Temperature (°C) Pressure (bar) Vapor Fraction Total Mass Flow Rate (kg/h) Total Mole Flow Rate (kmol/h) Individual Component Flow Rates (kmol/h) Optional Information Component Mole Fractions Component Mass Fractions Individual Component Flow Rates (kg/h) Volumetric Flow Rates (m3/h) Significant Physical Properties Density Viscosity Other Thermodynamic Data Heat Capacity Stream Enthalpy K-values, Stream Name
 Pressure (bar) Vapor Fraction. Total Mass Flow Rate (kg/h) Total Mole Flow Rate (kmol/h) Individual Component Flow Rates (kmol/h) Optional Information. Component Mole Fractions. Component Mass Fractions. Individual Component Flow Rates (kg/h) Volumetric Flow Rates (m3/h) Significant Physical Properties. Density. Viscosity. Other. Thermodynamic Data. Heat Capacity. Stream Enthalpy. K-values, Stream Name.")
29
The Process Flow Diagram (cont’d)
The Process Flow Diagram (cont’d) A Portion of Table 1.5 Stream Number 1 2 3 4 5 6 7 8 9 10 Temperature (°C) 25 59 225 41 600 38 654 90 Pressure (bar) 1.90 25.8 25.5 25.2 25.0 23.9 24.0 2.6 Vapor Fraction 0.0 1.00 1.0 Mass Flow (tonne/h) 10.0 13.3 0.82 20.5 6.41 0.36 9.2 20.9 11.6 Mole Flow (kmol/h) 108.7 144.2 301.0 1204.4 758.8 42.6 1100.8 1247.0 142.2 Component Mole Flow (kmol/h) Hydrogen 286.0 735.4 449.4 651.9 652.6 0.02 Methane 15.0 317.3 302.2 16.95 438.3 442.3 0.88 Benzene 7.6 6.6 0.37 9.55 116.0 106.3 Toluene 143.2 144.0 0.7 0.04 1.05 36.0 35.0
 A Portion of Table 1.5. Stream Number Temperature (°C) Pressure (bar) Vapor Fraction Mass Flow (tonne/h) Mole Flow (kmol/h) Component Mole Flow (kmol/h) Hydrogen Methane Benzene Toluene")
30
Equipment Information
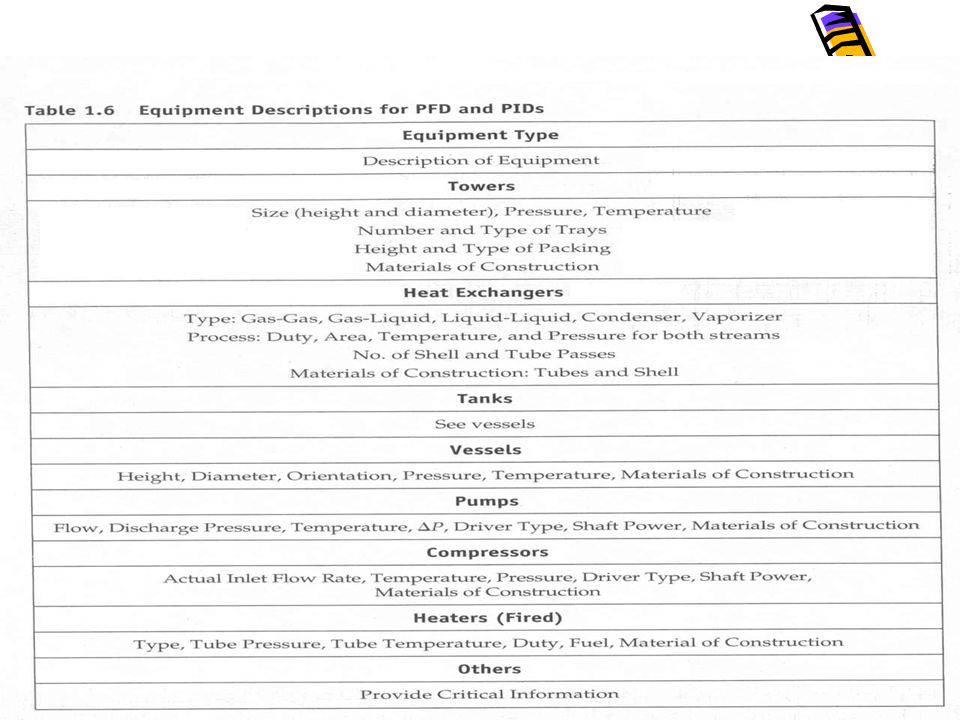
Equipment are identified by number and a label (name) positioned above the equipment on the PFD Basic data such as size and key data are included in a separate table (Equipment Summary Table) Table 1.7 (and Table 1.6) in TBWS
 positioned above the equipment on the PFD. Basic data such as size and key data are included in a separate table (Equipment Summary Table) Table 1.7 (and Table 1.6) in TBWS.")
31
Equipment Information
A Section of Table 1.7: Equipment Summary Vessel V-101 V-102 Temperature (ºC) 55 38 Pressure (bar) 2.0 24 Orientation Horizontal Vertical MOC CS Size Height/Length (m) 5.9 3.5 Diameter (m) 1.9 1.1 Internals s.p. (splash plate)
 Pressure (bar) Orientation. Horizontal. Vertical. MOC. CS. Size. Height/Length (m) Diameter (m) Internals. s.p. (splash plate)")
33
PFD Summary PFD, Equipment Summary Table, and Flow Summary Table represent a “true” PFD This information is sufficient for a preliminary estimation of capital investment (Chapter 5) and cost of manufacture (Chapter 6) to be made
 and cost of manufacture (Chapter 6) to be made.")
34
The Piping and Instrument Diagram (P&ID)
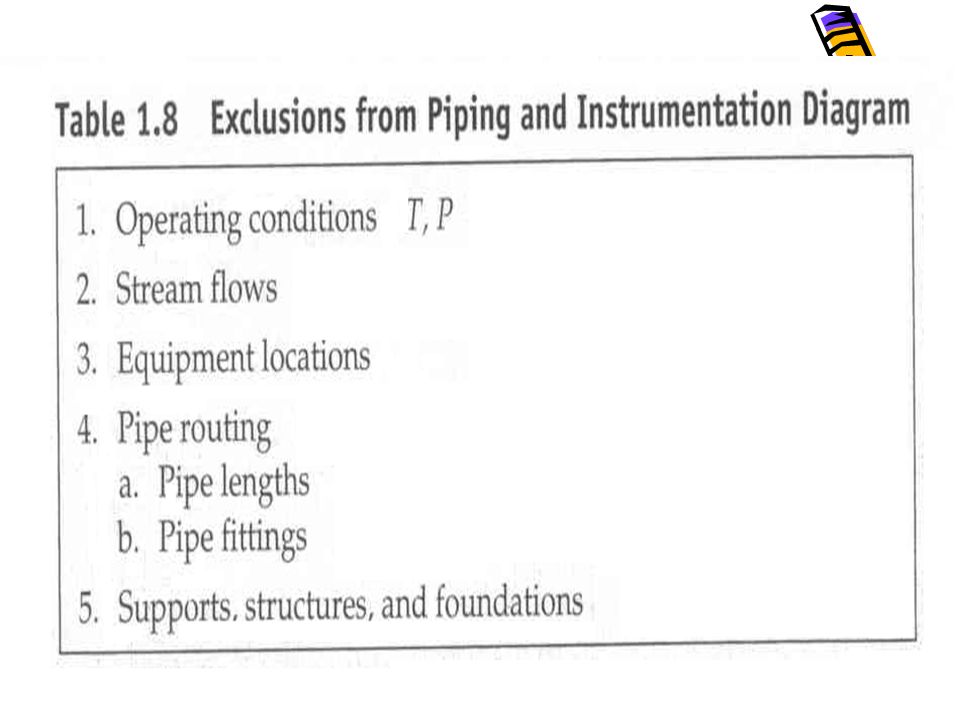
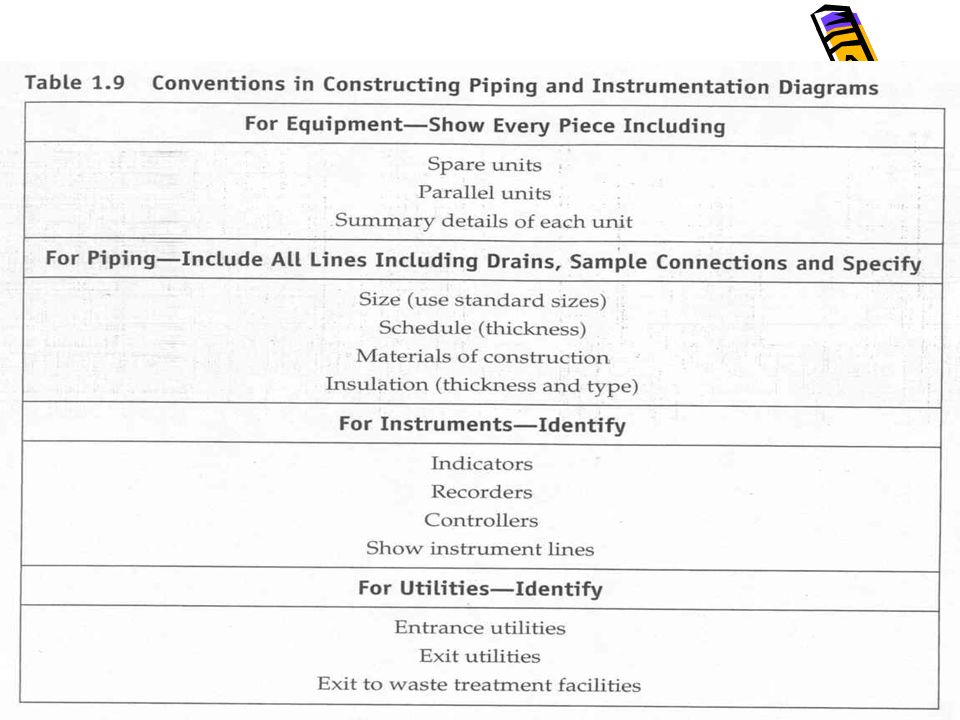
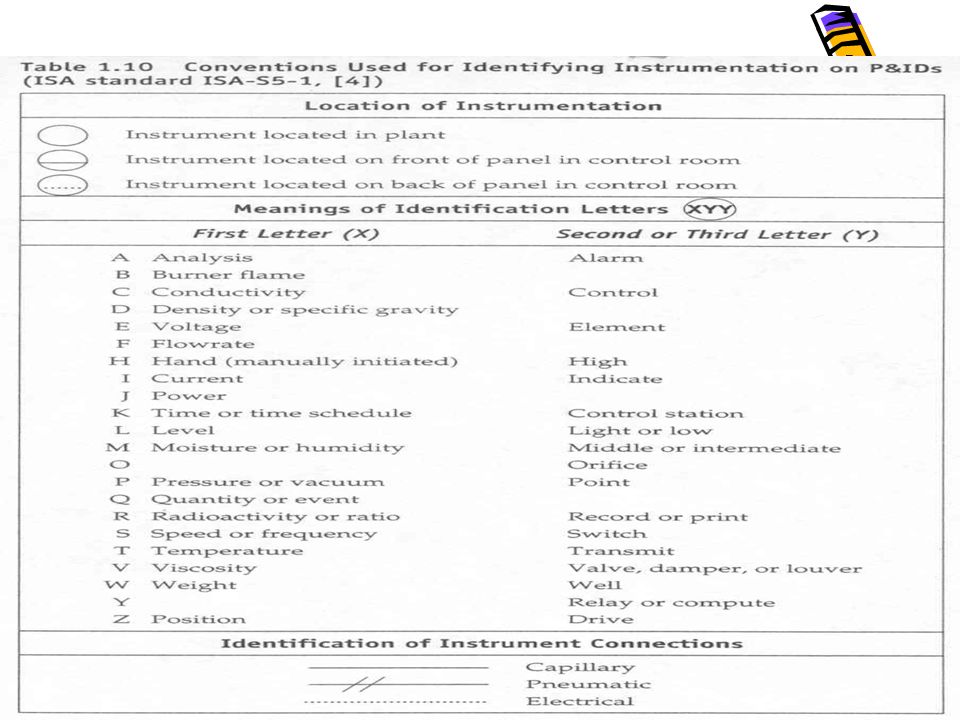
P&ID – Construction Manual Contains: plant construction information (piping, process, instrumentation, and other diagrams) P&ID construction convection is explained in Table1.9 Conventions for instrumentation are shown in Table 1.10.
 P&ID construction convection is explained in Table1.9. Conventions for instrumentation are shown in Table")
35
P&ID

39
Look at V-102 on P&ID V-102 contains an LE (Level Element)
LE senses liquid level in separator and adjusts flow rate leaving LE opens and closes a valve depending on liquid level LE and valve represent a feedback control loop The final control element in nearly all chemical process control loops is a valve

40
P&ID Based on the P&ID diagram:
Mech and Civil Engrs will design and install pieces of equipment. Instrument Engrs will specify, install and check control systems. Piping Engrs will develop plant layout and elevation drawings. Project Engrs will develop plant and construction schedules.

41
DO NOT POSSESS ADDITIONAL PROCESS
Additional Diagrams UTILITY FLOWSHEET VESSEL SKETCHES WIRING DIAGRAMS SITE PLANS PLOT PLANS ELEVATION DIAGRAMS DO NOT POSSESS ADDITIONAL PROCESS INORMATION

42
Additional Diagrams Plot Plans – plan or map drawn looking down on plant (drawn to scale with all major equipment identified) Elevation Diagrams – show view from side and give information about equipments distance from ground

43
Section of Elevation Diagram
Additional Diagrams Section of Plot Plan Section of Elevation Diagram

44
Additional Diagrams (cont’d)
Piping Isometrics – show piping in 3-dimensions Vessel Sketches – show key dimensions of equipment and locations of inlet and outlet nozzles etc.

45
Scale Models and Virtual Plants
25 years ago physical models were used for review Now virtual or electronic models are generated using software (3-d plant diagrams) Purpose of Models – catch errors such as Piping clashes Misaligned piping Equipment not easily accessed Sample points not easily reached by operators
 Purpose of Models – catch errors such as. Piping clashes. Misaligned piping. Equipment not easily accessed. Sample points not easily reached by operators.")
46
3-D Plant Diagrams

Similar presentations


 Prof. Dr. Hasan farag.>")


