Download presentation
Presentation is loading. Please wait.

1
Intro to Remote Sensing Lecture 1 August 25, 2004

2
What is remote sensing? Take a photo

3
What is remote sensing Remote Sensing: remote sensing is science of acquiring, processing, and interpreting images and related data that are obtained from ground-based, air-or space- borne instruments that record the interaction between matter (target) and electromagnetic radiation. Remote Sensing: using electromagnetic spectrum to image the land, ocean, and atmosphere. In this class, we will mostly focus on the the principles and techniques for data collection and the interaction of electromagnetic energy with the Earth's surface (2/3 of the time) some application examples (1/3 of the time)
 some application examples (1/3 of the time).")
4
Electromagnetic Spectrum Source: http://oea.larc.nasa.gov/PAIS/DIAL.html

5
Remote sensing platforms

6
Ground and Aircraft Based Ground repeat or continuous sampling regional or local coverage example: NEXRAD for precipitation Aircraft repeat sampling, any sampling interval regional or local coverage examples: AVIRIS for minerals exploration LIDAR for ozone and aerosols

7
Space Based Sun-synchronous polar orbits global coverage, fixed crossing, repeat sampling typical altitude 500-1,500 km example: MODIS, Landsat Low-inclination, non-Sun-synchronous orbits tropics and mid-latitudes coverage, varying sampling typical altitude 200-2,000 km example: TRMM Geostationary orbits regional coverage, continuous sampling over equator only, altitude 35,000 km example: GOES

8
Types of remote sensing Passive: source of energy is either the Sun or Earth/atmosphere Sun - wavelengths: 0.4-5 µm Earth or its atmosphere - wavelengths: 3 µm - 30 cm Active: source of energy is part of the remote sensor system Radar - wavelengths: mm-m Lidar - wavelengths: UV, Visible, and near infrared

9
LANDSAT MSS/TM/ETM+ (NASA, USA) SPOT-1, -2, -3 (France) JERS-1 (optical sensor) (Japan) MODIS (NASA, USA) CMODIS (China) AVHRR (NOAA, USA) ASTER (NASA, USA, and Japan) IRS-1A, -1B, -1C, 1D (India) IKONOS (Space Imaging, USA) Major Passive: Multi-Spectral Sensors Multi-Spectral Sensors Hyper-Spectral Sensor AVIRIS (NASA, USA) HyMap (Australia)
 SPOT-1, -2, -3 (France) JERS-1 (optical sensor) (Japan) MODIS (NASA, USA) CMODIS (China) AVHRR (NOAA, USA) ASTER (NASA, USA, and Japan) IRS-1A, -1B, -1C, 1D (India) IKONOS (Space Imaging, USA) Major Passive: Multi-Spectral Sensors Multi-Spectral Sensors Hyper-Spectral Sensor AVIRIS (NASA, USA) HyMap (Australia)")
10
SIR-A, -B, -C (NASA, USA) RADARSAT (Canada) JERS-1 (radar sensor) (Japan) ERS-1 (European) AIRSAR/TOPSAR (NASA, USA) NEXRAD (NOAA, USA) TRMM (NASA, USA) Major Active: Radar Sensor Radar Sensor Lidar Sensor ALTMS (TerraPoint, USA) FLI-MAP (John Chance, USA) ALTM (USA) TopoEye (USA) ATLAS (USA)
 RADARSAT (Canada) JERS-1 (radar sensor) (Japan) ERS-1 (European) AIRSAR/TOPSAR (NASA, USA) NEXRAD (NOAA, USA) TRMM (NASA, USA) Major Active: Radar Sensor Radar Sensor Lidar Sensor ALTMS (TerraPoint, USA) FLI-MAP (John Chance, USA) ALTM (USA) TopoEye (USA) ATLAS (USA)")
11
Measurement scales constrained by physics and technology Spatial resolution (IFOV/GSD) and coverage (field-of- view) Optical diffraction sets minimum aperture size Spectral resolution ( ) and coverage ( min to max ) Narrow bands need bigger aperture, more detectors, longer integration time Radiometric resolution (S/N, NE , NE T ) and coverage (dynamic range) Aperture size, detector size, number of detectors, and integration time Temporal resolution (revisit) and coverage (repeat) Pointing agility, period for full coverage
 and coverage (field-of- view) Optical diffraction sets minimum aperture size Spectral resolution ( ) and coverage ( min to max ) Narrow bands need bigger aperture, more detectors, longer integration time Radiometric resolution (S/N, NE , NE T ) and coverage (dynamic range) Aperture size, detector size, number of detectors, and integration time Temporal resolution (revisit) and coverage (repeat) Pointing agility, period for full coverage")
12
Spatial Resolution Jensen, 2000

13
163 NEXRADs in the USA First deployed in 1988 Spectrum covrage Microwave (10cm) Spatial Resolution (km) 1, 2, 4 Spatial coverage (km) Radius of 230km Temporal Resolution 6-10 minutes
 Spatial Resolution (km) 1, 2, 4 Spatial coverage (km) Radius of 230km Temporal Resolution 6-10 minutes")
14
NEXRAD coverage of the San Antonio area NEXRAD has very good coverage (maximum 230 km in radius) in the SA area Click here: http://weather.noaa.gov/radar/national.html for real time precipitation
 in the SA area Click here: for real time precipitation")
15
NASA Landsat-7 (ETM+) launched 4/15/1999 Spectrum coverage (8 bands) Visible Near Infrared Thermal Infrared Spectrum resolution 50-200 nm Spatial resolution (m) 15, 30, 60 Swath (km) 185 Temporal resolution 16 days Radiometric resolution 8 bits 705 km
 launched 4/15/1999 Spectrum coverage (8 bands) Visible Near Infrared Thermal Infrared Spectrum resolution nm Spatial resolution (m) 15, 30, 60 Swath (km) 185 Temporal resolution 16 days Radiometric resolution 8 bits 705 km")
16
Terra satellite launched on 12/18/1999 http://terra.nasa.gov/About/MODIS/modis_swath.html Spectrum coverage (36 bands) Visible Near Infrared Thermal Infrared Spectral resolution 10-500 nm Spatial resolution (m) 250, 500, 1000 Swath (km) 2400 Radiometric resolution 12 bits 705 km
 Visible Near Infrared Thermal Infrared Spectral resolution nm Spatial resolution (m) 250, 500, 1000 Swath (km) 2400 Radiometric resolution 12 bits 705 km")
17
IKONOS launched on 9/24/1999 Spectrum coverage (4 +1 bands) Visible Near Infrared Panchromatic Spectral resolution 65-95 nm, 403 nm Spatial resolution (m) 4 and 1 Swath (km) 11 Radiometric resolution 11 bits http://www.spaceimaging.com/
 Visible Near Infrared Panchromatic Spectral resolution nm, 403 nm Spatial resolution (m) 4 and 1 Swath (km) 11 Radiometric resolution 11 bits")
18
Source: http://www.ceosr.gmu.edu/CSI759S01/speaker/04.Dr.Chiu/CSI_759_Summer_2001_04Chiu/sld045.htm first satellite rain radar to measure the 3-D of precipitation over the tropics between 35º latitude, since 1997 Wavelength 2.2 cm (13.8 GHz), 4 km resolution and swath of 220 km Temporal: daily
, 4 km resolution and swath of 220 km Temporal: daily")
19
Global Geostationary Environmental Satellites Europe and Africa N. & S. American Eastern Pacific Jap. Aus. W. Paci C. Asia, India OceanChina, India Ocean Earth radius 6,370 km Satellite altitude 35,800 km 3.9 and 10.7 µm 4 km, continuous?

21
The size of a cell we call image resolution, depending on… Such as 1 m, 30 m, 1 km, or 4 km

22
History of Remote Sensing Aerial photography is the original form of remote sensing (using visible spectrum) started in 1909 Aerial photographic reconnaissance was widely used after 1915 in WWI. Photogrammetric Engineering, the official monthly publication of the American Society of Photogrammetry, was first published in 1934. Color infrared photography began 1931, then was widely used in agriculture and forestry. Development of radar (1930-1940). During WWII, non-visible spectrum (infrared and radar) were used as tools in remote sensing. After the first man-made satellite (Sputnik 1) was launched on 4 October 1957, remote sensing moved to outer space. The United States' Explorer 6 transmitted the first space photograph of the Earth in August 1959. The first systematic meteorological satellite observation came with the launch of the United States' TIROS 1 in 1960. Landsat 1 (originally called the Earth Resources Technology Satellite or ERTS) was the first satellite to collect data on the Earth's natural resources. It was launched on 23 July 1972. Hyperspectral remote sensing emerged (1980s), widely used in mineral, oil, etc. exploration. Since then, a large number and advanced types of remote sensing systems have been developed.
. During WWII, non-visible spectrum (infrared and radar) were used as tools in remote sensing. After the first man-made satellite (Sputnik 1) was launched on 4 October 1957, remote sensing moved to outer space. The United States Explorer 6 transmitted the first space photograph of the Earth in August The first systematic meteorological satellite observation came with the launch of the United States TIROS 1 in Landsat 1 (originally called the Earth Resources Technology Satellite or ERTS) was the first satellite to collect data on the Earth s natural resources. It was launched on 23 July Hyperspectral remote sensing emerged (1980s), widely used in mineral, oil, etc. exploration. Since then, a large number and advanced types of remote sensing systems have been developed..")
23
Remote Sensing Applications Land: rocks, minerals, faults, land use and land cover, vegetation, DEM, snow and ice, urban growth, environmental studies, … Ocean: ocean color, sea surface temperature, ocean winds, … Atmosphere: temperature, precipitation, clouds, ozone, aerosols, …

24
Applications driving remote sensing Various application demands as driving forces for the resolution improvemen ts of remote sensing Jensen, 2000

25
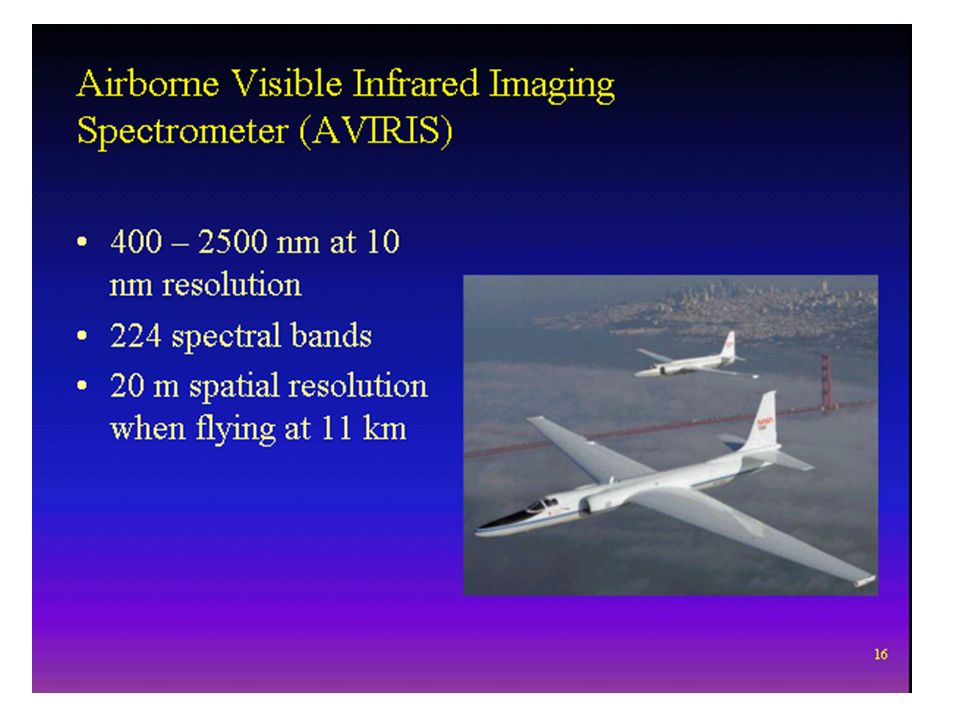
Trend and Future of Remote Sensing (1) High spatial resolution - IKONOS launched in 1999 by Space Imaging (4 m multi-spectral and 1 m panchromatic) - QuickBird launched in 2001 by DIGITALGLOBE (2.44 m multi-spectral and 61 cm panchromatic) High spectral resolution - AVIRIS, 10nm and 20 m, 224 bands - Hyperion launched in 2000, 10nm and 30m, 220 bands High radiometric resolution - 8 bits to 12 bits High temporal resolution - GOES 15-30 minutes - NEXRAD 6 or 10 minutes
 High spatial resolution - IKONOS launched in 1999 by Space Imaging (4 m multi-spectral and 1 m panchromatic) - QuickBird launched in 2001 by DIGITALGLOBE (2.44 m multi-spectral and 61 cm panchromatic) High spectral resolution - AVIRIS, 10nm and 20 m, 224 bands - Hyperion launched in 2000, 10nm and 30m, 220 bands High radiometric resolution - 8 bits to 12 bits High temporal resolution - GOES minutes - NEXRAD 6 or 10 minutes")
26
Trend and Future of Remote Sensing (2) Globe coverage, high repeatability (or improved temporal resolution) - AVHRR, 1100m, morning or afternoon - MODIS, 250-1000m, morning or afternoon - NPOESS (will be launched in 2009), 370-740m, 4 hours Real-time or near real-time availability - MODIS available online in the second day ? - NEXRAD available online in 6 minutes - NPOESS available online in 15 minutes Cost free or affordable - Most of the federal collected images are free available or lower cost, while commercial high resolution images are affordable. Integrated remote sensing and GIS - Remote sensing applications with the support of GIS - Remote sensing data as a major GIS data source

27
Major image processing software ENVI/IDL: http://www.rsinc.com/http://www.rsinc.com/ ERDAS Imagine: http://www.gis.leica- geosystems.com/Products/Imagine/http://www.gis.leica- geosystems.com/Products/Imagine/ PCI Geomatics: http://www.pci.on.ca/http://www.pci.on.ca/ ER Mapper: http://www.ermapper.com/http://www.ermapper.com/ INTEGRAPH: http://imgs.intergraph.com/gimage/http://imgs.intergraph.com/gimage/ IDRIS: Ecognition: http://www.definiens- imaging.com/ecognition/pro/40.htmhttp://www.definiens- imaging.com/ecognition/pro/40.htm See5 and decision tree

28
Coarse to moderate spatial resolution data (8km-250m), e.g., NOAA- AVHRR, SPOTVegetation, Terra and Aqua MODIS, Envisat-MERIS, SeaWiFS. These data will provide daily observations and temporally composited products High spatial resolution data (c. 30m), e.g., SPOT, Landsat-ETM, ASTER, Meteor-3M, EO-1, and IRS high-resolution. Very high spatial resolution data (<1-4 m), e.g., IKONOS, Quick-Bird. These commercial products will be subject to copyright restrictions. Multi-view angle optical data, e.g., from Terra-MISR Moderate to high spatial resolution (500m-15m) Synthetic Aperture Radar data and products, e.g. Envisat-ASAR, ERS-1+2, JERS, Radarsat, SIR-C, SRTM Very coarse spatial resolution (25km) microwave radiometer data, e.g., Aqua-AMSR-E, DMSP-SSM/I, DMSP-SMMR
, e.g., SPOT, Landsat-ETM, ASTER, Meteor-3M, EO-1, and IRS high-resolution. Very high spatial resolution data (<1-4 m), e.g., IKONOS, Quick-Bird. These commercial products will be subject to copyright restrictions. Multi-view angle optical data, e.g., from Terra-MISR Moderate to high spatial resolution (500m-15m) Synthetic Aperture Radar data and products, e.g. Envisat-ASAR, ERS-1+2, JERS, Radarsat, SIR-C, SRTM Very coarse spatial resolution (25km) microwave radiometer data, e.g., Aqua-AMSR-E, DMSP-SSM/I, DMSP-SMMR.")
Similar presentations


, infrared (BW, Color) –RADAR (SLAR, SAR) –LIDAR (light detection and ranging)>")


-Polar Orbiting Environmental Satellite (POES) Orbital characteristics.>")


