Download presentation
Presentation is loading. Please wait.

1
FEBRUARY 2012 How establishing a rigorous evaluation process can help schools differentiate teacher performance and drive key human capital decisions. Teacher Evaluation California Charter Schools Association Conference

2
© TNTP 2012 Agenda Welcome and Introductions Introduction to The School Leader’s Toolbox Instructional Culture Insight Teacher Evaluation Question & Answer 2

3
© TNTP 2012 Agenda Welcome and Introductions Introduction to The School Leader’s Toolbox Instructional Culture Insight Teacher Evaluation Question & Answer 3

4
© TNTP 2012 With the support of the Walton Foundation, TNTP partnered with charter organizations across the country, including the CCSA, as well as traditional districts and states to develop training content on effective human capital policies. The goal was to develop a series of trainings on successful human capital management practices in charter schools, covering the following topics: (1)Recruitment and Selection; (2)Teacher Evaluation; (3)Retention of High Performers; (4)Performance Accountability; (5)Building a Professional School Culture; and (6)Teacher Development.
Recruitment and Selection; (2)Teacher Evaluation; (3)Retention of High Performers; (4)Performance Accountability; (5)Building a Professional School Culture; and (6)Teacher Development. .")
5
© TNTP 2012 TNTP worked with the California Charter Schools Association and other partners to identify exemplar schools, networks, and districts. Surveyed nearly a thousand charter school teachers and administrators in order to gain a deeper understanding of educators’ perceptions of human capital management practices in their schools and networks. Collected rubrics, frameworks, policies, process descriptions, and other tools used by exemplar states, districts, networks, and charter schools to manage their teacher workforces for high achievement. Interviewed state, district, network and school leaders, teachers and staff to explore how human capital management policies and practices affect teacher satisfaction and retention.

6
© TNTP 2012 We found that a comprehensive approach to human capital management drives greater teacher satisfaction. Key Teacher Survey Questions RECRUITMENT “The recruitment process effectively prepared me for what to expect in my role at my school.” EVALUATION AND DEVELOPMENT “The professional development I receive at my school is tailored according to feedback and/or development areas from my performance evaluation.” RECOGNITION “Teachers’ accomplishments are regularly recognized and celebrated.” PERFORMANCE ACCOUNTABILITY “Teachers are held accountable for their performance.” SCHOOL CULTURE “I feel appreciated for my hard work at my school.” *Includes “Strongly Agree” or “Agree.” **Percent “Satisfied” or “Very Satisfied.” Percent of teachers satisfied with their current school** Number of questions with which teacher agreed*

7
© TNTP 2012 The School Leader’s Toolbox is an online repository of successful strategies and practical resources that charter schools can draw on to create effective human capital policies, with the aim of creating sustained, scalable models for effective instruction. Recruitment & Selection Evaluation Retaining High Performers Performance Accountability Teacher Development Building a Professional Culture A high- performing teaching team The School Leader’s Toolbox School-tested strategies for growing great teaching teams

8
© TNTP 2012 8 Research has shown that effective teachers are critically important to student learning. Dallas students who start 2 nd grade at about the same level of math achievement… After 3 HIGHLY EFFECTIVE Teachers After 3 INEFFECTIVE Teachers …may finish 5 th grade math at dramatically different levels depending on the quality of their teachers. Note: Calculating the effects of 3 teachers requires 4 years of test data; hence starting with scores in 2 nd grade and ending in 5 th. Source: Jordan, H., Mendro, R., & Weerasinghe, D. (1997). T he Effects of Teachers on Longitudinal Student Achievement. Dallas, TX: Dallas Public Schools 49
. T he Effects of Teachers on Longitudinal Student Achievement. Dallas, TX: Dallas Public Schools 49.")
9
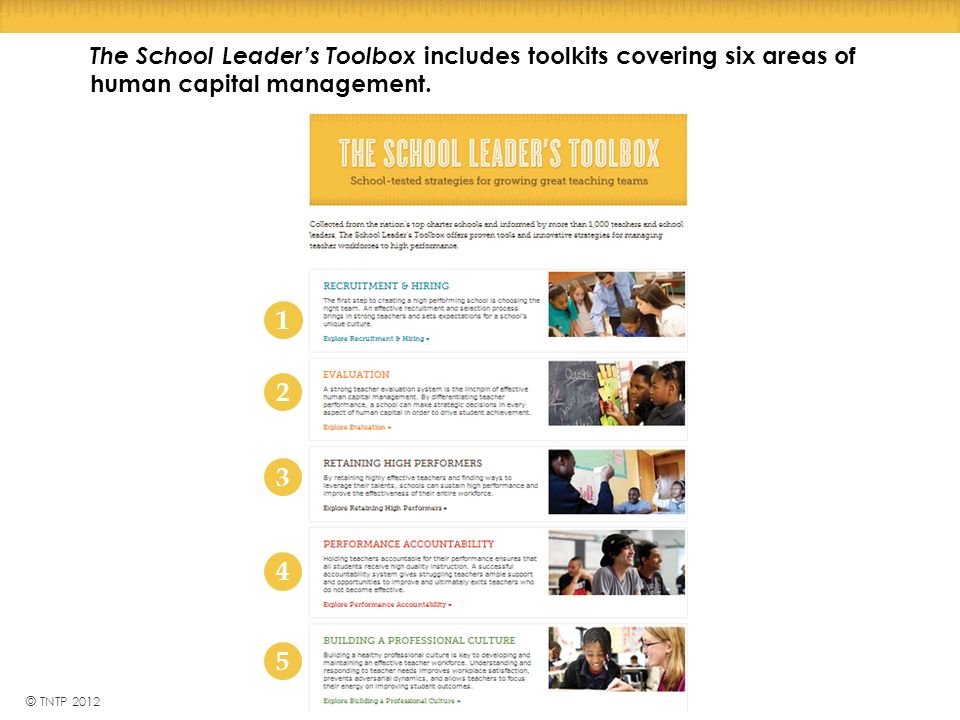
© TNTP 2012 The School Leader’s Toolbox includes toolkits covering six areas of human capital management. 5 4 3 2 1
10
© TNTP 2012 10 Teacher Effectiveness in Improving Student Achievement Boost effectiveness of all teachers through effective evaluation and targeted professional development. Improve or exit persistently less effective teachers and replace with more effective teachers. Retain and leverage most effective teachers. 5 2 4 1 Optimize new teacher supply by hiring from preparation programs whose teachers consistently achieve better student outcomes. Prioritize effective teachers for high-need students. 3 Current teacher performance Potential teacher performance Dramatic improvements in student achievement cannot occur without a sustained and strategic focus on maximizing teacher effectiveness. 5 Strategies for Optimizing Teacher Effectiveness

11
© TNTP 2012 Each toolkit includes guidance on promising practices and ready- to-use tools from leading charter schools, districts and states. Each toolkit in The School Leader’s Toolbox contains: A slide presentation with guidance and insights from exemplar school leaders A library of tools and resources contributed by exemplar networks, districts and states Users can review, download, and adapt the guidance and tools for their contexts

12
© TNTP 2012 Example: Recruitment & Selection

13
© TNTP 2012 Hyperlinks under each slide link to specific examples from exemplar schools.

14
© TNTP 2012 Users are encouraged to adapt the resources in The School Leader’s Toolbox to meet their unique needs. Scaling UpStrategic Improvements New School Design Situation → A design team wants state-of-the art human capital policies but doesn't know where to go for design principles and tools. Solution → Review all six toolkits to understand a range of options. Download resources as a starting point in developing design principles and customized tools for the school. Situation → A school leader of an established school has been making decisions about hiring, pay, and retention on a case-by-case basis, but as the school grows, needs a more coherent, strategic set of policies. Solution → Review the toolkit contents to identify and download examples and tools that align with the school’s established vision and approach. Situation → A network operator is satisfied with policies on evaluation, hiring, and retention, but has a standard “steps and lanes” salary schedule and wants to begin to move to a system more aligned with teacher effectiveness. Solution → Focus on contents of one toolkit, Retention of High Performers, to see what leading charter networks are doing in this area.

15
© TNTP 2012 New Features for 2012 District content Additional charter partners Search and navigation functionality Teacher Development Toolkit 15 Any questions about -the purpose of The School Leader’s Toolbox, -navigating the website, -or the origination of the content?

16
© TNTP 2012 Agenda Welcome and Introductions Introduction to The School Leader’s Toolbox Instructional Culture Insight Teacher Evaluation Question & Answer 16

17
© TNTP 2012 Instructional Culture Insight is a teacher-centered survey tool, which is used to create stronger school cultures. What is Insight? 46-question survey, given to teachers twice per year Gathers timely information on school leadership and instructional environment School and district/CMO leaders use the information to build a strong workplace culture that supports teachers Where is Insight? Piloted in 37 Washington, DC charter schools in May 2010 Expanded to 249 schools across 6 states in 2011 90 more schools added so far in 2012 Why does culture matter? Schools with strong cultures are far more likely to retain their best teachers The strength of school’s culture is a valid leading indicator of student results on state tests

18
© TNTP 2012 Most surveys just lay out the landscape; Insight provides a clear path to improving school culture and assesses change over time. 15-minute survey, teachers give feedback on 40+ aspects of school culture 1. Survey teachers Answers from three key questions generate a single Index score, a barometer of school cultural health 2. Generate Index score All principals receive school reports, with guidance on where to focus efforts 3. Schools get reports Index Score Schools take concrete steps to improve their culture 4. Schools improve culture Insight Survey 1-10 School Report Give schools a roadmap Assess progress

19
© TNTP 2012 Three survey items combine to create the Instructional Culture Index, a single measure of the strength of a school’s culture. From the survey, we built a valid statistical composite of teacher agreement with three indicators that is predictive of student outcomes. Teachers at my school share a common vision of what effective teaching looks like. At my school, the expectations for effective teaching are clearly defined. My school is committed to improving my instructional practice. Instructional Culture Index A single measure of instructional culture that predicts teacher retention and student gains.

20
© TNTP 2012 The other Insight questions allow schools to make targeted changes to management behaviors that shape overall instructional culture. Instructional Culture DomainsRelated Survey Items Hiring Process Professional Development Coaching and Collaboration Student Growth Measures Observation and Feedback Evaluation Peer Effectiveness Learning Environment Career Ladder Workload Teacher Retention Insight Survey What management behaviors do principals need to improve?

21
© TNTP 2012 District teachers are twice as likely to leave schools with weak cultures where they do not feel valued as professionals. 18% of effective teachers at district schools with the strongest cultures plan to leave in the next 2 years 38% of effective teachers at district schools with the weakest cultures plan to leave in the next 2 years At district schools with a weak culture, twice as many effective teachers plan to leave in the next 2 years

22
© TNTP 2012 The strength of a DC Charter school’s culture explains as much of the variation in math achievement as demographics alone. These findings have been externally validated by the American Institutes for Research. 19 Demographics Alone Index Score The Index explains between 5% and 20% of the variation in student performance between schools within a particular site. Demographics include school size and student demographics. Percent Variation in Math Proficiency Explained By….

23
© TNTP 2012 Teachers in schools with strong instructional cultures are observed – and receive feedback – more frequently than other teachers. Mean Number of Total Short Observation 20 Total 19 Total 14 Total Combined with the likelihood of receiving feedback, teachers in top-quartile schools have already received 2x the feedback as those in the bottom-quartile.

24
© TNTP 2012 Teachers at top-quartile schools are far more likely to report they receive enough feedback, and that the feedback is useful.

25
© TNTP 2012 Top-quartile schools more frequently deliver informal feedback – an email or quick chat in the hallway – following observations. More than half of all teachers at top-quartile schools report receiving these types of informal feedback, compared to one-third of teachers at bottom-quartile schools.

26
© TNTP 2012 Using the Campus Reports, we highlight areas for specific school improvement and point to local exemplar practices. Providing local exemplars gives each campus a sense of what is possible within their own school Schools that are struggling can target areas for improvement, setting goals based on what top schools realized By identifying how each school stacks-up against the most effectively managed schools in their community, we uncover what works—and what needs work—to build a stronger learning environment. Top Quartile LEA School

27
© TNTP 2012 Agenda Welcome and Introductions Introduction to The School Leader’s Toolbox Instructional Culture Insight Teacher Evaluation Question & Answer 27

28
© TNTP 2012 Contents of the Evaluation Toolkit Who is responsible for evaluating and developing teachers? How frequently are teachers evaluated? How frequently are teachers observed and given feedback? How can feedback be delivered effectively? How is student performance data considered in teacher evaluation? How are summative ratings determined? Expectations and goal-setting documents Observation and feedback schedules Observation tools and trackers Protocols for conducting observations and delivering feedback Feedback and professional growth forms Summative evaluation rubrics 28 ESSENTIAL QUESTIONS TOOLS

29
© TNTP 2012 Promising Evaluation Practices 1 Clear, Rigorous Expectations Teachers work with coaches to set rigorous classroom goals. 2 Frequent Observation Observe teacher practice regularly using a variety of instructional leaders and coaches. 3 Regular Feedback Deliver constructive feedback regularly and prioritize concrete action steps for improvement. 4 Use of Student Growth Consider weighting student outcomes in teacher evaluations to get a clearer picture of teacher effectiveness, particularly as networks expand and effectiveness data is used for high-stakes decisions. 5 Significance Use evaluation results to drive key employment decisions about teachers. 29

30
© TNTP 2012 Promising Practices in Action 1 Clear, Rigorous Expectations Evaluate teachers on clear standards of instructional excellence that prioritize student learning. 2 Frequent Observation Each teacher, on average, is observed weekly. 3 Regular Feedback Each teacher, on average, meets weekly with a trained coach to discuss observation notes, lesson plan reviews, and the teacher’s impact on student growth. 4 Use of Student Growth Teacher value-added measures are being piloted as one of multiple measures that will inform placement on a career ladder. 5 Significance Teachers who struggle are placed on detailed performance improvement plans. Evaluation results dictate which teachers’ contracts are renewed for the following year. 30 Achievement First

31
© TNTP 2012 31 Informal diagnosis 31 1 Clear, Rigorous Expectations Teachers work with coaches to set rigorous classroom goals. 2 Frequent Observation Observe teacher practice regularly using a variety of instructional leaders and coaches. 3 Regular Feedback Deliver constructive feedback regularly and prioritize concrete action steps for improvement. 4 Use of Student Growth Consider weighting student outcomes in teacher evaluations to get a clearer picture of teacher effectiveness, particularly as networks expand and effectiveness data is used for high-stakes decisions. 5 Significance Use evaluation results to drive key employment decisions about teachers. 1.Think to yourself : Does your school’s evaluation system exemplify these promising practices? 2.Turn to your neighbor : What is the most effective aspect of your evaluation system? In which category can you most improve?

32
© TNTP 2012 Teachers who share a common vision of instruction are more satisfied with their evaluation. Percent of teachers who “Strongly Agree” or “Agree” that “Overall, I am satisfied with the evaluation process at my school.” CLEAR, RIGOROUS EXPECTATIONS Teachers who believe that fellow teachers share a common vision of effective teaching* All other teachers *Teachers who responded "Strongly agree" or "Agree" to “Teachers at my school share a common vision of what effective teaching looks like.” 32

33
© TNTP 2012 A common vision of excellent instruction ensures shared expectations between teachers and administrators. The IMPACT Teaching and Learning Framework provides a clear definition of what effective teaching looks like with descriptions of both teacher and student behaviors for each standard. Teachers receive both written and oral feedback on a minimum of five observations throughout the year, with guidance on next steps for professional growth. Conversations between teachers and managers at the start of the year focus on how the teacher will meet AF’s Essentials of Effective Instruction. Regular observations and feedback conversations revisit these same expectations. The Instructional Practice and Professional Expectations Rubrics in the Teacher Appraisal and Development System describe teachers performing at different levels and the possible sources of evidence for each criterion in the rubric. The ENGAGE! performance management process involves creating a detailed self- assessment and setting specific goals for student outcomes. Specific instructional interventions are documented and discussed throughout the year. Evidence is collected in portfolios and discussed during regular feedback sessions. Achievement First (AF) Friendship Public Schools CLEAR, RIGOROUS EXPECTATIONS 33 D.C. Public Schools Houston ISD
 Friendship Public Schools CLEAR, RIGOROUS EXPECTATIONS 33 D.C. Public Schools Houston ISD.")
34
© TNTP 2012 Teachers who receive more observations report higher satisfaction with evaluation and feedback. Teacher Satisfaction with Evaluation and Feedback * Includes both short (≤15 minutes) and long (>15 minutes) observations. 34 FREQUENT OBSERVATION
 and long (>15 minutes) observations. 34 FREQUENT OBSERVATION.")
35
© TNTP 2012 Observation frequency and length varies, yet nearly two-thirds of teachers are observed at least 10 times annually. Average Annual Number of Observations* Reported by Teachers * Includes both short (≤15 minutes) and long (>15 minutes) observations. 84% of teachers surveyed reported being observed at least 5 times during the last school year. 65% reported being observed at least 10 times. FREQUENT OBSERVATION 35
 and long (>15 minutes) observations. 84% of teachers surveyed reported being observed at least 5 times during the last school year. 65% reported being observed at least 10 times. FREQUENT OBSERVATION 35.")
36
© TNTP 2012 How many teachers is each manager responsible for evaluating? Managers evaluate an average of 13.1 teachers, while leveraging instructional staff to conduct multiple observations. Across exemplar schools, each instructional leader is responsible for evaluating an average of 13.1 teachers. Which of the following people observed your teaching last year? % of teachers Instructional leader who formally evaluates me 95% Peer teachers 64% Instructional leader who does not formally evaluate me 63% Department chair / Grade-level leader 29% Other 12% 56% of teachers were observed by at least 3 types of observers. FREQUENT OBSERVATION 36

37
© TNTP 2012 Schools conduct more observations per teacher by finding creative ways to free up capacity. Training observers The use of certified observers, in addition to principals and assistant principals, allows each teacher to receive a minimum of 4 to 6 observations during the observation cycle. Memphis City Schools FREQUENT OBSERVATION Leveraging Technology Classroom time focuses on higher order critical thinking skills Learning Lab gives students 1:1 computer time for basic skills mastery Decreases the ratio of teachers to instructional managers and allows for a greater focus on individualization of support. Adding More “Blocking and Tackling” An Executive Principal oversees 3 schools, assuming most of the schools’ administrative responsibilities (“blocking and tackling”) and allowing campus leaders to focus their time on the observation and development of teachers. Rocketship Education Peak to Peak Charter 37 Utilizing Master Educators Master educators are expert practitioners in a content area that travel from school to school to conduct observations. Combined with principal evaluations, teachers have a formal, extended observation 5 times a year. D.C. Public Schools
 and allowing campus leaders to focus their time on the observation and development of teachers. Rocketship Education Peak to Peak Charter 37 Utilizing Master Educators Master educators are expert practitioners in a content area that travel from school to school to conduct observations. Combined with principal evaluations, teachers have a formal, extended observation 5 times a year. D.C. Public Schools.")
38
© TNTP 2012 Classroom observations can be recorded using a variety of tools. Provides an Optional Observation Form that is organized for taking evidence-based notes by competency areas. Teacher Development Tracker - notes 2-3 “key actionable changes” and “evidence of change” from observations. Observation Tracker – tracks teacher’s 2-3 “major PD/ instructional goals” and the 2-3 “latest core actionable changes.” Uses multiple observation forms for biweekly observations, depending on the observer’s role and purpose: Pop-in Observation and Feedback Template Walk-through Observation Template “What to Do” Observation – For evaluating teachers solely on how clearly they communicate directions to students Peer Observation Template Framework Rating Summary Sheet – rubric-based observation form used for informal observations. North Star Academy (Uncommon Schools) West Denver Prep FREQUENT OBSERVATION Observation Forms 38 Denver Public Schools Indiana Department of Education
 West Denver Prep FREQUENT OBSERVATION Observation Forms 38 Denver Public Schools Indiana Department of Education.")
39
© TNTP 2012 An effective cycle of observation and feedback connects each step in the process. Instructional managers (school leaders and trained senior teachers) conduct short (10-20 minute) weekly observations of each teacher. Frequency and duration are adjusted based on teacher needs. 2. Observe classroom teaching. 6. Summarize notes in tracker. 5. Hold the conversation with the teacher. 4. Plan the development/ feedback conversation. 3. Prioritize two “bite-sized” changes that will move student learning. 7. Provide accountability during next touch point, ensuring that the teacher made the changes and that the changes worked! The Observation & Feedback Cycle North Star Academy (Uncommon Schools) 1. Review feedback from last interaction (whether lesson planning meeting or past observation). REGULAR FEEDBACK 39
 conduct short (10-20 minute) weekly observations of each teacher. Frequency and duration are adjusted based on teacher needs. 2. Observe classroom teaching. 6. Summarize notes in tracker. 5. Hold the conversation with the teacher. 4. Plan the development/ feedback conversation. 3. Prioritize two bite-sized changes that will move student learning. 7. Provide accountability during next touch point, ensuring that the teacher made the changes and that the changes worked. The Observation & Feedback Cycle North Star Academy (Uncommon Schools) 1. Review feedback from last interaction (whether lesson planning meeting or past observation). REGULAR FEEDBACK 39.")
40
© TNTP 2012 Some districts and networks have developed new ways to consider student outcomes in evaluations. AF implemented its revised evaluation system in the 2010-11 school year; compensation and career path decisions will be influenced by effectiveness data beginning in SY 2012-13. CategoryMetrics Weight (Courses with Standardized Assessments) Weight (Courses without Standardized Assessments) Student Achievement Teacher value-added for student achievement 40%20% Student Character Development Student and parent surveys, principal observations of students 15% Quality of Instruction and Planning Principal assessment via frequent observations based on AF’s Essentials of Effective Teaching 30%50% Core Values and Contribution to Team Achievement Peer surveys, principal assessment of contributions and values. 15% Student achievement weight differs based on types of assessments Piloting new assessments in non-tested subjects. Achievement First (AF) System considers both outputs and inputs. USE OF STUDENT GROWTH 40
 Weight (Courses without Standardized Assessments) Student Achievement Teacher value-added for student achievement 40%20% Student Character Development Student and parent surveys, principal observations of students 15% Quality of Instruction and Planning Principal assessment via frequent observations based on AF’s Essentials of Effective Teaching 30%50% Core Values and Contribution to Team Achievement Peer surveys, principal assessment of contributions and values. 15% Student achievement weight differs based on types of assessments Piloting new assessments in non-tested subjects. Achievement First (AF) System considers both outputs and inputs. USE OF STUDENT GROWTH 40.")
41
© TNTP 2012 Apply these promising practices to your school 41 How can you incorporate each of these promising practices into the teacher evaluation system at your school? 1 Clear, Rigorous Expectations Teachers work with coaches to set rigorous classroom goals. 2 Frequent Observation Observe teacher practice regularly using a variety of instructional leaders and coaches. 3 Regular Feedback Deliver constructive feedback regularly and prioritize concrete action steps for improvement. 4 Use of Student Growth Consider weighting student outcomes in teacher evaluations to get a clearer picture of teacher effectiveness, particularly as networks expand and effectiveness data is used for high-stakes decisions. 5 Significance Use evaluation results to drive key employment decisions about teachers.

42
© TNTP 2012 Agenda Welcome and Introductions Introduction to The School Leader’s Toolbox Instructional Culture Insight Teacher Evaluation Question & Answer 42

43
© TNTP 2012 For more information on The School Leader’s Toolbox… Visit www.schoolleaderstoolbox.org to watch pre-recorded webinars on toolkit content and review our six engaging Toolkits; take a flyer at your seat to remember the web address.www.schoolleaderstoolbox.org Sign up to receive monthly newsletters, which will highlight upcoming webinars in the spring.

44
© TNTP 2012

Similar presentations


