Download presentation
Presentation is loading. Please wait.

1
ALCOHOL AND HEALTH Morten Grønbæk National Institute of Public Health Copenhagen, Denmark

2
Mortality -> Detrimental Effects:Cirrhosis, Cancer Positive Effects: Cardiovascular Disease Alcohol and Health

3
Mortality -> Detrimental Effects:Cirrhosis, Cancer Positive Effects: Cardiovascular Disease Alcohol and Health Somatic

4
Mortality -> Detrimental Effects:Cirrhosis, Cancer Positive Effects: Cardiovascular Disease Alcohol and Health Somatic Epidemiological evidence

5
Boffetta et al, Epidemiology 1990 Alcohol and mortality

6
Boffetta et al, Epidemiology 1990 Alcohol and mortality

7
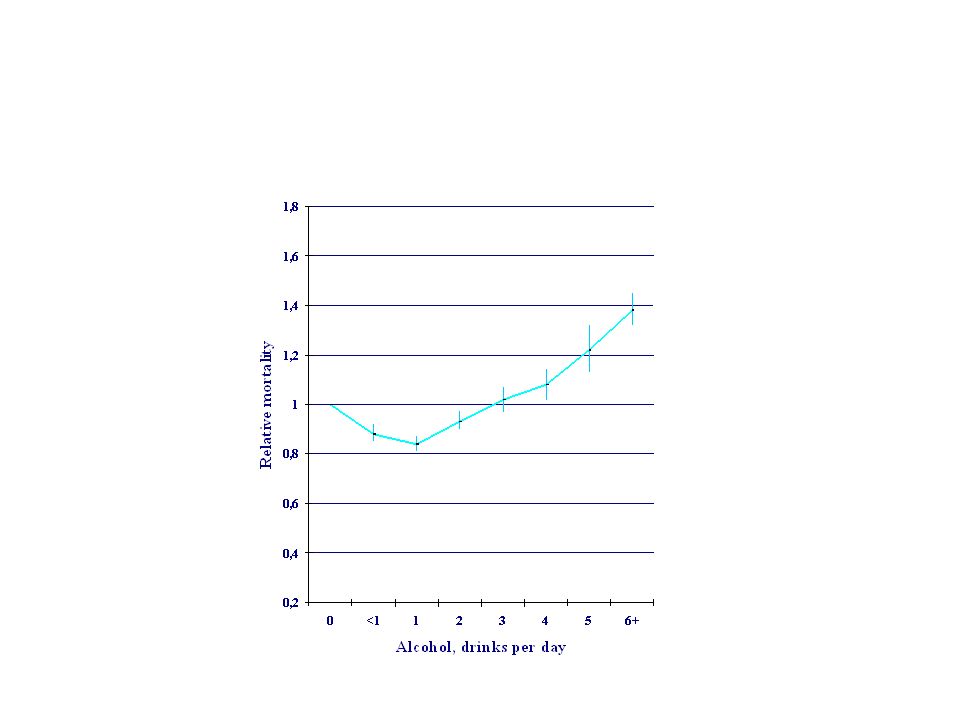
Boffetta et al, Epidemiology 1990

8
0,2 0,4 0,6 0,8 1 1,2 1,4 1,6 1,8 0<1123456+ Alcohol, drinks per day Relative mortality All Cancer Coronary heart disease Boffetta et al, Epidemiology 1990 Alcohol and cause specific mortality

9
Alcohol intake, drinks per week Relative risk 35 Alcohol and alcoholic cirrhosis

10
Drinks per week Relative risk < 11-67-1314-2728-4142-69>70 0 2 4 6 8 10 12 14 16 18 20 Alcohol and alcoholic cirrhosis Sex differences Men Women P < 0.05 Becker U et al., Hepatology 1996

11
Alcohol intake, drinks per day The Copenhagen Alcohol Cohort, N=9.000 5-910-1415-1920-2425-2930-3435+ Number of individuals439113412841192846535722 Number of deaths from alcoholic cirrhosis32645947301835 Men, percent49597275838689 Kamper-Jørgensen M et al, J Hepatol 2004

12
Alcohol intake, drinks per day The Copenhagen Alcohol Cohort, N=9.000 5-910-1415-1920-2425-2930-3435+ Number of individuals439113412841192846535722 Number of deaths from alcoholic cirrhosis32645947301835 Men, percent49597275838689 Kamper-Jørgensen M et al, J Hepatol 2004

13
Alcohol intake, drinks per day The Copenhagen Alcohol Cohort, N=9.000 5-910-1415-1920-2425-2930-3435+ Number of individuals439113412841192846535722 Number of deaths from alcoholic cirrhosis32645947301835 Men, percent49597275838689 SMR, cirrhosis: Men 27 Women 35 Kamper-Jørgensen M et al, J Hepatol 2004

14
Alc cir Men, amount Kamper-Jørgensen M et al, J Hepatol 2004 The Copenhagen Alcohol Cohort

15
Men, duration Kamper-Jørgensen M et al, J Hepatol 2004 The Copenhagen Alcohol Cohort

16
Alcohol and Breast Cancer Copenhagen Centre for Prospective Population Studies Petri A et al, Alc Clin Exp Res 2004

17
Tjønneland A et al, Cancer Causes and Control 2003; 14: 277–284 Alcohol and Breast Cancer Diet Cancer and Health Study

18
Alcohol and Breast Cancer Pooled analysis Ellison RC, Am J Epidemiol 2001

19
Alcohol and Breast Cancer Dose-response or threshold?

20
Upper digestive tract cancer Relative risk Alcohol, drinks per week Grønbæk et al, BMJ 1998

21
Alcohol and mortality Boffetta et al, Epidemiology 1990

22
Alcohol and cardiovascular disease Clinical and experimental evidence: - High density lipoprotein (HDL) - Low density lipoprotein (LDL) - Platelet aggregation - Fibrinogen - Fibrinolysis - Blood pressure
 - Low density lipoprotein (LDL) - Platelet aggregation - Fibrinogen - Fibrinolysis - Blood pressure")
23
Age, Sex, Genes Drinking pattern Factors influencing the association between alcohol and cardiovascular disease

24
Age, Sex, Genes Drinking pattern Factors influencing the association between alcohol and cardiovascular disease

25
Fuchs et al, NEJM 1995 Alcohol and mortality: Age Nurses’ Health Study

26
Fuchs et al, NEJM 1995 Alcohol and mortality: Age Nurses’ Health Study 34-39 y 40-49 y 50-59 y 60+ y

27
Genetics: Alcohol dehydrogenase ADH3: Functional polymorphism causing an ~3 fold difference in activity p(ADH3 1 ) = 0.6 (fast allele) p(ADH3 2 ) = 0.4 (slow allele)
 = 0.6 (fast allele) p(ADH3 2 ) = 0.4 (slow allele)")
28
Hines et al. : NEJM: 2001 (fast) (slow) ADH, alcohol and myocardial infarction
 (slow) ADH, alcohol and myocardial infarction")
29
Age, Sex, Genes Drinking pattern Factors influencing the association between alcohol and cardiovascular disease

30
Drinking pattern: Meal related alcohol intake Type of alcohol Binge vs steady intake Factors influencing the association between alcohol and cardiovascular disease

31
Alcohol intake consumed with meals and myocardial infarction Mukamal et al. NEJM 2003;348:109-18 Variable0.1-4.9 g/day5.0-29.9 g/day≥ 30.0 g/dayP value < 25% Relative risk 95% CI 1.00 - 0.67 0.45-0.99 0.57 0.32-1.03 0.05 25-74% Relative risk 95% CI 1.00 - 0.78 0.29-2.07 0.51 0.15-1.77 0.28 ≥ 75% Relative risk 95% CI 1.00 - 0.92 0.52-1.63 0.33 0.09-1.27 0.16

32
Different alcoholic beverages and cardiovascular disease mortality 0,2 0,4 0,6 0,8 1 1,2 1,4 1,6 1,8 NeverMonthlyWeeklyDaily,1-2Daily,3-5 Beverage specific alcohol consumption Relative risk Wine Beer Spirits Grønbæk et al., BMJ 1995

33
Percent wine of alcohol intake Grønbæk et al Ann Int Med 2000; 133(6):411-419
:")
34
Grønbæk et al Ann Int Med; 133(6):411-419 Alcohol, wine and mortality from CHD Non-wine drinkers Wine drinkers
: Alcohol, wine and mortality from CHD Non-wine drinkers Wine drinkers")
35
Grønbæk et al Ann Int Med; 133(6):411-419 Alcohol, wine and mortality from cancer
: Alcohol, wine and mortality from cancer")
36
Type of alcohol and mortality British Regional Heart Study

37
Alcohol, wine and alcoholic cirrhosis P < 0.05. Becker U et al., Hepatology 2002

38
Type of alcohol and upper digestive tract cancer Grønbæk et al. BMJ 1998 Wine, %

39
Differences in morbidity and mortality among drinkers of beer, wine and spirits Components? Flavonoids, polyphenols, nitrosamines Confounders? Lifestyle factors, social class, diet

40
Nielsen et al. J Int Med 2004;255:280-8 Wine Intake, Social Status and Mortality Copenhagen City Heart Study

41
Diet, Cancer, and Health Study, Denmark, 1996 Odds ratios for having an intake above the median of different foods according to preferred alcoholic beverage Tjønneland et al. Am J Clin Nutr 1999

42
Drinking pattern: Meal related alcohol intake Type of alcohol Binge vs steady intake Factors influencing the association between alcohol and cardiovascular disease

43
Drinking pattern: Binge vs steady intake Factors influencing the association between alcohol and cardiovascular disease - and all-cause mortality

44
Drinking pattern and CVD Frequency of drinkingAlcohol intake / drinking day Days / week<10.0 g10.0-29.9 g 30.0 g <11.00 (ref) 1-20.85 (0.67-1.08) 0.93 (0.78-1.10) 0.84 (0.70-1.02) 3-40.63 (0.33-1.19) 0.67 (0.55-0.83) 0.71 (0.54-0.93) 5-70.68 (0.33-1.37) 0.68 (0.57-0.82) 0.63 (0.52-0.76) Mukamal et al., N Engl J Med 2003
 ( ) 0.93 ( ) 0.84 ( ) ( ) 0.67 ( ) 0.71 ( ) ( ) 0.68 ( ) 0.63 ( ) Mukamal et al., N Engl J Med 2003")
45
Drinking pattern and CHD mortality McElduff, BMJ 1997 Days per week Don’t drinkRarely< 11 or 23 or 45 or 6Daily Drinks per day Don’t drink1.00 1 to 21.890.530.640.430.310.91 3 to 41.360.430.630.430.310.81 5 to 60.941.040.820.470.400.73 >91.571.580.890.861.43

46
Cancer, Diet and Health Study N=57.000 1996-2001 Alcohol intake, drinks per week 1 to 67 to 1314 to 21More than 21 Characteristics*FrequentNon- frequent FrequentNon- frequent FrequentNon- frequent FrequentNon- frequent Subjects (number)9,30511,29812,0909675,951171 117 Sex (% men)373354575361 72 Alcohol intake (median drinks per week) 5.23.09.48.718.318.1 26.4 Age (mean years)5556 5557
9,30511,29812, , Sex (% men) Alcohol intake (median drinks per week) Age (mean years)")
47
Alcohol drinking pattern and mortality Tolstrup et al, Addiction 2003

48
More evidence ? Alcohol – positive and negative ’effects’

49
More evidence ? Intervention study? Alcohol – positive and negative ’effects’

51
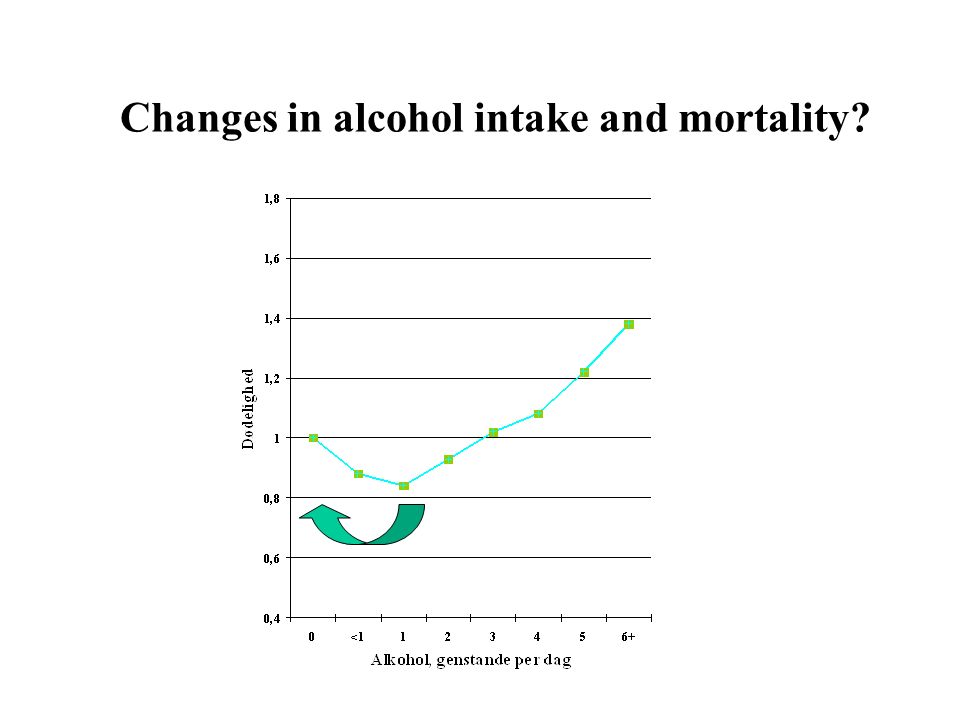
What will changes in alcohol intake mean for subsequent mortality?

52
Changes in alcohol intake and mortality?

54
Changes in alcohol intake and mortality Grønbæk et al., Epidemiology 2004;15(2):222-8 Alcohol intake, first examination, drinks per week Alcohol intake, second examination, drinks per week Number of subjects< 11-67-13> 13 < 12,26965313145 1-61,4352,670829235 7-132639961,238718 > 131373436742,018 Copenhagen Centre for Prospective Population Studies N = 30,630 participants
:222-8 Alcohol intake, first examination, drinks per week Alcohol intake, second examination, drinks per week Number of subjects< > 13 < 12, ,4352, , > ,018 Copenhagen Centre for Prospective Population Studies N = 30,630 participants")
55
Changes in alcohol intake and mortality Grønbæk et al., Epidemiology 2004;15(2):222-8 Alcohol intake, first examination, drinks per week Alcohol intake, second examination, drinks per week Number of subjects< 11-67-13> 13 < 12,26965313145 1-61,4352,670829235 7-132639961,238718 > 131373436742,018 Copenhagen Centre for Prospective Population Studies N = 30,630 participants
:222-8 Alcohol intake, first examination, drinks per week Alcohol intake, second examination, drinks per week Number of subjects< > 13 < 12, ,4352, , > ,018 Copenhagen Centre for Prospective Population Studies N = 30,630 participants")
56
Changes in alcohol intake and mortality Stable intake Grønbæk et al.,Epidemiology 2004;15(2):222-8
:222-8")
57
Changes in alcohol intake and CHD mortality Stable intake Grønbæk et al.,Epidemiology 2004;15(2):222-8
:222-8")
58
Changes in alcohol intake and mortality Grønbæk et al., Epidemiology 2004;15(2):222-8 Alcohol intake at first examination Alcohol intake at second examination < 1 1-67-13> 13 < 11.00 †0.94 (0.78-1.14)1.04 (0.76-1.43)1.26 (0.75-2.11) 1-61.21 (1.04-1.41)1.00 †1.00 (0.81-1.23)1.21 (0.88-1.67) 7-131.39 (1.09-1.77)0.91 (0.75-1.11)1.00 †1.21 (0.99-1.49) > 131.44 (1.10-1.88)1.01 (0.82-1.25)0.89 (0.75-1.06)1.00 †
:222-8 Alcohol intake at first examination Alcohol intake at second examination < > 13 < †0.94 ( )1.04 ( )1.26 ( ) ( )1.00 †1.00 ( )1.21 ( ) ( )0.91 ( )1.00 †1.21 ( ) > ( )1.01 ( )0.89 ( )1.00 †")
59
Changes in alcohol intake and CHD mortality Grønbæk et al., Epidemiology 2004;15(2):222-8 Alcohol intake at first examination Alcohol intake at second examination < 11-67-13> 13 < 11.00 †0.71 (0.44-1.14)0.92 (0.45-1.90)0.56 (0.14-2.30) 1-61.40 (1.00-1.95)1.00 †0.79 (0.48-1.30)0.38 (0.12-1.20) 7-131.46 (0.86-2.45)0.76 (0.49-1.17)1.00 †1.09 (0.70-1.71) > 131.42 (0.71-2.82)1.15 (0.70-1.87)1.05 (0.70-1.56)1.00 †
:222-8 Alcohol intake at first examination Alcohol intake at second examination < > 13 < †0.71 ( )0.92 ( )0.56 ( ) ( )1.00 †0.79 ( )0.38 ( ) ( )0.76 ( )1.00 †1.09 ( ) > ( )1.15 ( )1.05 ( )1.00 †")
60
Summary Alcohol and morbidity/mortality Lower risk among light drinkers of any alcohol Possibly interaction with: Age, sex and genetics factors Drinking pattern: Beer, wine, spirits Binge vs steady drinking

Similar presentations