Download presentation
Presentation is loading. Please wait.

1
Saudi Board of Radiology: Physics Refresher Course Kostas Chantziantoniou, MSc 2, DABR Head, Imaging Physics Section King Faisal Specialist Hospital & Research Centre Biomedical Physics Department Riyadh, Kingdom of Saudi Arabia Ultrasound Instrumentation

2
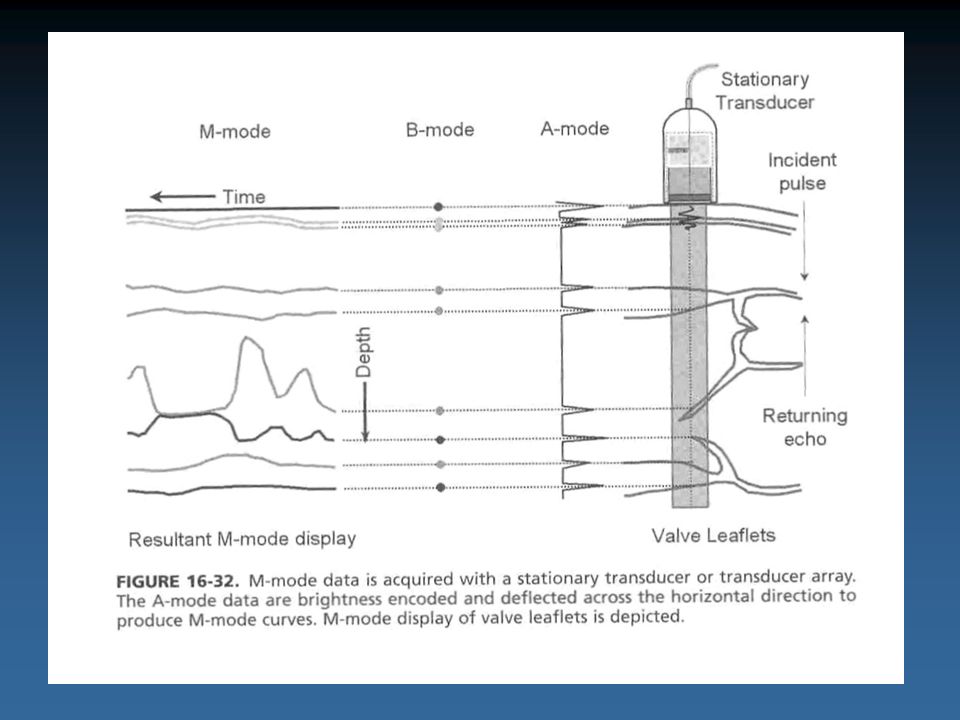
Echo Display Modes A-Mode (Amplitude Mode) the reason that the factor 1/2 appears is that the round-trip time is the time for the pulse to travel to reflector and back (true distance is only half that) the speed of sound in tissue is assumed to be 1,540 m/s A-mode displays depth on the horizontal axis and echo intensity (pulse amplitude) on the vertical axis display depth is computed from: depth (m) = speed of sound in tissue (m/s) pulse round time (s) 2
 the reason that the factor 1/2 appears is that the round-trip time is the time for the pulse to travel to reflector and back (true distance is only half that) the speed of sound in tissue is assumed to be 1,540 m/s A-mode displays depth on the horizontal axis and echo intensity (pulse amplitude) on the vertical axis display depth is computed from: depth (m) = speed of sound in tissue (m/s) pulse round time (s) 2")
3
A-mode systems have no memory, and a permanent record is obtained by photographing the CRT monitor A-mode may be used in ophthalmology or when accurate distance measurements are required because A-mode only provides information along the line of sight of a fixed transducer little use is made of the spike amplitude and has been superseded by M-mode and B-mode imaging B-Mode (Brightness Mode) B-mode is the electronic conversion of the A-mode and A-line information into brightness-modulated dots on the display screen the brightness of the dots is proportional to the echo signal amplitude the B-mode display is used for M-mode and 2D gray scale imaging
 B-mode is the electronic conversion of the A-mode and A-line information into brightness-modulated dots on the display screen the brightness of the dots is proportional to the echo signal amplitude the B-mode display is used for M-mode and 2D gray scale imaging")
4
M-Mode or T-M Mode (Time-Motion Mode) M-mode or T-M mode displays time on the horizontal axis and depth on the vertical axis the spikes of A-mode are converted into dots, and brightness replaces amplitude sequential ultrasound pulses are displayed adjacent to each other, allowing the change in position of interfaces to be seen a camera records the entire (horizontal) sweep to produce an image M-mode thus displays time-dependent motion longer times may be recorded with strip chart recorders M-mode is valuable for studying rapid movement, such as cardiac valve motion
 M-mode or T-M mode displays time on the horizontal axis and depth on the vertical axis the spikes of A-mode are converted into dots, and brightness replaces amplitude sequential ultrasound pulses are displayed adjacent to each other, allowing the change in position of interfaces to be seen a camera records the entire (horizontal) sweep to produce an image M-mode thus displays time-dependent motion longer times may be recorded with strip chart recorders M-mode is valuable for studying rapid movement, such as cardiac valve motion")
6
Scan Converter the function of the scan converter is to displays a static two-dimensional image of a section of tissue the gray scale is used to display the intensity of an echo from a given region the transducer functions both as a transmitter (in pulse mode) and a receiver the scanning technique involved either leaving the transducer in one place or physically moving it (compound motion) this compound motion is required because anatomic structures in the body presents various angles from which the ultrasound waves are reflected a single image or scan (frame) is created by adding together individual scan lines each scan line represented a series of echoes returning from a pulse traveling through the tissue (one scan line is acquired for each emitted ultrasound pulse) the line density is the number of scan lines per FOV (frame) Single Scan Line Single Frame (Scan)
 and a receiver the scanning technique involved either leaving the transducer in one place or physically moving it (compound motion) this compound motion is required because anatomic structures in the body presents various angles from which the ultrasound waves are reflected a single image or scan (frame) is created by adding together individual scan lines each scan line represented a series of echoes returning from a pulse traveling through the tissue (one scan line is acquired for each emitted ultrasound pulse) the line density is the number of scan lines per FOV (frame) Single Scan Line Single Frame (Scan)")
7
the span between emitted pulses allows for the returning echoes to be received and provides information about the depth of an interface the strength of returning echoes provides information about differences between the two tissues images are normally displayed on a television monitor and may be digitized and stored in a computer during image acquisition the digital signals are inserted into the matrix at memory addresses that correspond as close as possible to the relative reflector positions in the body ultrasound images generally have a 512 matrix size, with each pixel being 8 bits deep (1 Byte), allowing 256 (2 8 ) gray levels to be displayed each ultrasound frame therefore contains 0.25 MB of information
, allowing 256 (2 8 ) gray levels to be displayed each ultrasound frame therefore contains 0.25 MB of information")
8
In modern B-mode scanners, the image is automatically scanned in a succession of frames rapidly enough to follow the motion of tissue. The frame rate (frames per second) for real-time imaging is between 15 to 40 frames/s. In the process of acquiring an image, ultrasound beams are emitted in brief pulses with a duration of 1 m and are typically repeated every millisecond. Many transducer designs have been used to sweep back and forth (or steer) the ultrasound pulses (scan lines) during the acquisition of a frames. Real Time Imaging
 for real-time imaging is between 15 to 40 frames/s. In the process of acquiring an image, ultrasound beams are emitted in brief pulses with a duration of 1 m and are typically repeated every millisecond. Many transducer designs have been used to sweep back and forth (or steer) the ultrasound pulses (scan lines) during the acquisition of a frames. Real Time Imaging.")
9
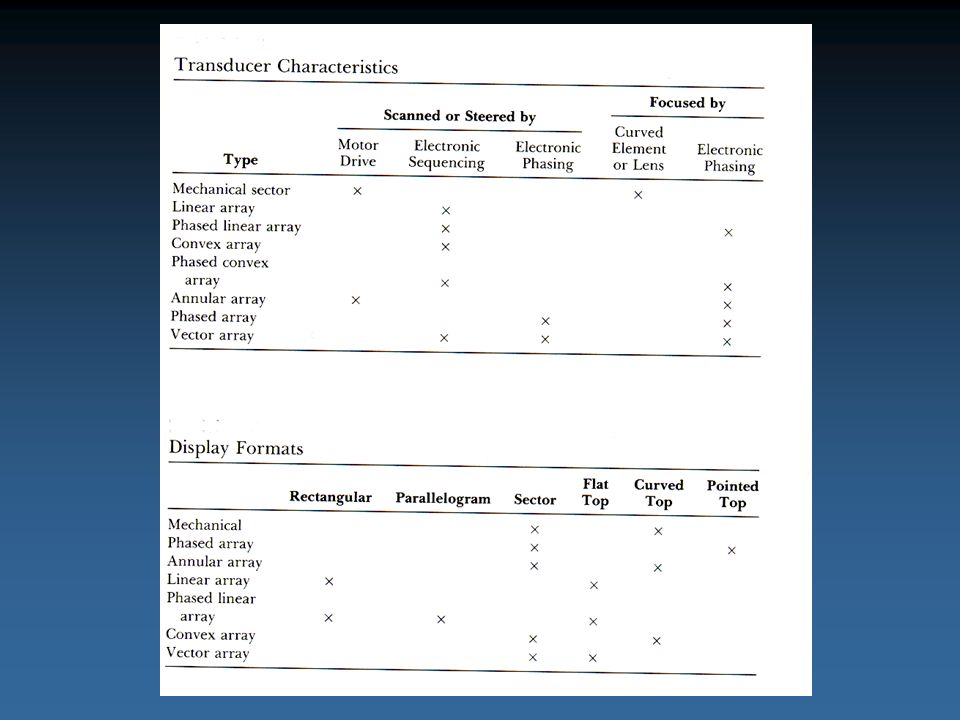
There are two basic techniques for producing real-time ultrasonic images: Mechanical Scanning Transducers Mechanical scanning may be accomplished by oscillating a transducer in angle, by rotating a transducer or a group of transducers, by oscillating a reflector, or by linearly translating a transducer. in most mechanical transducers, the rotating or oscillating component is immersed in an acoustic coupling liquid within the transducer assembly the sound beam is thus swept at a rapid rate without movement of the entire transducer assembly the most common methods of mechanical scanning currently used are the oscillating transducer and rotating group driven by a motor NOTE a mechanical transducer are cheaper depending on their design a rotating transducer can generate a sector or a trapezoid shaped image focusing is accomplished by the use of an acoustic lens

10
Oscillating Transducer Rotating Transducer

11
Electronic Scanning Transducers Electronic transducers use an array of small rectangular piezoelectric elements arranged either in a straight line or an annular design that do not move and are under electronic control. Linear Sequence Array (Linear Array) The linear array is operated by applying voltage pulses to groups of elements in succession (from right to left), in this way each group acts like a larger transducer element. Firing each element individually would cause excessive beam divergence and poor resolution (small aperture - each element can be approximately 1 mm in size). the aperture (diameter) is the size of the group of elements energized to produce one pulse the width of the image is equal to the length of the array these transducers produce a rectangular shaped image
 The linear array is operated by applying voltage pulses to groups of elements in succession (from right to left), in this way each group acts like a larger transducer element. Firing each element individually would cause excessive beam divergence and poor resolution (small aperture - each element can be approximately 1 mm in size). the aperture (diameter) is the size of the group of elements energized to produce one pulse the width of the image is equal to the length of the array these transducers produce a rectangular shaped image.")
12
In linear array systems focusing is done electronically in one direction and with the use of an acoustic lens in the other dimension. Electronic focusing

13
Annular Sequence Array (Annular Array) The elements instead of being arranged linearly they can also be ring-shaped and arranged concentrically (annular). instead of firing a group of elements like in a linear array each element is fired individually these transducers produce a sector shaped image

14
Convex Sequence Array (Curvilinear Array) A convex array is constructed as a curved line of elements rather than a straight line. Its operation is identical to that of the linear array (sequencing groups of elements), but because of the curved construction, the pulses travel out in different direction, producing a sector type image.
, but because of the curved construction, the pulses travel out in different direction, producing a sector type image..")
15
Vector Array Phasing can be applied to a linear array to steer pulses in various directions, this type of linear array is called a vector array. Scan lines originate from different points across the top of the display and travel out in different directions. The image format is similar to that of the convex array except that the contact surface is smaller and the top of the display is flat.

16
Linear Phased Array (Phased Array) A linear phased array is operated by applying voltage pulses to all elements (not a small group) in the assembly as a complete group, but with small time differences, so that the resulting sound pulse may be sent out in a specific path direction. If the same time difference were used each time the process was repeated, the same direction would result repeatedly. However, the time differences (phasing) are changed with each successive repetition so that the beam direction can continually change. the phased array is sometimes called the electronic sector transducer this type of transducer produces a sector type of image
 are changed with each successive repetition so that the beam direction can continually change. the phased array is sometimes called the electronic sector transducer this type of transducer produces a sector type of image.")
17
In addition to steering the beam by phasing, the phased array can focus the beam by phasing as well.

18
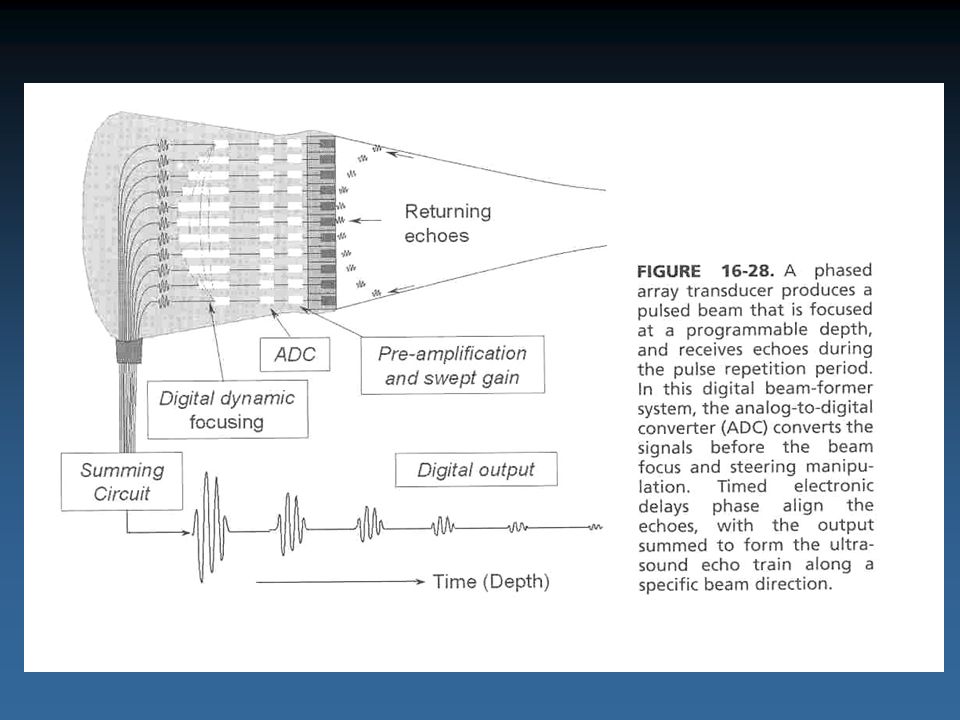
in order to create a multiple focus beam, phased arrays use multiple pulses in a given scan line, each pulse being focused at a different depth in multiple focus mode, echoes from the focal region of each pulse are imaged and the rest are discarded using multiple pulses per scan line takes more time, and the frame rate is reduced temporal resolution (resolution as a function of time) is sacrificed for an improvement in detail resolution Phased Array (Multiple Focus Mode)
 is sacrificed for an improvement in detail resolution Phased Array (Multiple Focus Mode)")
19
Phased Array (Dynamic Aperture) In order to maintain a comparable focal beam width, more array elements are used (increasing aperture) as the focus is moved deeper. not all elements of a phased array are used to generate all pulses, smaller groups are used for short focal lengths,whereas incrementally larger groups are used for focuses of increasing depth

22
Image Acquisition

24
Pulser : The pulser produces electric pulses that drives the transducer (T) through the beam former. It also includes a clock that determines the pulse repetition frequency (PRF) and synchronizes the various components of the instrument. Beam former : The beam former performs all the tasks necessary for beam steering, transmit focusing, dynamic aperture and any other additional timing requirements for phase arrays. Receiver : The returning echoes (voltages) go through the beam former to the receiver, where they are processed to a form suitable for input into the memory. Memory : Electric information from memory drives the display, which produces a visual image of the cross-sectional anatomy interrogated by the system.
 and synchronizes the various components of the instrument. Beam former : The beam former performs all the tasks necessary for beam steering, transmit focusing, dynamic aperture and any other additional timing requirements for phase arrays. Receiver : The returning echoes (voltages) go through the beam former to the receiver, where they are processed to a form suitable for input into the memory. Memory : Electric information from memory drives the display, which produces a visual image of the cross-sectional anatomy interrogated by the system..")
25
Receiver The receiver performs the following functions: (1) amplification (2) compensation (3) compression (4) demodulation (5) rejection Amplification Amplification is the conversion of the small voltages received from the transducer to larger ones suitable for processing and storage. Power ratio = (Voltage Out) 2 (Voltage In) 2 Gain (dB) = 10 log (power ratio)
 2 (Voltage In) 2 Gain (dB) = 10 log (power ratio).")
26
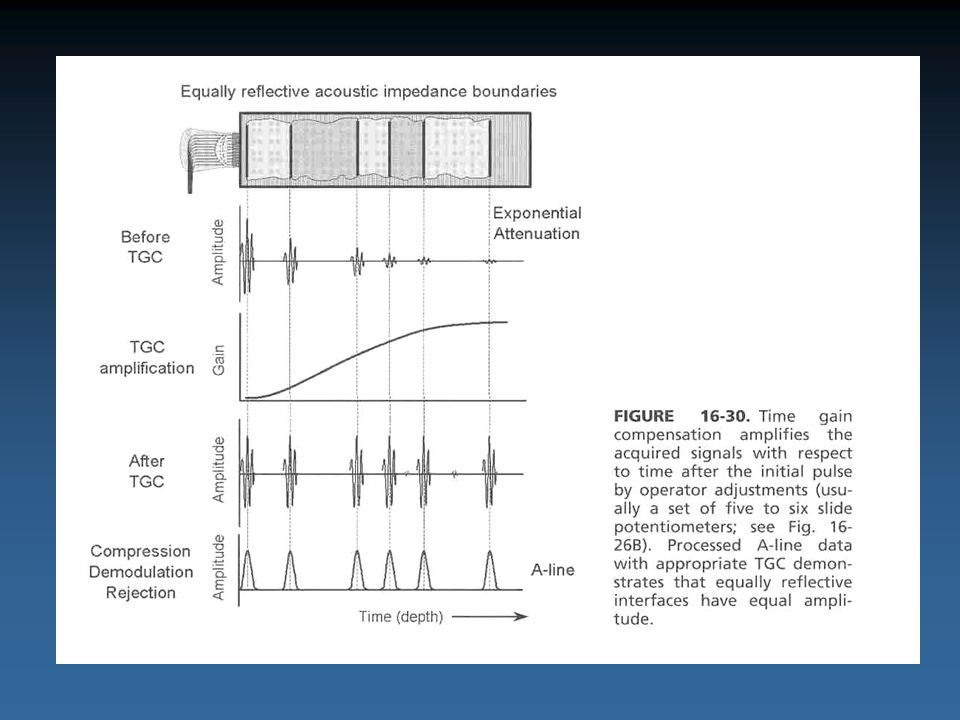
the gain control determines how much amplification is accomplished in the receiver too little gain, weak echoes are not imaged too much gain, saturation occurs (i.e.: most echoes appear bright and differences in echoes strength (contrast resolution) is lost Compensation (Gain Compensation or Depth Gain Compensation) Compensation equalizes differences in received echo amplifications because of reflector depth. because attenuation depends on depth, reflectors with equal reflection coefficients will not result in equal amplitude echoes arriving at the transducer if their travel distance are different NOTE Image depth is determined by the attenuation and maximum depth gain compensation

27
Compression Compression is the process of decreasing the differences between the smallest and largest amplitudes, which is accomplished by logarithmic amplifiers that amplify weak inputs more than strong ones. In other words, compression lowers the systems’ dynamic range. ASIDE A viewing display can only handle a power ratio in the order of 100 (20 dB), we get signals that have power ratio’s over 1,000,000,000 (90 dB).
, we get signals that have power ratio’s over 1,000,000,000 (90 dB)..")
28
Demodulation Demodulation is the process of converting the voltage delivered to the receiver from one form (radio frequency, RF) to another (video). This is done by rectification and smoothing. Rectification Smoothing

29
Rejection Rejection (also called suppression or threshold) eliminates the smaller amplitude voltage pulses produced by weaker echoes (multiple scattering from within tissue) or electronic noise.
 eliminates the smaller amplitude voltage pulses produced by weaker echoes (multiple scattering from within tissue) or electronic noise.")
30
Overall Receiver Process

32
Digitization (Pre-processing) To store echo information in digital memory the demodulated voltage amplitudes representing echoes must pass through an analog-to-digital converter (ADC). Digital pre-processing is performed to assign numbers to echo intensities.

33
Contrast Resolution For linear pre-processing assignments, the echo dynamic range (40 dB below) is equally divided throughout the gray levels of the system. The more gray levels (bits/pixel) that are used, the better the contrast resolution between adjacent pixels.
 that are used, the better the contrast resolution between adjacent pixels..")
34
Image Memory Image memory used in ultrasound instrumentation are of the digital type. These memories are some times called digital scan converters because they provide a means for displaying, using a television scan format information acquired in a linear or sector scan line format. The image plane is divided into a 512 x 512 pixel matrix, with each pixel being 8 bit (256 gray values) deep.
 deep..")
35
Image Storage US images are typically composed of 640 x 480 or 512 x 512 pixel matrices each pixel typically has a depth of 8 bits (1 byte) of digital data, providing up to 256 levels of gray image storage (without compression) is typically 0.25 MB/image for real-time imaging (10 to 30 frames/s) this can amount to hundreds of megabytes color images used for Doppler studies increase the storage requirements further because of larger numbers of bits needed for color resolution (full fidelity color requires 24 bits/pixel, 1 byte each for the red, green and blue primary color)
 of digital data, providing up to 256 levels of gray image storage (without compression) is typically 0.25 MB/image for real-time imaging (10 to 30 frames/s) this can amount to hundreds of megabytes color images used for Doppler studies increase the storage requirements further because of larger numbers of bits needed for color resolution (full fidelity color requires 24 bits/pixel, 1 byte each for the red, green and blue primary color)")
36
Image Display (Post-processing) Digital post-processing is performed to assign specific display brightness to numbers derived from specific pixel locations in memory. Since monitors are analog output devices a digital-to-analog (DAC) must be used to convert the digital pixel value to a brightness value on the monitor. Look-up tables (LUT) can be used to alter the way the image can look on the monitor.
 must be used to convert the digital pixel value to a brightness value on the monitor. Look-up tables (LUT) can be used to alter the way the image can look on the monitor..")
37
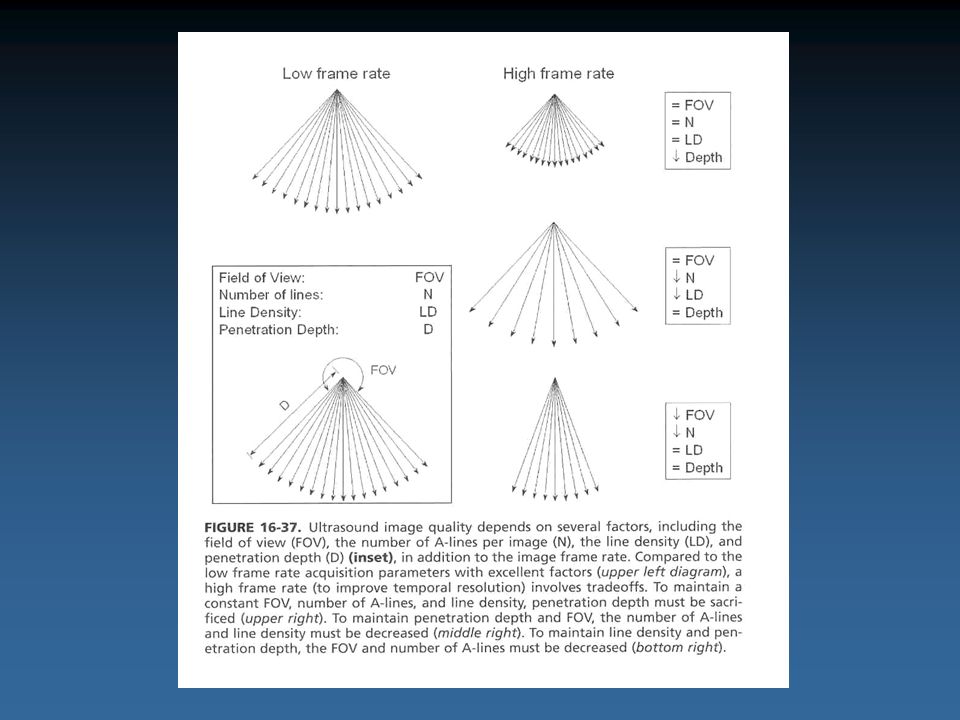
Scan Line Density (lines/frame) Since the patient’s tissue is in effect ‘sampled’ along a number of scan lines, each frame must be made up of a sufficiently large number of scan lines in order to obtain good lateral resolution. Frame Rate (frames/second) To follow moving tissues, a sufficiently large number of frames must be scanned each second. The frame repetition frequency depends on the number of lines/frame, and is increased by increasing the PRF (number of pulses sent out every second): frame rate lines/frame = PRF Depth of View To image structures at depth, each pulse must have time to make the return journey from the deepest tissue before the next pulse is generated. The depth of view is increased by reducing the PRF: depth of view = 0.5 sound velocity PRF Display and Temporal Resolution
 To follow moving tissues, a sufficiently large number of frames must be scanned each second. The frame repetition frequency depends on the number of lines/frame, and is increased by increasing the PRF (number of pulses sent out every second): frame rate lines/frame = PRF Depth of View To image structures at depth, each pulse must have time to make the return journey from the deepest tissue before the next pulse is generated. The depth of view is increased by reducing the PRF: depth of view = 0.5 sound velocity PRF Display and Temporal Resolution.")
38
It is therefore not possible to achieve both a high pulse frame rate (frame repetition frequency) and a high scan line density and at the the same time produce an image with a large depth of view. One or more aspects have to be compromised. It can be shown that: penetration (cm) number of focuses lines/frame frame/s < 77,000 cm/s where 77,000 is the one half of the average speed of sound in tissue (154,000 cm/s)
 number of focuses lines/frame frame/s < 77,000 cm/s where 77,000 is the one half of the average speed of sound in tissue (154,000 cm/s).")
Similar presentations


, education, telemedicine, videoconference, videophone Storage capacity Large capacity.>")


