Download presentation
Presentation is loading. Please wait.

1
Assessing Charter School Performance: Tools for Predicting and Monitoring the Academic and Financial Risk of Charter Schools

2
Who is Self-Help? Non-profit CDFI founded in 1980 Mission: Creating and protecting ownership and economic opportunity for people of color, women, rural residents and low- wealth families Over $100 million in financing charter schools nationwide since 1997

3
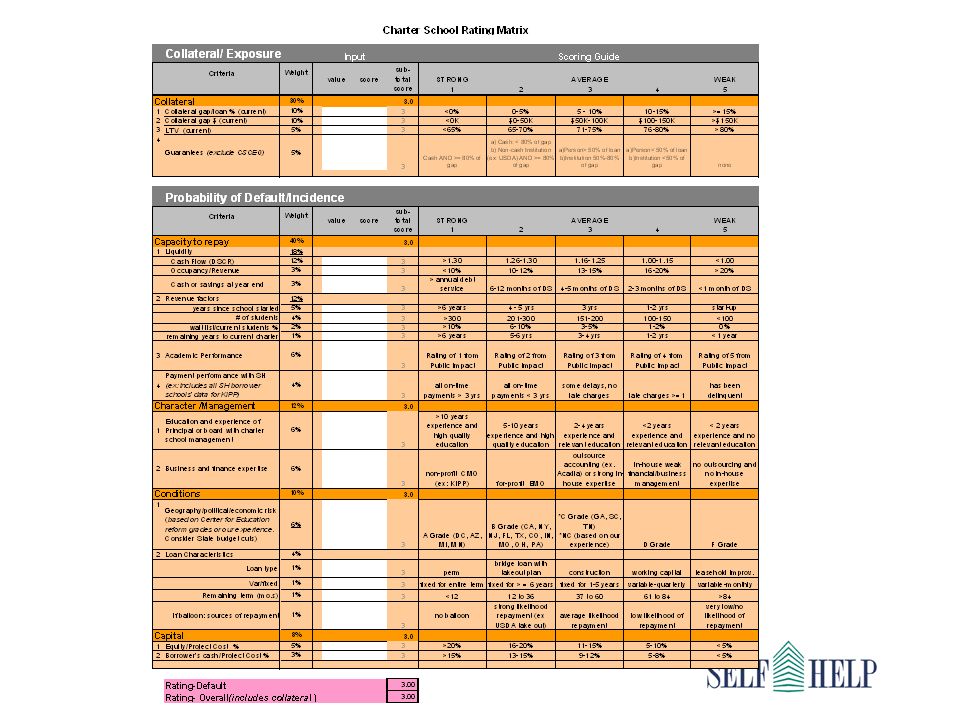
Charter School Risk Rating Matrix Fiscal Health Monitoring Academic Health Monitoring

4
Charter School Risk Rating Matrix Fiscal Health Monitoring Academic Health Monitoring

5
Purposes & Uses of Rating Matrix Standardize risk assessment of loans to compare relative risk Differentiate monitoring efforts based on risk Potential loan evaluation Underwriting feedback mechanism Assess portfolio risk as a whole to manage grant funds Determine loan loss reserve Training tool for new loan officers Customized for Commercial Real Estate, Charter School, and Other Lending

6
SH Charter School Risk Rating Process Loan Package Loan Closing Credit Committee Approval Monitoring Y Rating Matrix Probability of Default- Interest Rate Risk Rating Categories Academic Rating Academic Appraisal

7
Charter School Risk Rating Matrix Fiscal Health Monitoring Academic Health Monitoring

8
Risk Rating Matrix Criteria: Based on 5 Cs of Credit –Capacity to Repay –Character/Management –Conditions –Capital –Collateral Each criterion is assigned different weights based on importance

10
Charter School Risk Rating Matrix Fiscal Health Monitoring Initial School Evaluation Tool Academic Monitoring Tool Academic Health Monitoring

11
Academic Performance Monitoring Academic elements assessed using two instruments: Initial School Evaluation –Qualitative & quantitative information –Helps make initial loan decision Academic Monitoring Tool –Quantitative –Used for performance monitoring

12
Initial School Evaluation Tool used to gather background information on prospective borrowers Collects qualitative and quantitative school data Helps assess how closely borrower meets our mission: serving at-risk student populations to close the achievement gap Information used to help loan officer make an initial lending decision

13
Initial School Evaluation Gathers school information in four domains: –Student / Community Population –Academic Performance –School Curriculum –Non-Academic Indicators Designed to compliment site visits and interviews with school leadership and other relevant third parties (e.g., authorizer, resource centers)
")
14
Academic Monitoring Tool Public Impact developed academic assessment tool for charter portfolio Used to assess risk of school closure due to academic performance Helps us monitor current loans and predict the academic success of future loans

15
Academic Monitoring Tool Converts achievement data into a single performance score, used in the risk matrix –Assigns school scores from 1 (no risk of closure) to 5 (high risk of closure) –Scores based on AYP data, student proficiency, performance history over 3 years, comparisons to state and district data Monitoring tool tracks progress over time, and compares schools
 to 5 (high risk of closure) –Scores based on AYP data, student proficiency, performance history over 3 years, comparisons to state and district data Monitoring tool tracks progress over time, and compares schools")
16
Example of School Data Collection Measure #4 Percentage of Students Proficient Measure #5 Comparison to State Measure #6 Comparison to District Students proficient on all tests? Difference in Math Difference in English Difference in Math Difference in English 39%-8%-27%4%-13% Measure #7 Change in Performance Over 3 YearsMeasure #8 Student Growth Average growth per year (Math)? Average growth per year (English)? What Value-Added Growth score did the school receive? 2%-14%Average Growth Measure #1 AYP History Measure #2 AYP Subgroups Measure #3 Percentage of Students Proficient Over 3 years how often has school made AYP? What percent subgroups made AYP in current year? Math?English? 33%100%72%41%
. Average growth per year (English). What Value-Added Growth score did the school receive. 2%-14%Average Growth Measure #1 AYP History Measure #2 AYP Subgroups Measure #3 Percentage of Students Proficient Over 3 years how often has school made AYP. What percent subgroups made AYP in current year. Math English. 33%100%72%41%.")
17
Example of School Scoring Measure #1 AYP HistoryMeasure #2 AYP Subgroups Measure #3 Percentage of Students Proficient In last 3 years how often has school made AYP? What percent subgroups made AYP in current year? Students proficient in Math? Students proficient in English? 33%100%72%41% Measure #1 AYP HistoryMeasure #2 AYP Subgroups Measure #3 Percentage of Students Proficient In last 3 years how often has school made AYP? What percent subgroups made AYP in current year? Students proficient in Math? Students proficient in English? 3125 For each measure school receives score of 1 (highest) to 5 (lowest) based on predetermined thresholds:
 to 5 (lowest) based on predetermined thresholds:.")
18
How We Weigh the Data To find total score, calculate weighted average From highest to lowest 1) Growth percentage 2) Change in performance over time 3) Comparison to state and district averages 4) Percent proficiency on state tests 5) AYP subgroup performance 6) AYP history
 Growth percentage 2) Change in performance over time 3) Comparison to state and district averages 4) Percent proficiency on state tests 5) AYP subgroup performance 6) AYP history")
19
Improvement Areas in Process Reevaluating performance thresholds Consideration for schools with high percentage of special needs populations Tracking more intangible qualities of a school Input of charter school closure rate & other authorizer variables

20
Contact Us Jane Ellis Director, Charter School Lending jane.ellis@self-help.org 919.956.4407/800.476.7428 Self-Help Services Corp 301 West Main Street Durham, NC 27701 www.self-help.org/charterschools

Similar presentations


 Franco Fiordelisi Introduction to banking.>")

 Cesar Lopez Director of Lending and Small Business.>")


