Download presentation
Presentation is loading. Please wait.

1
ECON 2213 4. Poverty and Inequality

2
Measuring poverty To measure poverty, we first need to decide on a poverty line, such that those below it are considered poor. We can use an absolute poverty line (e.g., the World Bank’s $1 or $2 per day poverty line) or a relative poverty line (e.g., half of median income). The most common way to measure poverty is to use the poverty rate or headcount ratio: this is the share of the population below the poverty line.
 or a relative poverty line (e.g., half of median income). The most common way to measure poverty is to use the poverty rate or headcount ratio: this is the share of the population below the poverty line..")
3
Measuring poverty The poverty rate is simple and easy to understand, but has weaknesses. First, the poverty rate does not indicate the depth or intensity of poverty, i.e., how far below the poverty line poor people are. Second, the poverty rate does not change if people below the poverty line become poorer. These weaknesses are addressed with the poverty gap. This adds up the extent to which individuals on average fall below the poverty line and expresses it as a percentage of the poverty line.

5
Measuring poverty The squared poverty gap (or poverty severity index) takes into account inequality among the poor. This is a weighted sum of poverty gaps, where the weights are the poverty gaps themselves (e.g., a poverty gap of 10% of the poverty line gets a weight of 10%, a poverty gap of 50% of the poverty line gets a weight of 50%, etc.), thereby putting more weight on individuals who are far below the poverty line.
, thereby putting more weight on individuals who are far below the poverty line..")
7
Measuring poverty In Canada, we measure poverty based on a person’s or household’s income. In low-income countries, it may be better to measure poverty based on consumption, as consumption may be more accurately measured, and many workers may receive in-kind income (e.g., food). Other measures of well-being can be used, such as the Human Development Index, education, life expectancy, infant mortality, or Sen’s “capabilities” approach.
. Other measures of well-being can be used, such as the Human Development Index, education, life expectancy, infant mortality, or Sen’s capabilities approach..")
8
Measuring inequality The Gini coefficient or Gini index is the most common measure of inequality. The Gini coefficient is a number between 0 (perfect equality) and 1 (perfect inequality). A Gini is based on a Lorenz curve, which shows how much of a country’s income is received by various percentages of the population; Gini is the ratio of the area between the line of complete equality and the Lorenz curve to the area of the triangle between the line of complete equality and the axes. The formula for the Gini index is:
 and 1 (perfect inequality). A Gini is based on a Lorenz curve, which shows how much of a country’s income is received by various percentages of the population; Gini is the ratio of the area between the line of complete equality and the Lorenz curve to the area of the triangle between the line of complete equality and the axes. The formula for the Gini index is:.")
12
Measuring inequality Other ways to measure inequality include the range (top earner minus bottom earner), the ratio (top earner divided by bottom earner), the coefficient of variation (standard deviation divided by mean), and the Theil index, which is one of a set of generalized entropy measures. The Theil index has a strong advantage over the Gini, as it is decomposable into between-group and within-group inequality. The formula for the Theil T index is:

13
Measuring inequality Inequality can be measured: – Within a household. – Between households. – Within a village. – Between villages. – Within rural areas or urban areas. – Between rural areas and urban areas. – Within a state/province. – Between states/provinces. – Within a country. – Between countries.

14
Measuring inequality In 1955, Kuznets made a prediction that, as countries develop, inequality will first rise and then fall. This has become known as the Kuznets curve.

15
Worldwide poverty trends (PovCalNet): $1.25/day
: $1.25/day")
17
Worldwide poverty trends (PovCalNet): $2.50/day
: $2.50/day")
19
Poverty trends in China and India Using the $1.25/day measure, between 1981 and 2009: – Rural China: The headcount fell from 94% to 21%, and the poverty gap fell from 47% to 5%. – Urban China: The headcount fell from 44% to 0.6%, and the poverty gap fell from 9% to 0.2%.

20
Poverty trends in China and India Using the $1.25/day measure, between 1978 and 2009: – Rural India: The headcount fell from 69% to 34%, and the poverty gap fell from 25% to 8%. – Urban India: The headcount fell from 55% to 29%, and the poverty gap fell from 19% to 7%.

22
Worldwide inequality trends Sala-i-Martin (2002) estimates that the worldwide Gini fell from 0.657 in 1970 to 0.633 in 1998, and that the worldwide Theil fell from 0.835 in 1970 to 0.776 in 1998.
 estimates that the worldwide Gini fell from in 1970 to in 1998, and that the worldwide Theil fell from in 1970 to in 1998.")
24
Inequality trends in China and India UN-WIDER (World Institute for Development Economics Research) have put together estimates of the Gini for China and India. – Rural China: The Gini was 0.29 in 1978, 0.25 in 1981, 0.30 in 1985, 0.33 in 1991, and 0.33 in 2003. – Urban China: The Gini was 0.17 in 1981, 0.21 in 1995, 0.25 in 2000, and 0.33 in 2003. – Rural India: The Gini was 0.34 in 1951, 0.33 in 1961, 0.29 in 1970, 0.30 in 1983, 0.30 in 1992. – Urban India: The Gini was 0.40 in 1951, 0.36 in 1961, 0.35 in 1970, 0.34 in 1983, 0.36 in 1992. Notice that rural inequality is higher in China, but urban inequality is higher in India.

25
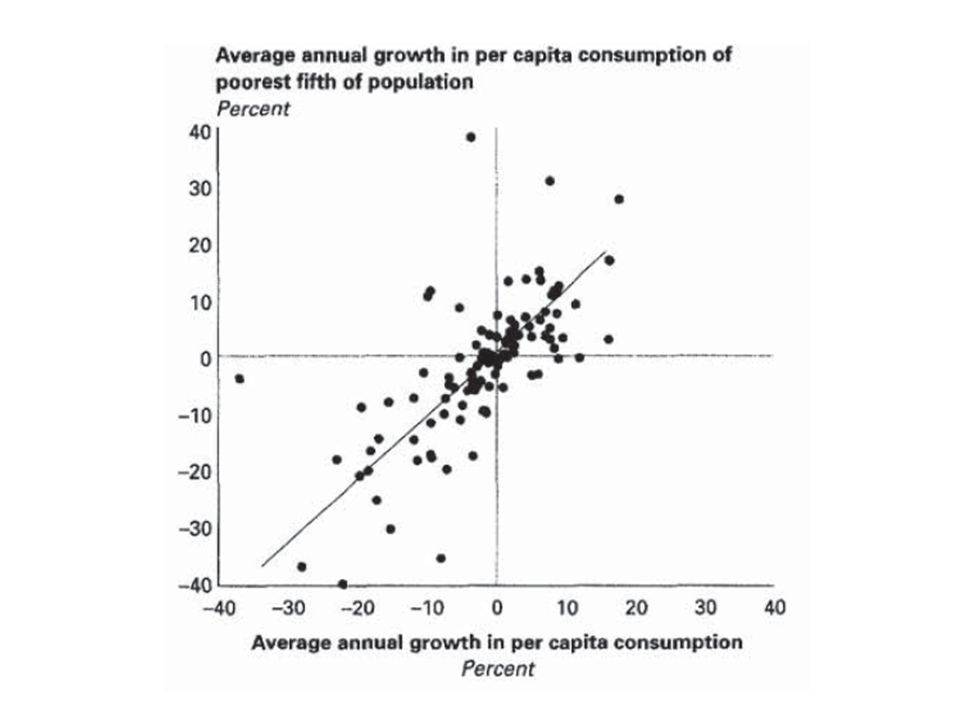
Growth and poverty Growth in per-capita GDP can lead to reduced poverty if such growth is neutral or biased towards the poor; if growth is biased towards the rich (e.g., by raising the returns to high- skilled workers), then growth may actually increase poverty. World Bank studies show that growth has tended to be pro-poor, but that inequality shows no relationship to growth.

29
Banerjee, Abhijit and Esther Duflo, “The Economic Lives of the Poor,” Journal of Economic Perspectives 21:1 (2007), 141-168.
,")
30
Banerjee and Duflo (2007) How do the poor spend their money? How do the poor earn their money?
 How do the poor spend their money How do the poor earn their money")
31
Banerjee and Duflo (2007)
")
33
How do markets affect the poor? How does infrastructure affect the poor?

34
Ravallion, Martin, “A Comparative Perspective on Poverty Reduction in Brazil, China, and India,” World Bank Research Observer 26:1 (2010), 71-104.
,")
40
Milanovic, Branko, “Half a World: Regional Inequality in Five Great Federations,” Journal of the Asia Pacific Economy, 10:4 (2005), 408- 445.
,")
52
Kanbur, Ravi and Xiaobo Zhang, “Fifty Years of Regional Inequality in China: A Journey through Revolution, Reform and Openness,” Review of Development Economics 9:1 (2005), 87–106.
, 87–106.")
53
Kanbur and Zhang (2005) Theil T: Theil L: The Theil T index is more sensitive to changes in the upper tail of the distribution; the Theil L is more sensitive to changes in the lower tail.
 Theil T: Theil L: The Theil T index is more sensitive to changes in the upper tail of the distribution; the Theil L is more sensitive to changes in the lower tail.")
60
Hypothesis 1: “Decentralization affects regional inequality during the economic transition from a planned economy to a market economy.”

61
Hypothesis 2: “The heavy-industry development strategy was a major contributing factor to the large rural-urban divide and to overall inequality.”

62
Hypothesis 3: “Greater openness is associated with greater regional inequality in a spatially large country such as China.”

63
Kanbur and Zhang (2005)
")
67
Topalova, Petia, “India: Is the Rising Tide Lifting All Boats?,” IMF Working Paper WP/08/54 (2008).
.")
Similar presentations


 Michael.>")


