Download presentation
Presentation is loading. Please wait.

1
Genome Assembly Preliminary Results
Jeri Dilts Suzanna Kim Hema Nagrajan Deepak Purushotham Ambily Sivadas Amit Rupani Leo Wu 02/01/2012

2
Outline Data Pre-Processing Error Correction Assembler results Results
Formats and Conversion PRINSEQ Data statistics Error Correction CoRAL Assembler results Newbler 2.6 MIRA3 ABySS Velvet PCAP-454 Results Lab Exercise

3
Outline Data Pre-Processing Error Correction Assembler results Results
Formats and Conversion PRINSEQ Data statistics Error Correction CoRAL Assembler results Newbler 2.6 MIRA3 ABySS Velvet PCAP-454 Results Lab Exercise

4
What are sff files? Sff files are Roche's "Standard Flowgram Format" files, containing the sequence data produced from a 454 run. The sff files contains a Manifest header at the start describing the contents and flow intensity signal values for each base in each read. They are in binary format, so need to be converted to text format, such as a fastq/fasta file using sff2fastq , ssf_extract , sffinfo programs. The Sequence Read Archive request that these .sff files be uploaded, to obtain accession number for publications.

5
Fastq = Fasta + Quality No standard file extension: but .fq .fastq and .txt are commonly used • 4 lines per sequence • Line 1 begins with character, a sequence ID, and an optional description • Line 2 is the sequence letters GATTTGGGGTTCAAAGCAGTATCGATCAAATAGTAA • Line 3 begins with the + character, followed by the same sequence ID, and another optional description +Optional Description • Line 4 encodes quality values for the sequence letters in line 2 !''*((((***+))%%%++(%%%%).1***+*''))**55CCF>>>>>
)%%%++(%%%%).1***+* ))**55CCF>>>>>")
6
File Tools There are a large number of sff tool converters available now. We list a few here: sffinfo --> extract fasta, quality and flowgrams as text from .sff files. sffinfo -seq Axolotl_reads.sff > Axolotl.fna sffinfo -qual Axolotl_reads.sff > Axolotl.qual sff2fastq --> extracts read information from sff and outputs the sequence and quality scores in fastq sff2fastq -o Axolotl.fastq Axolotl_reads.sff sfffile --> join sff files; extract part of sff file by MIDs, read names or random reads; or trim reads in user-defined ways.

7
Quality Control WHY ? Saves time, effort and money KEY CONCERNS
Saves time, effort and money KEY CONCERNS Number and Length of sequences Base qualities Ambiguous bases Sequence duplications

8
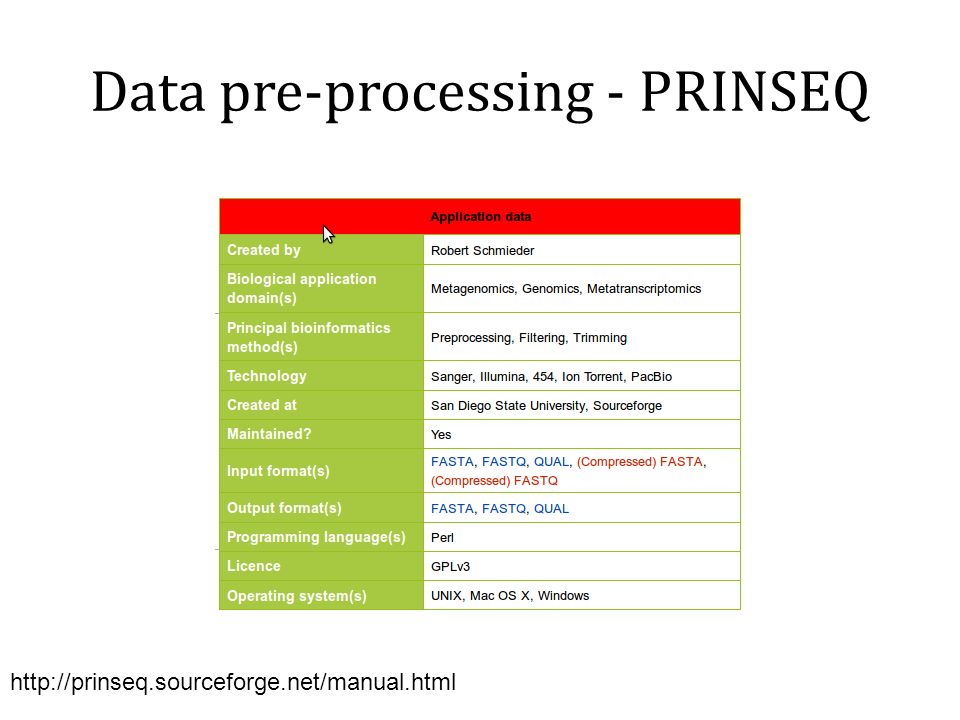
Data pre-processing - PRINSEQ
9
Generating trimmed reads in fastq
$ prinseq-lite.pl -fastq M19107.fastq -out_good stdout -log M19107.txt -trim_qual_left 20 -trim_qual_right 20 -trim_tail_left 5 -trim_tail_right 5 -trim_ns_left 2 -trim_ns_right 2 -min_len 65 -min_qual_mean 20 -ns_max_n 4 | gzip -9 > M19107.fastq.gz Read a fastq file containing quality data and write data passing all Filters to standard out (terminal). The trimmed sequences are gzipped to a new file. -fastq:Fastq file containing sequence and quality data. -out_good stdout: This will write all data passing the filter to the stdout (terminal) -log: logfile to keep track of parameters, error etc. -min_len: Filter out sequences lower than this length. -ns_max_n: Filter sequences with more than the specified Ns. We tried with 2/3 and 1. -min_gc: Filter sequences with GC content less than min_gc. -max_gc: Filter sequences with GC content greater than max_gc -min_qual_mean: Filter sequences with mean quality scores below the specified level. Most published thresholds varied between 15 and 25. We used 20.
. The trimmed sequences are gzipped to a new file. -fastq:Fastq file containing sequence and quality data. -out_good stdout: This will write all data passing the filter to the stdout (terminal) -log: logfile to keep track of parameters, error etc. -min_len: Filter out sequences lower than this length. -ns_max_n: Filter sequences with more than the specified Ns. We tried with 2/3 and 1. -min_gc: Filter sequences with GC content less than min_gc. -max_gc: Filter sequences with GC content greater than max_gc. -min_qual_mean: Filter sequences with mean quality scores below the specified level. Most published thresholds varied between 15 and 25. We used 20.")
10
Generating graphs report from trimmed reads
prinseq-lite.pl -fastq M19107_filtered.fastq -graph_data M19107_filtered.gd -verbose -out_good null -out_bad null Reads a filtered fastq file and graph data file to generate graphs showing the distribution of length, base quality, GC Content, Occurance of N, Poly A/T Tails, Sequence Duplication, Sequence Complexity and Dinucleotide odds ratios. -fastq:Fastq file containing sequence and quality data. -graph_data: File containing graph data to generate graphs report -verbose: prints status and info messages during processing -out_bad null & -out_good null: This will NOT create any output file other than the graphics file.

11
Length Distribution

12
Base Quality Distribution

13
Mean Base Quality Scores

14
Outline Data Pre-Processing Error Correction Assembler results Results
Formats and Conversion PRINSEQ Data statistics Error Correction CoRAL Assembler results Newbler 2.6 MIRA3 ABySS Velvet PCAP-454 Results Lab Exercise

15
Error Correction Motivation
Sequencing errors pose the biggest challenge Computational efficiency of assemblers improves Lot of redundant data - take advantage of it Ensures high data usage in assembly

16
Coral v1.3 CORrection with ALignment
Corrects sequencing errors in short-read high throughput data Key strategy - Multiple Alignment using redundant read data Similar reads are all updated according to the alignment based on scoring of quality reads --score is based on number of reads that align at a position/ number of total reads at position

17
Coral Multiple Alignment

18
Coral Command Line coral -f[q, s] Input File -o Output File
accepts input files FASTA, FASTQ, and Solexa FASTA -k (length of k-mer) >= log4 (length of genome), default 21 -e (maximum expected error rate), default 0.07 -454 (sets optimal settings in gap penalty, mismatch penalty, and reward for matching
![Coral Command Line coral -f[q, s] Input File -o Output File](http://slideplayer.com/slide/7511553/24/images/18/Coral+Command+Line+coral+-f%5Bq%2C+s%5D+Input+File+-o+Output+File.jpg "accepts input files FASTA, FASTQ, and Solexa FASTA. -k (length of k-mer) >= log4 (length of genome), default 21. -e (maximum expected error rate), default (sets optimal settings in gap penalty, mismatch penalty, and reward for matching.")
19
Outline Data Pre-Processing Error Correction Assembler results Results
Formats and Conversion PRINSEQ Data statistics Error Correction CoRAL Assembler results Newbler 2.6 MIRA3 ABySS Velvet PCAP-454 Results Lab Exercise

20
bler Algorithm How does it work??

21
What is newbler?? Roche's “GS De Novo Assembler” (where “GS” = “Genome Sequencer”) Designed to assemble reads from the Roche 454 sequencer. Accepts: 454 Flx Standard reads, and 454 Titanium reads. Single and paired-end reads. Optionally can include Sanger reads. Runs on Linux, and has 32 bit and 64 bit versions. Has Command-line and Java-based GUI interface.

22
OLC algorithm -A quick recap
Overlap Layout Consensus (OLC) is a method used for de novo genome assemblies. OLC requires three steps: 1) overlap, 2) layout, and 3) consensus. The overlap stage computes and builds the basic assembly graph. The layout stage compresses the graph, and the consensus stage determines the genome sequence based on the graph generated in the previous two steps.
 is a method used for de novo genome assemblies. OLC requires three steps: 1) overlap, 2) layout, and 3) consensus. The overlap stage computes and builds the basic assembly graph. The layout stage compresses the graph, and the consensus stage determines the genome sequence based on the graph generated in the previous two steps.")
23
Overlap In the overlap step, the sequence of each read is compared to that of every other read, in both the forward and reverse complement orientations. As such, the overlap computation step is a very time intensive step – especially if the set of reads is very large.

24
Overlap criteria The OLC overlap criteria result in two types of overlaps: true overlaps (Figure 1a) and repeat overlaps (Figure 1b). For example, in Figure 1b, an overlap occurs between reads S and T, due to the orange repeat section, not because reads S and T truly overlap one locus in the genome, as in Figure 1a.

25
How does it go? Although we would like exclude repeat overlaps, we must construct the assembly graph using both types of overlaps, as true and repeat overlaps cannot be distinguished individually. In the assembly graph, the nodes represent actual reads, and edges represent OLC-quality overlaps between these reads (Figure 2). Thus, the genome assembly becomes equivalent to finding a path through the graph that visits each node exactly once (i.e., a Hamiltonian path).
. Thus, the genome assembly becomes equivalent to finding a path through the graph that visits each node exactly once (i.e., a Hamiltonian path).")
27
Layout Finding a path through the OLC graph is not a trivial task. Imagine you have a graph of millions of nodes and edges. Identifying a path that visits every node exactly once would be extremely difficult, even for a powerful computer. In order to find such a path, you would have to start at some node and proceed to other connected nodes. If you find that you visited a node more than once, you must backtrack, adjust the path, and test this new path. So the larger the graph is, the more options you must test.

28
Contigs In order to decrease the size of the graph, the OLC assembly graph is simplified in the layout stage, where segments of the assembly graph are compressed into contigs, which are collections of reads that clearly overlap each other and refer to the same overall sequence. Thus in the overlap graph, a contig would be a subgraph, or a group of nodes, with many connections among each other, as they all overlap with each other and refer to the same sequence

29
Graphical representation of a unique contig

30
Unique and repeat contigs
There are two classes of contigs, unique contigs and repeat contigs. Unique contigs are composed of reads that can be unambiguously assembled. Generally, these reads only overlap in one way and do not contain repeats within the genome. Essentially, unique contigs are contigs not flagged as repeat contigs.

31
Contig Assignment For example, the R1 + R2 repeat contig is connected to more contigs and has more read coverage than the other unique contigs, X, Y and Z. Both the X and Z unique contigs are connected to the prefix of the R1 + R2 repeat contig as they both have overlaps to this sequence. Similarly, unique contigs Y and Z have overlap with the suffix of the R1 + R2 repeat contig.

32
Contig assignment Repeat contigs are contigs with an abnormally high read coverage or connected to an abnormally large number of other contigs. Additionally, this repeat contig is different from other contigs because it has such high coverage. The high coverage of repeat contigs allows algorithms to identify them through statistics that compare the coverage of each contig. Contigs with too much coverage are most likely due to over-collapsing of repeats and are flagged as repeat contigs, to be used later in the layout stage

33
Consensus In the final stage of the OLC method, we derive the consensus sequence. At this point, the assembly graph has been reduced to large scaffolds – ideally a single scaffold. A single scaffold would be represented by one node that resulted from collapsing all previous nodes. Starting from the left most read of each scaffold, the OLC algorithm computes the consensus of all of the reads composing each scaffold.

35
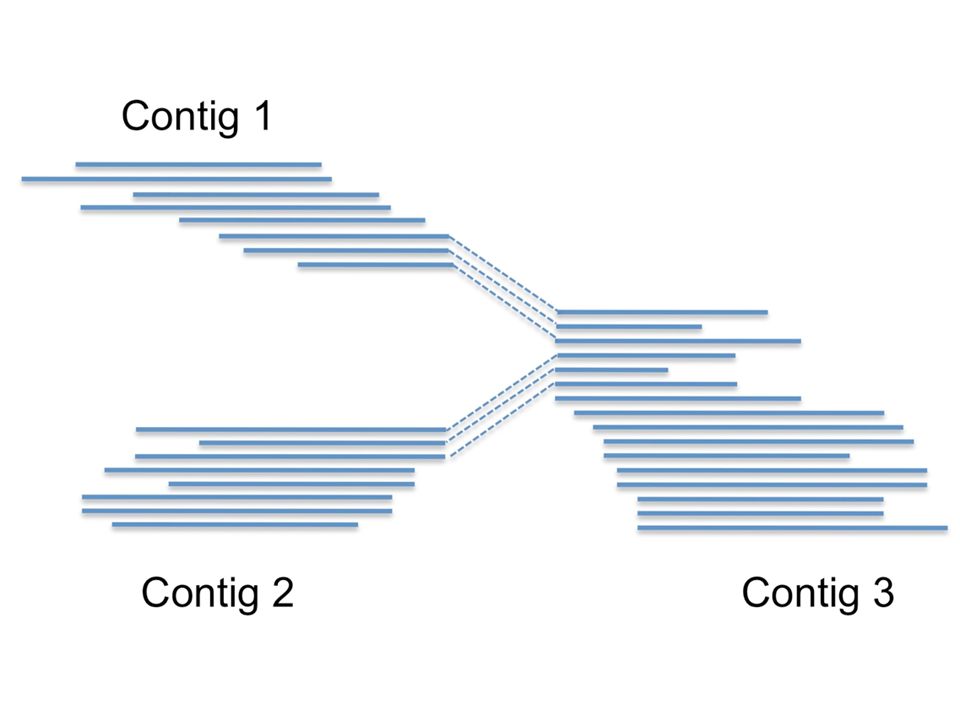
Why would reads go from contig 1 to contig 3, as well as from contig 2 to contig 3? If the sequence from contig 3 is repeated in the genome, the reads coming from these repeats are very similar and collapse into a single contig. At the beginning and end of this contig there will be reads extending into the respective neighboring, single copy genomic regions. Essentially, here is the problem with assembly: repeats cause a complicated contig graph structure. Newbler here reads in all information from the flowgrams (sff file, these include the light intensity during sequencing for each read) and calculates for each position in the contig the consensus signal. Also, a consensus quality score is calculated for each base. Several output files are written during this phase.
 and calculates for each position in the contig the consensus signal. Also, a consensus quality score is calculated for each base. Several output files are written during this phase.")
36
Repeat detection Repeat resolution Identifying Unique DNA Stretches
Unique DNA unitig Repetitive DNA unitig Arrival Intervals Discriminator Statistic is log-odds ratio of probability unitig is unique DNA versus 2-copy DNA. -10 +10 Repeat detection pre-assembly: find fragments that belong to repeats statistically (most existing assemblers) repeat database (RepeatMasker) during assembly: detect "tangles" indicative of repeats (Pevzner, Tang, Waterman 2001) post-assembly: find repetitive regions and potential mis-assemblies. Reputer, RepeatMasker "unhappy" mate-pairs (too close, too far, mis-oriented) Repeat resolution find DNA fragments belonging to the repeat determine correct tiling across the repeat Significant deviations from average coverage flagged as repeats. - frequent k-mers are ignored - “arrival” rate of reads in contigs compared with theoretical value (e.g., 800 bp reads & 8x coverage - reads "arrive" every 100 bp) Dist. For Unique Dist. For Repetitive Definitely Repetitive Don’t Know Definitely Unique
 repeat database (RepeatMasker) during assembly: detect tangles indicative of repeats (Pevzner, Tang, Waterman 2001) post-assembly: find repetitive regions and potential mis-assemblies. Reputer, RepeatMasker. unhappy mate-pairs (too close, too far, mis-oriented) Repeat resolution. find DNA fragments belonging to the repeat. determine correct tiling across the repeat. Significant deviations from average coverage flagged as repeats. - frequent k-mers are ignored. - arrival rate of reads in contigs compared with theoretical value. (e.g., 800 bp reads & 8x coverage - reads arrive every 100 bp) Dist. For Unique. Dist. For Repetitive. Definitely Repetitive. Don’t Know. Definitely Unique.")
37
How to run Newbler? COMMAND LINE INTERFACE
The simplest command to run Newbler is: runAssembly [options] reads.sff • Which creates an the assembly in an output directory called: P_yyyy_mm_dd_hh_min_sec_runAssembly where P_ = Project, followed by date and time There are a large number of optional parameters available for controlling and refining the assembly

38
Lets look at a Newbler run..
The first thing you’ll see is a message stating that the assembly computation started, and which version of newbler you used. Then, you’ll see messages for each input file saying Indexing XXXXXXX.sff…, and a counter. During indexing, newbler scans the input file, performs some checks and trims the reads (sometimes more than the base-calling software already did). The first phase of assembly is finding overlap between reads. Newbler splits this phase into one for long reads (this goes very fast) and shorter reads (can take quite some time). As aligning all reads against each other would take too long time, newbler (and many other programs) actually make seeds, 16-mers of each read, where each seed starts 12 bases upstream of the previous one. Basically, checkpointing means writing the intermediate results to disc, so that in the case of a crash, you could continue the assembly from the last ‘checkpoint’.
. The first phase of assembly is finding overlap between reads. Newbler splits this phase into one for long reads (this goes very fast) and shorter reads (can take quite some time). As aligning all reads against each other would take too long time, newbler (and many other programs) actually make seeds, 16-mers of each read, where each seed starts 12 bases upstream of the previous one. Basically, checkpointing means writing the intermediate results to disc, so that in the case of a crash, you could continue the assembly from the last ‘checkpoint’.")
39
Overlap between two sequences
overlap (19 bases) overhang (6 bases) …AGCCTAGACCTACAGGATGCGCGGACACGTAGCCAGGAC CAGTACTTGGATGCGCTGACACGTAGCTTATCCGGT… overhang % identity = 18/19 % = 94.7% overlap - region of similarity between regions overhang - un-aligned ends of the sequences The assembler screens merges based on: length of overlap % identity in overlap region maximum overhang size. When two different reads have identical seeds the program tries to extend the overlap between the reads until the minimum overlap (default 40 bp) with the minimum alignment percentage default 90%) has been reached.
 overhang (6 bases) …AGCCTAGACCTACAGGATGCGCGGACACGTAGCCAGGAC. CAGTACTTGGATGCGCTGACACGTAGCTTATCCGGT… overhang. % identity = 18/19 % = 94.7% overlap - region of similarity between regions. overhang - un-aligned ends of the sequences. The assembler screens merges based on: length of overlap. % identity in overlap region. maximum overhang size. When two different reads have identical seeds the program tries to extend the overlap between the reads until the minimum overlap (default 40 bp) with the minimum alignment percentage default 90%) has been reached.")
40
Newbler Command Line runAssembly [options] inputFile
runMapping [options] referenceGenome inputFile accepts input files -- FASTA, FASTQ, .SFF -o Name output directory -qo Generate quick output for assembly (can decrease accuracy)
![Newbler Command Line runAssembly [options] inputFile](http://slideplayer.com/slide/7511553/24/images/40/Newbler+Command+Line+runAssembly+%5Boptions%5D+inputFile.jpg "runMapping [options] referenceGenome inputFile. accepts input files -- FASTA, FASTQ, .SFF. -o Name output directory. -qo Generate quick output for assembly (can decrease accuracy)")
41
M Newbler Results

42
M Newbler Results

43
MIRA3 Multifunctional Inertial Reference Assembly v3.4.0
Started in 1997 as a PhD project at the German Cancer Research Center by Bastien Chevreux and in 2007 became open source MIRA 3 is able to perform true hybrid de-novo assemblies using reads gathered through Sanger, 454, Solexa, IonTorrent or PacBio sequencing technologies. can also perform regular (non-hybrid) de-novo assemblies using 454 data Overlap layout consensus algorithm
 de-novo assemblies using 454 data. Overlap layout consensus algorithm. title=Main_Page.")
44
MIRA3:Command Line Arguments (1/2) "Extracting SFF"
Convert the SFFs named M19107.sff, M19107.sff and M19107.sff The parameters of sff_extract -Q extract to FASTQ -s give the FASTQ file a name we chose -x give the XML file with vector clipping information a name we chose

45
MIRA3:Command Line Arguments (2/2) "Begin Assembly"
Parameters --project (for naming your assembly project) --job (perhaps to change the quality of the assembly to 'draft') >& creates/outputs a file named log_assembly.txt to observe assembly progress
 --job (perhaps to change the quality of the assembly to draft ) >& creates/outputs a file named log_assembly.txt to observe assembly progress")
46
MIRA3 Data Manipulation Integrity
Our objective is to produce the most accurate representation of a genome. When software tools produce better results, it doesn't necessarily indicate that the genome's representation is more accurate. (and vice versa) This makes it tricky to determine the proper tools to use. Could be detrimental to scientific integrity. Take precautions.
 This makes it tricky to determine the proper tools to use. Could be detrimental to scientific integrity. Take precautions.")
47
MIRA3 Data Analysis Data Quality (ideally) Increases
 Increases")
48
MIRA3 Further Work..... Need to look at more assembly parameters in reference manual Finish scripts that calculate Min. Contig Length and Avg. Contig Length M bit error Finish running MIRA3 on all genomes

49
ABySS ABySS stands for Assembly By Short Sequences.
It is a De Novo sequence assembler designed for short reads and large genomes. Single Processor version: Genomes up to 100Mbp in size Parallel version: capable of assembling mammalian sized genomes Capable of performing assemblies for both single end reads and paired end reads The output of the ABySS is set of contigs assembled from the short reads

50
ABySS

51
ABySS commands for assembly
ABYSS -K[K-mer value] input.fastq -o output.fastq perform operation for multiple k-mer value in loop for k in {20..40}; do ABYSS -k$k reads.fa -o contigs-k$k.fa done

52
ABySS output file ABySS output file consist of contigs generated by the assembly Each contig in the output file consist of 2 lines Line 1 >n iii jjj where n=contig id iii=contig length in nucleotides jjj=absolute coverage value Line 2 AAAAACTAATTTCTGAAAT (contig sequence)
")
53
ABySS output

54
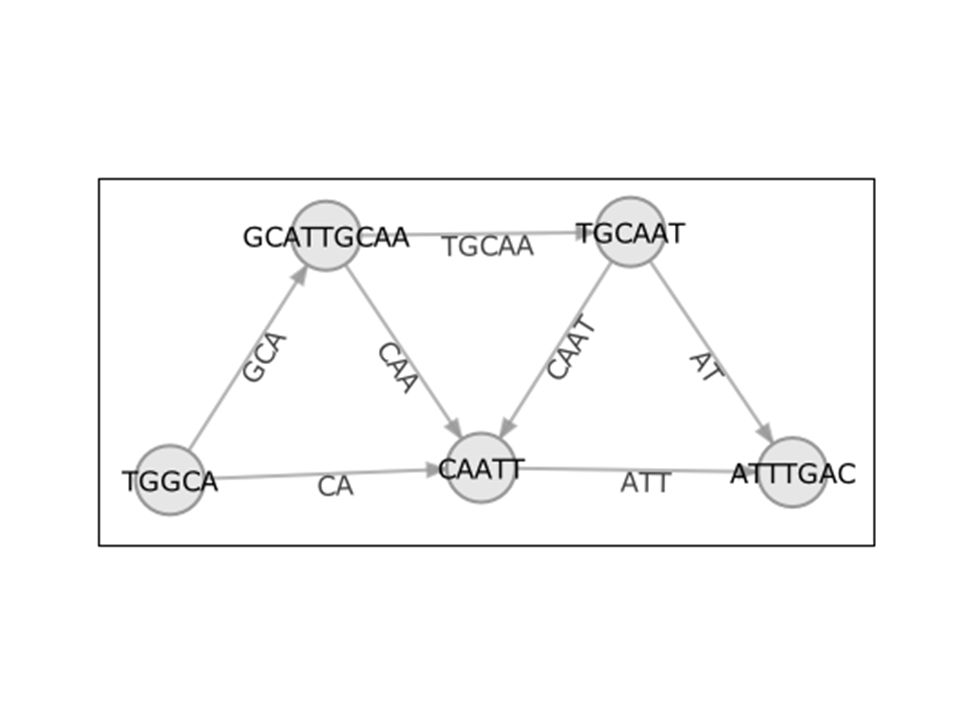
VELVET de Bruijn graph - based assembler
best for high coverage very short read data sets leverages paired end information really well

55
Commands velveth - performs hashing default k-mer value - 31
specify input format (-fastq), read-type (-long)
, read-type (-long)")
56
Commands velvetg - generates the graph and forms the assembly
exp_cov (Expected coverage) - auto
 - auto")
57
Results

58
PCAP-454 Beta version (not yet released)
Overlap Layout Consensus assembler Designed for 454 paired-end data Computationally efficient

59
PCAP-454 commands Input files: Fasta and Qual files separately zipped
Fofn file: Specify the name of the input file Run the automated script $./autopcap fofn > auto.log

60
PCAP-454 Results M19107 Metrics Raw data No. of Contigs 589 N50 6574
Max Contig length 20652

61
Results Summary

62
Work Cited M19107 original reads M19107 filtered reads Quality Control with Prinseq prinseq.sourceforge.net/Quality_control_with_PRINSEQ.pdf (

Similar presentations


 Unit 1: Mapper Unit 2: Aggregator and peak finder Solexa MNase Reads.>")


, pp. 149-159, 2004.>")
