Download presentation
Presentation is loading. Please wait.

1
Cycle survival kit II Working party members Philip Archer-Lock Ian Hilder Stuart Brown Steven Fisher David Simmons Richard Doman Kevin Wenzel (Chairman) The Actuarial Profession ▀ making financial sense of the future
 The Actuarial Profession ▀ making financial sense of the future")
2
Recap on work from last year Update of some results Report on further investigations Agenda

3
Recap What do we mean by the reserving cycle?

4
Recap

5
Conclusions we came to: There is a reserving cycle in the UK Apparently correlated with the underwriting cycle Actuarial methods can generate cycles Rating indices understate size of the underwriting cycle

6
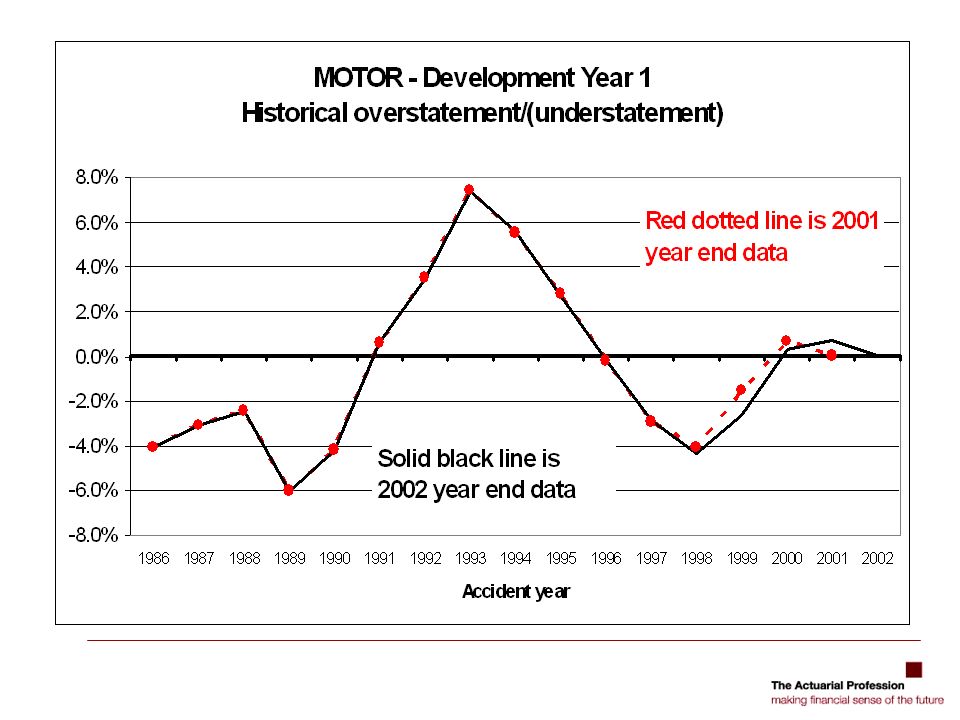
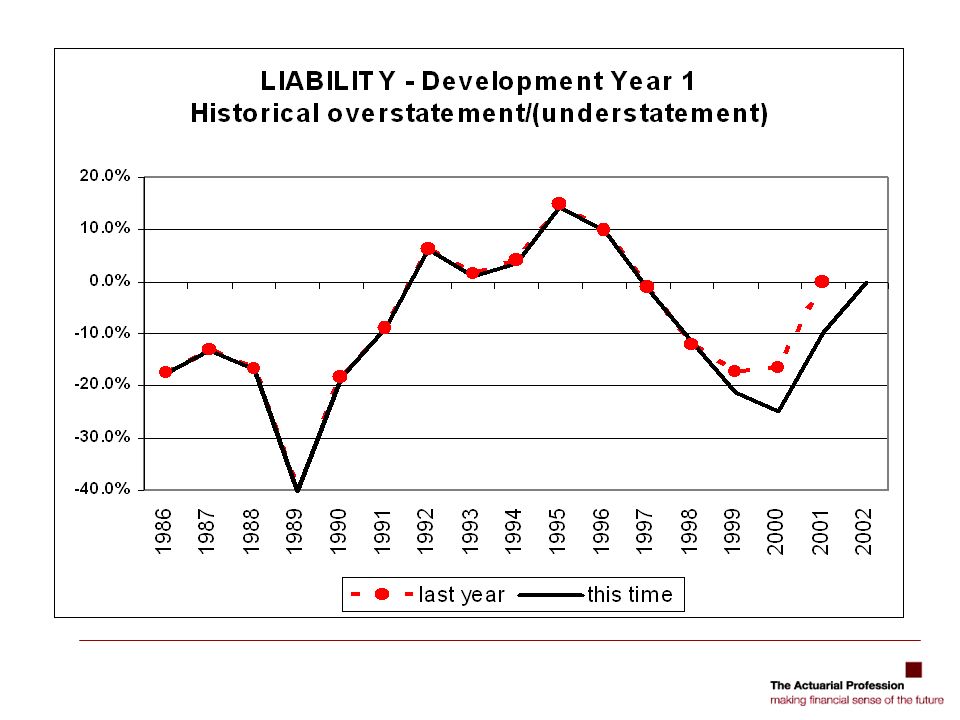
Update This year focus solely on Motor & Liability FSA data updated to 2002 year end Data provided by Standard & Poor’s Systhesis

9
Further investigations How long for the cycle to flatten? Impact on total reserves? Is it a few isolated companies? Impact of claims inflation? Further investigations of the chain ladder.

10
How long for the cycle to flatten?

11
1

12
2

13
3

14
4

15
5

16
6

17
7

18
8

19
9

20
How long for the cycle to flatten It takes several years Some years get worse before getting better.

21
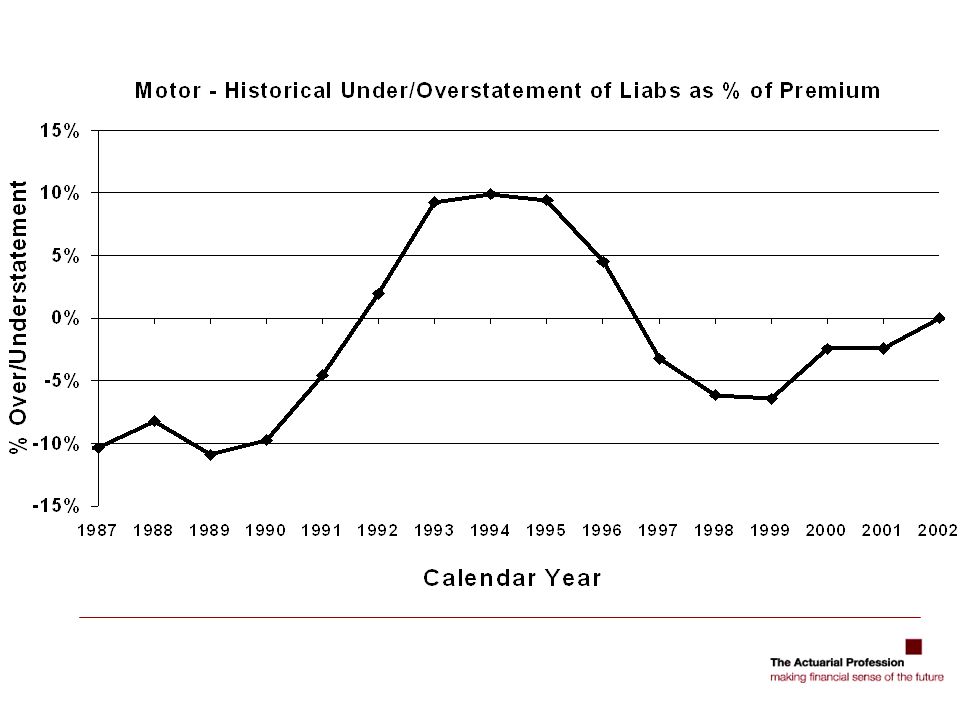
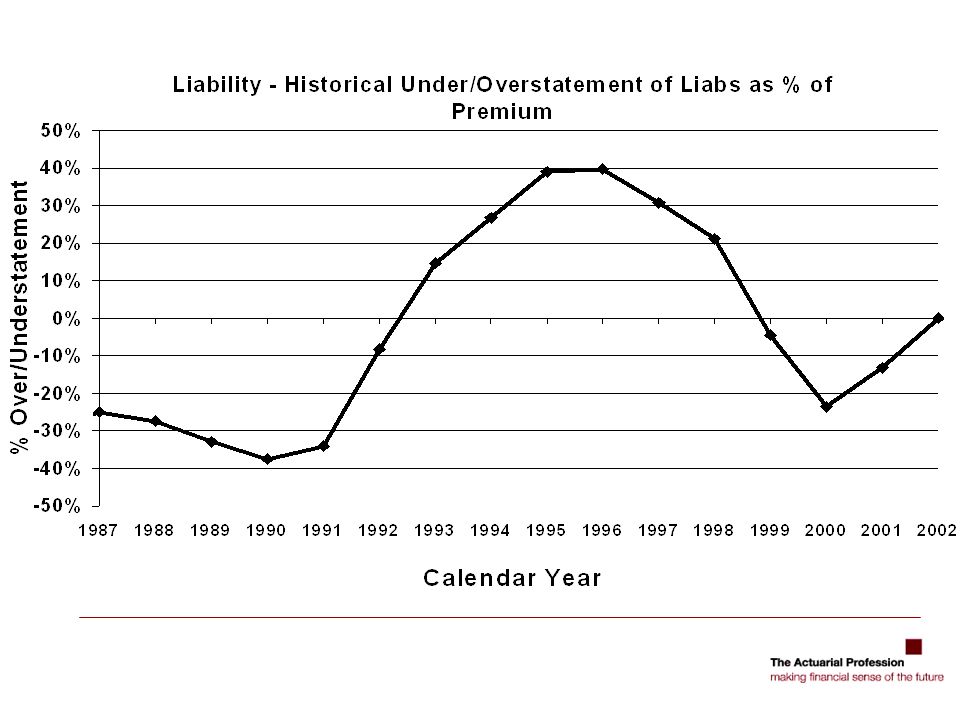
Impact on total reserves?

22
Impact on total reserves Previous graphs shown by origin years Impact on a company is mixture of all past origin years: –some overstated –some understated

25
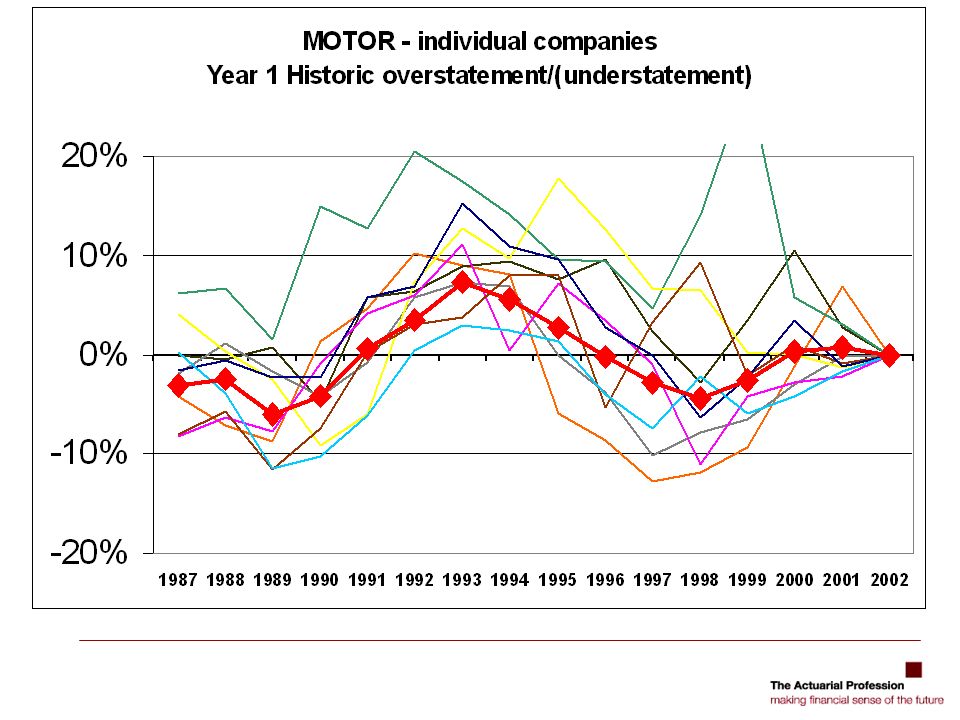
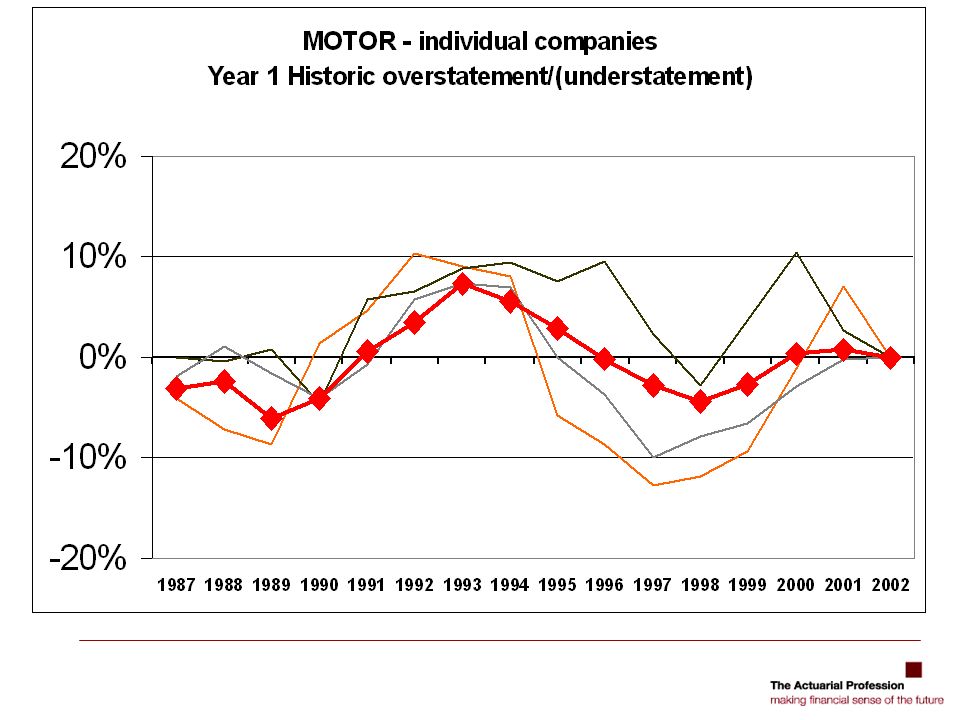
Isolated companies?

30
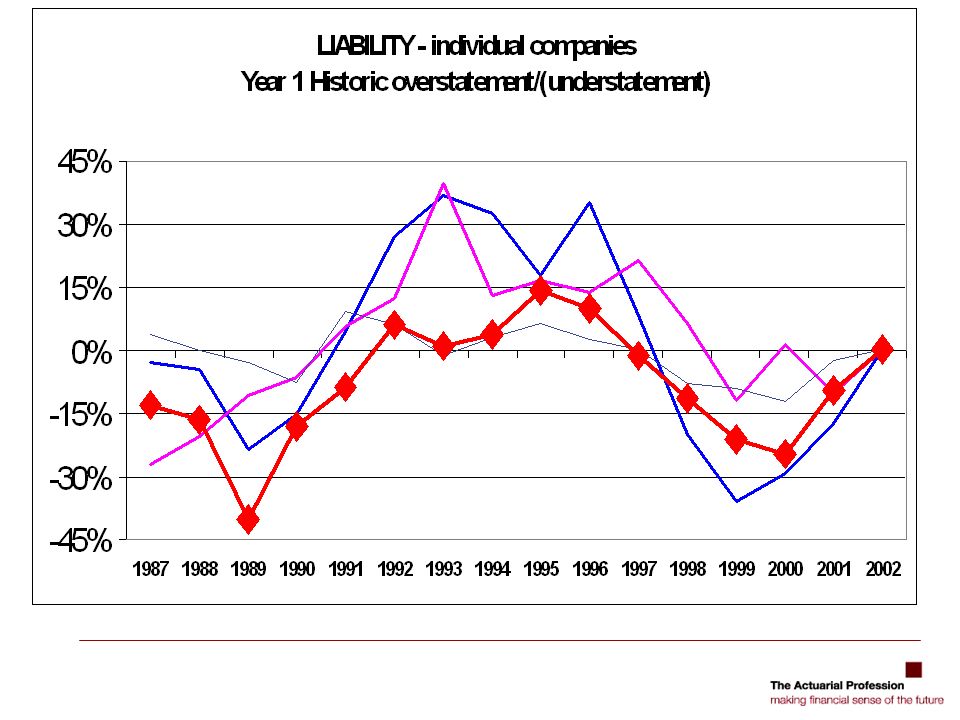
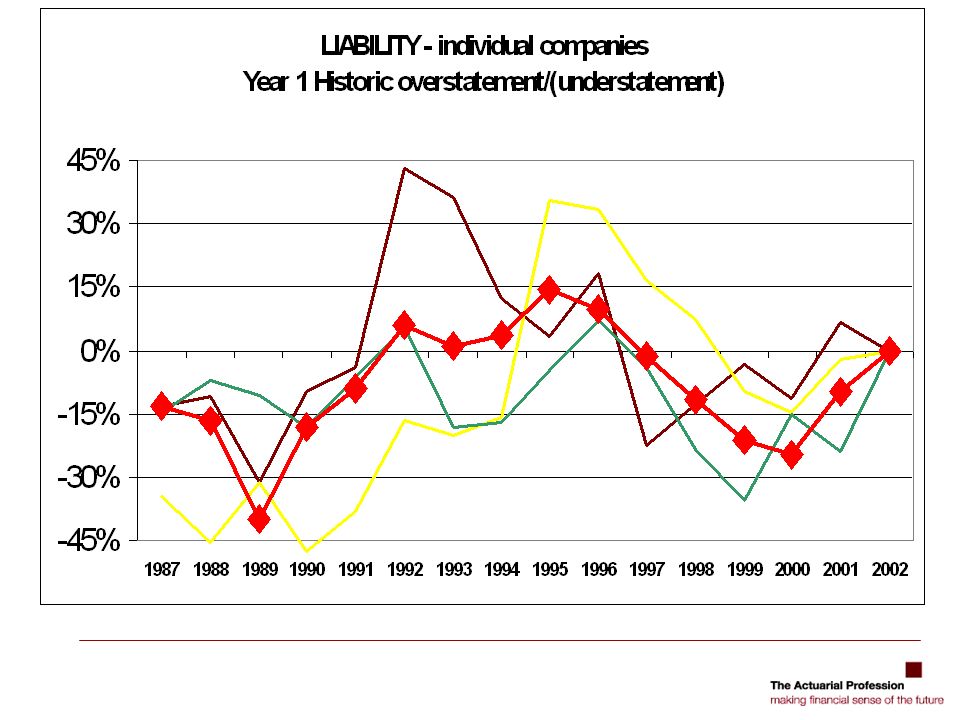
So not an isolated company on motor, –what about other lines of business?

35
Impact of claims inflation?

36
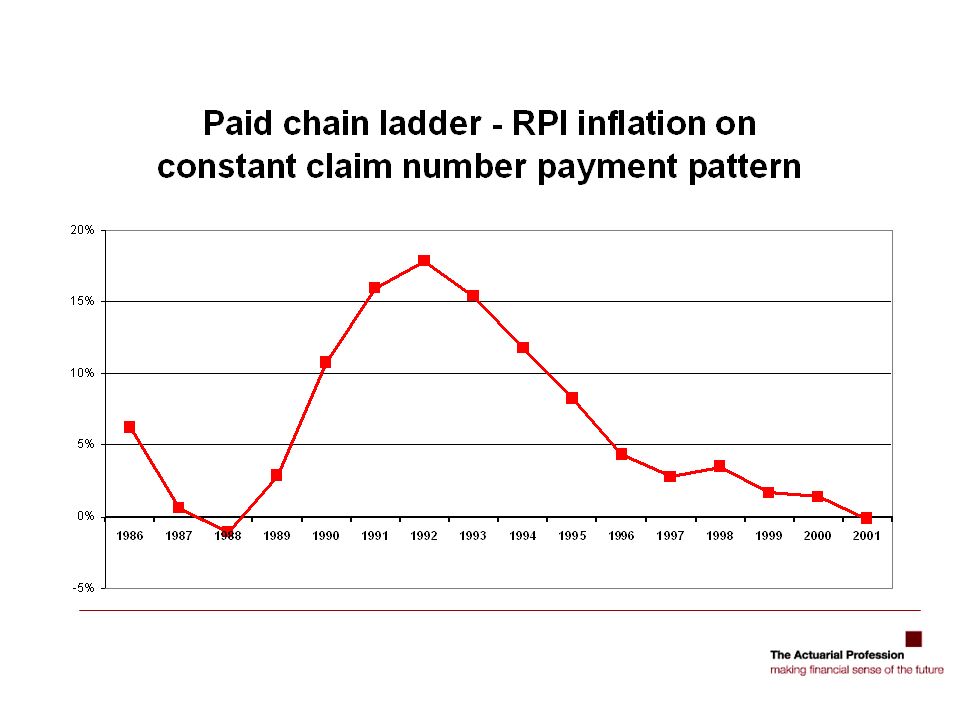
Claims inflation Is claims inflation driving the cycle? Implicit chain ladder assumption of future inflation being an average of past inflation Try hypothetical data with RPI inflation

38
Claims inflation Changing levels of inflation affect the results of methods we use Not the sole cause of a cycle but could be a contributing factor ACPC or inflation adjusted methods?

39
Further investigation of the chain ladder

40
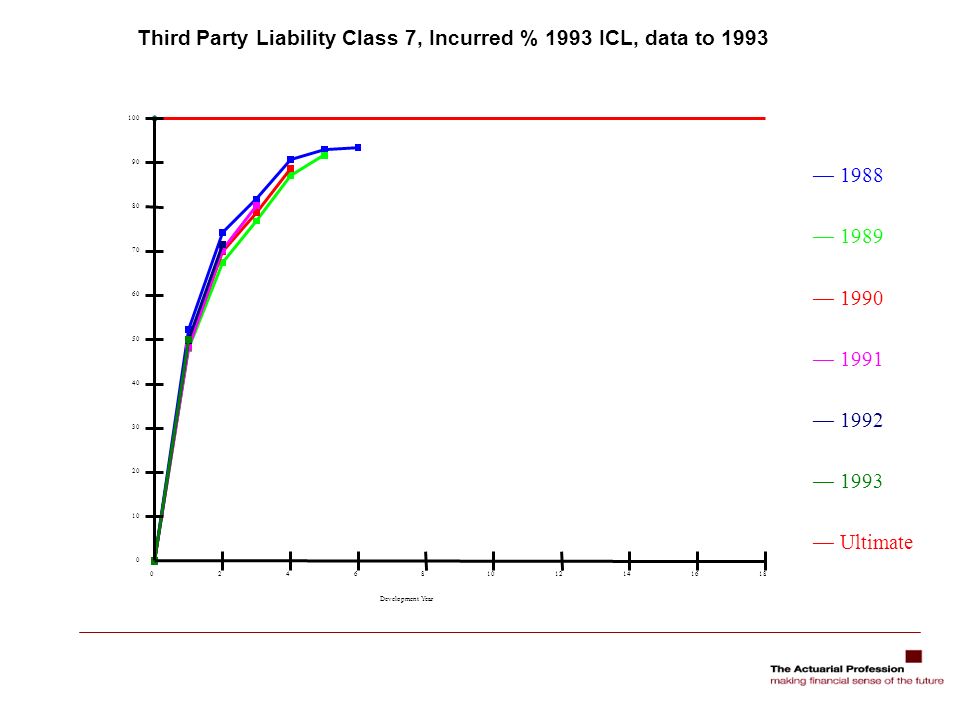
Further investigation of the Chain Ladder The chain ladder method reflected the cycle seen in the company figures –Did it under / over estimate for the same origin and development years as the companies? If so, why did it turn out to be wrong? Could we have seen the problem at the time?

45
Third Party Liability Class 7 Incurred % - 1993 ICL data to year 10 — 1988 — 1989 — 1990 — 1991 — 1992 — 1993 — Ultimate Development Year 0 20 40 60 80 100 120 0481216 2024

46
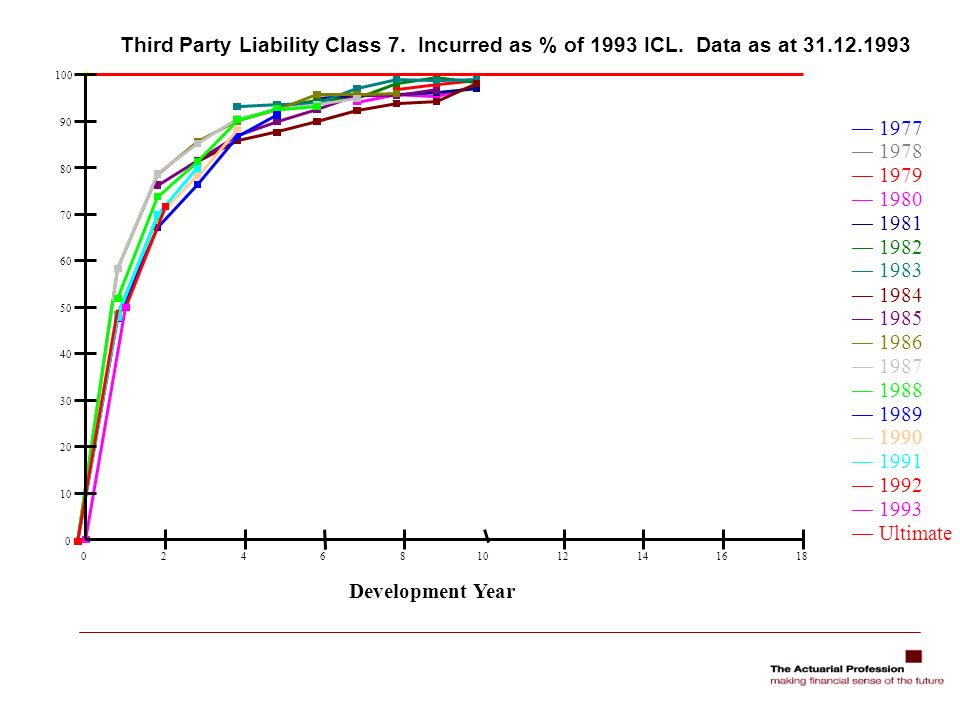
Third Party Liability Class 7 Incurred % - 2002 ICL data to 2002 — 1977 — 1978 — 1979 — 1980 — 1981 — 1982 — 1983 — 1984 — 1985 — 1986 — 1987 — 1988 — 1989 — 1990 — 1991 — 1992 — 1993 — 1994 — 1995 — 1996 — 1997 — 1998 — 1999 — 2000 — 2001 — 2002 — Ultimate Development Year 0 20 40 60 80 100 120 024681012

47
Third Party Liability Class 7. Incurred as % 2002 ICL. Data to 31.12.1993 — 1988 — 1989 — 1990 — 1991 — 1992 — 1993 — Ultimate Development Year 0 20 40 60 80 100 120 024681012141618

48
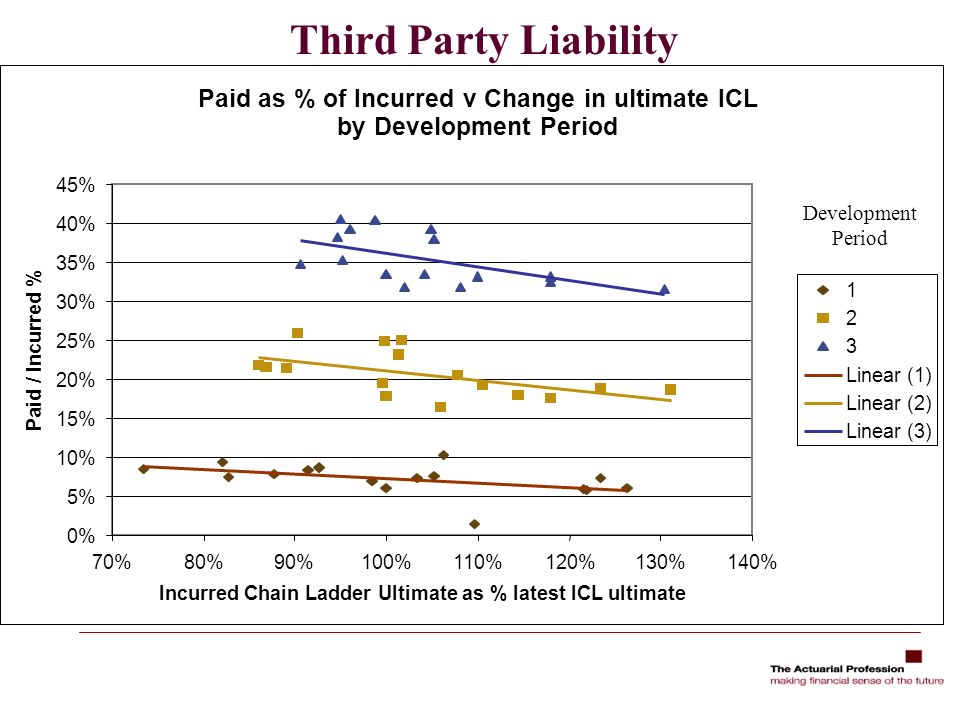
Could we have seen the problem? The problem was a change in (future) development pattern. Are there differences in the past patterns that could have predicted this? One possible diagnostic was to consider paid/incurred %

49
Paid as % of Incurred v Change in ultimate ICL by Development Period 0% 10% 20% 30% 40% 50% 60% 70% 80% 90% 100% 70%80%90%100%110%120%130%140% Incurred Chain Ladder Ultimate as % latest ICL ultimate Paid / Incurred % 1 2 3 4 5 6 7 8 9 10 Development Period Third Party Liability

51
Motor

52
Further investigations of the chain ladder The pattern changing for groups of years is causing this chain ladder cycle Random noise can make paid to incurred ratios a weak diagnostic

53
Overall Conclusions There is a UK reserving cycle It lasts for several years Applies to individual origin years and aggregate reserves It is exhibited consistently over major companies in the market Changing claims inflation may be a cause At market level it is difficult to identify detailed causes

54
Challenges We don’t have a solution to the reserving cycle today Internal analysis of individual company data may help Onus is on individual actuaries to consider the issues raised Encourage actuaries to monitor the long term run off of their reserves – not just this time vs last time We hope GRIT will give consideration to some of these issues

Similar presentations