Download presentation
Presentation is loading. Please wait.

1
Please note: this presentation has not received Director’s approval and is subject to revision.

2
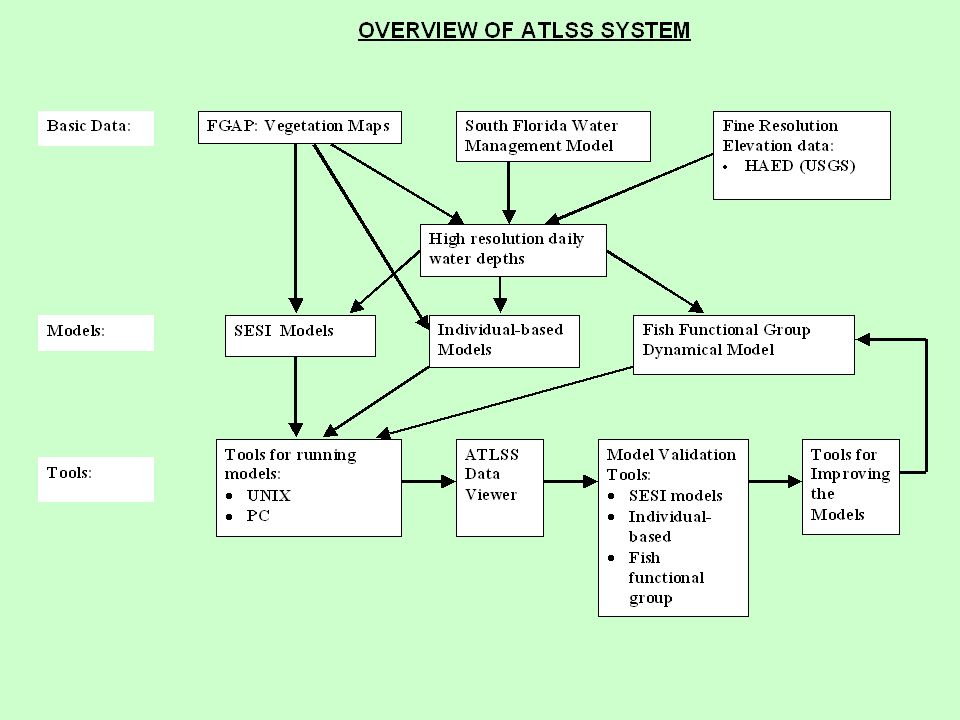
Overview of the Across Trophic Level System Simulation (ATLSS) Program: Model Development, Field Study Support, Testing, Documentation, and Application Don DeAngelis USGS, Florida Integrated Science Centers Website: atlss.org
 Program: Model Development, Field Study Support, Testing, Documentation, and Application Don DeAngelis USGS, Florida Integrated Science Centers Website: atlss.org")
3
Objectives of ATLSS ATLSS Program addresses CERP’s need for quantitative projections of effects of hydrologic scenarios on biota of the Greater Everglades. It can provide guidance to monitoring in an adaptive assessment framework and help provide a better understanding of the Everglades system. It does the above through creating a suite of models for selected Everglades biota, which can translate the hydrologic scenarios into effects on habitat and/or demographic variables of populations.

4
Organization of ATLSS ATLSS consists of numerous of projects at universities and agencies, and has included funded collaborators at (* means current): Florida International University Louisiana State University* University of Florida* University of Maryland University of Miami* University of Tennessee* University of Washington* University of West Florida* National Wetland Research Center (USGS)* South Florida Water Management District Institute for Bird Populations Everglades Research Group Netherlands Institute of Ecology*
: Florida International University Louisiana State University* University of Florida* University of Maryland University of Miami* University of Tennessee* University of Washington* University of West Florida* National Wetland Research Center (USGS)* South Florida Water Management District Institute for Bird Populations Everglades Research Group Netherlands Institute of Ecology*")
5
Funding of ATLSS There have been a number of funding agencies, including (* means current): National Park Service (Critical Ecosystems Science Initiative)* U. S. Geological Survey* U. S. Fish and Wildlife Service U. S. Army Corps of Engineers Environmental Protection Agency National Science Foundation (indirectly, through parallel high performance computing projects) * Oak Ridge National Laboratory University of Tennessee
 * Oak Ridge National Laboratory University of Tennessee.")
6
Larger Context of Everglades Modeling The ATLSS modeling approach is part of a much larger array of modeling approaches applied to biotic components of the Everglades restoration. Conceptual models Everglades Landscape Model SFWMD HSI Models … What is important is that all of these efforts are complementary and cooperative in spirit.

7
Products of ATLSS The main product of ATLSS are computer models, for use in support of scenario evaluation related to Everglades restoration. The most important of these are: High resolution hydrology and landscape vegetation modeling. Spatially explicit species index (SESI) models - similar to habitat suitability indices Spatially explicit demographic models of populations Additional products are empirical studies and analyses of data that both support modeling and increase understanding of the Everglades system.
 models - similar to habitat suitability indices Spatially explicit demographic models of populations Additional products are empirical studies and analyses of data that both support modeling and increase understanding of the Everglades system..")
8
Products: Modeling the Underlying Environment The landscape basis for ATLSS models is provided by high resolution (500 m) topography and hydrology and high resolution vegetation maps: Topography and hydrology In the past ATLSS models have refined SFWMM 2-mile output to 500 meters through an algorithm based on 30-m vegetation data, known hydroperiod/vegetation relationships, and conservation of water volume algorithms. Now USGS’s 400-m High Accuracy Elevation Data (HAED) is being used.
 is being used..")
9
Slough to prairie transition variation in water depths. Shows advantage of high resolution. Wet 0 Dry SFWMMHRH

10
Products: Modeling the Underlying Environment Vegetation and Vegetation Change The ATLSS use Florida GAP for vegetation at a 30-m scale of resolution, and aggregated to 500-m resolution. But vegetation is undergoing change as a result of changes in hydrology, nutrient loading, and changes in fire frequency. A data synthesis project on vegetative change has been completed (Paul Wetzel, two reports) and a modeling project to provide simple rule-based models of vegetative change has been completed and is being tested. Mangrove vegetation response to hydrology and nutrients has been modeled by Doyle and Twilley. The models are being used to examine the effects of changed hydrology.
 and a modeling project to provide simple rule-based models of vegetative change has been completed and is being tested. Mangrove vegetation response to hydrology and nutrients has been modeled by Doyle and Twilley. The models are being used to examine the effects of changed hydrology..")
11
Vegetative succession is complex

12
Products: ATLSS SESI Models What is a SESI model? Spatially Explicit – Each uses a GIS representation of the Greater Everglades region. Species Index – Each indicates the dynamic effect of hydrological conditions upon biota as represented by a 0.0 – 1.0 index. Models – Are developed and used within a modular framework. All models share the same software, input and output foundation.

13
ATLSS SESI Models What are they used for? Provide a simple means of estimating the relative impact of hydrological conditions upon biota. Encode the knowledge of field biologists. Provide a “stepping stone” to developing more complex demographic and individual-based models. Provide input into other models.

14
ATLSS SESI Models Sparrows prefer dry marl prairie with sufficient fraction of Muhlenbergia or similar grass. Exclude spatial cells < 15% Muhlenbergia/sparse Cladium. Exclude spatial cells having woody vegetation. Successful nesting cycle requires 45 days of dry conditions. Sparrows don’t start nest initiation until water depths are below a few centimeters and will abort nesting if water depth exceeds about 15 cm Keep track of water depths between January 1 and June 30. Start a nesting cycle if depth < 5 cm. Abort cycle if water levels increase > 15 cm. Up to 3 nesting cycles are possible. Observations and historical data Habitat/Model rules : Cape Sable Seaside Sparrow Sparrows will not nest in areas near trees or woody vegetation.

15
Cape Sable seaside sparrow SESI model output, 10-Mile Marl, 1988: Comparison of F2050 and D13R scenarios, with D13R - F2050 values in the center panel

16
Cape Sable seaside sparrow SESI model output, 10-Mile Marl, 1993: Comparison of F2050 and D13R scenarios, with D13R - F2050 values in the center panel

17
D13R F2050 USGS

18
Testing of the models can be done by comparing empirical data with model output: Singing Male Cape Sable Sparrow Observations - 1981, 1992, 1993

19
Cape Sable Sparrow SESI Values – Model Output USGS 198119921993

20
Products: SESI Models SESI models evaluate the landscape for breeding and foraging and include h abitat requirements (vegetation, etc.) and effects of landscape hydrology (water depths through year ): Cape sable seaside sparrow breeding potential index (Version 1.1) Snail kite breeding potential index (Version 1.1) Long-legged wading bird foraging condition index (Version 1.1) Short-legged wading bird foraging condition index (Version 1.1) White-tailed deer breeding potential index (Version 1.1) American alligator breeding potential index (Version 1.1) Everglades and slough crayfish (Version 1.1) Apple snail SESI model (Version 1.1)
 and effects of landscape hydrology (water depths through year ): Cape sable seaside sparrow breeding potential index (Version 1.1) Snail kite breeding potential index (Version 1.1) Long-legged wading bird foraging condition index (Version 1.1) Short-legged wading bird foraging condition index (Version 1.1) White-tailed deer breeding potential index (Version 1.1) American alligator breeding potential index (Version 1.1) Everglades and slough crayfish (Version 1.1) Apple snail SESI model (Version 1.1)")
21
Products: Spatially Explicit Demographic Models Several spatially-explicit demographic simulation models have been developed within ATLSS. These models simulate the dynamics of the populations on the Everglades landscape. American Alligator age-structured Snail kite individual-based (EVERKITE) Cape Sable seaside sparrow individual-based (SIMSPAR). Crocodile age-structured (CROCMOD) Freshwater fish functional group (ALFISH) Estuarine fish functional group (ALFISHES) Crayfish stage-structured
 Cape Sable seaside sparrow individual-based (SIMSPAR). Crocodile age-structured (CROCMOD) Freshwater fish functional group (ALFISH) Estuarine fish functional group (ALFISHES) Crayfish stage-structured.")
22
American Alligator:Basic model cycle Starting alligator densities Alligator habitat area Survival and Development

23
Products: Spatially Explicit Demographic Models Snail kite demographic model (EVERKITE). This model is available for use for CERP. What is noteworthy is that the model predicts the spatial distribution of snail kites through time. The model also represents enormous theoretical progress.

24
Snail Kite Annual Count Data and EVERKITE Output

25
Temporally Averaged Spatial Distribution of Snail Kite from EVERKITE

26
Products: Spatially Explicit Demographic Models Cape Sable Seaside Sparrow model (SIMSPAR). This model is available for use and is currently being tested against data. Freshwater fish model (ALFISH). This model projects number and biomass density of two fish functional groups. The model is being extended to include canals. Estuary fish model (ALFISHES). This model projects fish number and biomass densities in the mangrove estuaries as a function of water depth and salinity. It is currently being tested against empirical data at selected sites (Jon Cline and Jerry Lorenz). It uses hydrology/salinity model from SICS.
. This model projects number and biomass density of two fish functional groups. The model is being extended to include canals. Estuary fish model (ALFISHES). This model projects fish number and biomass densities in the mangrove estuaries as a function of water depth and salinity. It is currently being tested against empirical data at selected sites (Jon Cline and Jerry Lorenz). It uses hydrology/salinity model from SICS..")
27
Products: Spatially Explicit Demographic Models American crocodile model. This model is completed and will be available to community of crocodile ecologists. Everglades and slough crayfish models. Dynamic simulation model for Procamburus fallax has been developed based on 1- year time steps (Noble Hendrix, U. Washington Ph. D. dissertation). This will be refined to 1-month time steps and exended to Everglades crayfish as well.
. This will be refined to 1-month time steps and exended to Everglades crayfish as well..")
28
ALFISHES Model: Landscape

29
Other Scientific Results: Empirical Studies and Data Analysis Florida panthers ATLSS analysis of panther tracking data has overturned the idea that Florida panthers are forest specialists, which has conservation implications (Comiskey et al. Conservation Ecology 2002). Wading birds Analysis of data on experimental studies has determined the functional response of three wading bird species to fish density. This information will contribute to a bioenergetics model of a wading bird nesting colony.
. Wading birds Analysis of data on experimental studies has determined the functional response of three wading bird species to fish density. This information will contribute to a bioenergetics model of a wading bird nesting colony..")
30
Other Scientific Results: Empirical Studies and Data Analysis Apple snails The abundance of apple snails in relation to plant community structure has been investigated. Snail kites The response of snail kites to hydrologic conditions in terms of movement is being investigated by combining radiotelemetry and mark-resight data under a multistate modeling framework.

31
Other Scientific Results: Empirical Studies and Data Analysis American crocodile Empirical studies on American crocodile hatchlings, using radio-tags show that they apparently have behavioral responses that allow them to escape negative effects of high salinity.

32
Making the Models and Information Useful In addition to developing models that are relevant to restoration performance measures and that are tested and documented, it is also necessary to make the models as usable as possible. One method is the ATLSS Data Viewer System, now web- accessible (http://gisweb.nwrc.gov/dev/atlssdvs/index.php) Information from ATLSS and all other models is being organized into a decision support systems (Mazzotti and Pearlstine). One of our highest priorities is now to develop the capability to run ATLSS models on the Web. This is now being beta-tested.
. One of our highest priorities is now to develop the capability to run ATLSS models on the Web. This is now being beta-tested..")
Similar presentations


 Focuses on research of the coupled dynamics of social- ecological systems (SES) and the translation of.>")


 and ecosystem interactions with climate Carbon management (e.g.,>")


 hierarchy of models is designed to utilize varying levels of detail and data availability to.>")