Download presentation
Presentation is loading. Please wait.

1
Introduction to Generalized Linear Models Prepared by Louise Francis Francis Analytics and Actuarial Data Mining, Inc. October 3, 2004

2
Objectives u Gentle introduction to Linear Models and Generalized Linear Models u Illustrate some simple applications u Show examples in commonly available software u Which model(s) to use? u Practical issues

3
A Brief Introduction to Regression u One of most common statistical methods fits a line to data u Model: Y = a+bx + error u Error assumed to be Normal

4
A Brief Introduction to Regression u Fits line that minimizes squared deviation between actual and fitted values u

5
Simple Formula for Fitting Line

6
Excel Does Regression u Install Data Analysis Tool Pak (Add In) that comes with Excel u Click Tools, Data Analysis, Regression
 that comes with Excel u Click Tools, Data Analysis, Regression")
7
Goodness of Fit Statistics u R 2 : (SS Regression/SS Total) u percentage of variance explained u F statistic: (MS Regression/MS Resid) u significance of regression u T statistics: Uses SE of coefficient to determine if it is significant u significance of coefficients u It is customary to drop variable if coefficient not significant u Note SS = Sum squared of errors
 u percentage of variance explained u F statistic: (MS Regression/MS Resid) u significance of regression u T statistics: Uses SE of coefficient to determine if it is significant u significance of coefficients u It is customary to drop variable if coefficient not significant u Note SS = Sum squared of errors")
8
Output of Excel Regression Procedure

9
Assumptions of Regression u Errors independent of value of X u Errors independent of value of Y u Errors independent of prior errors u Errors are from normal distribution u We can test these assumptions

10
Other Diagnostics: Residual Plot u Points should scatter randomly around zero u If not, a straight line probably is not be appropriate

11
Other Diagnostics: Normal Plot u Plot should be a straight line u Otherwise residuals not from normal distribution

12
Test for autocorrelated errors u Autocorrelation often present in time series data u Durban – Watson statistic: u If residuals uncorrelated, this is near 2

13
Durban Watson Statistic u Indicates autocorrelation present

14
Non-Linear Relationships u The model fit was of the form: u Severity = a + b*Year u A more common trend model is: u Severity Year =Severity Year0 *(1+t) (Year-Year0) u T is the trend rate u This is an exponential trend model u Cannot fit it with a line
 (Year-Year0) u T is the trend rate u This is an exponential trend model u Cannot fit it with a line")
15
Transformation of Variables u Severity Year =Severity Year0 *(1+t) (Year-Year0) 1. Log both sides 2. ln(Sev Year )=ln(Sev Year0 )+(Year-Year0)*ln(1+t) 3. Y = a + x * b 4. A line can be fit to transformed variables where dependent variable is log(Y)
=ln(Sev Year0 )+(Year-Year0)*ln(1+t) 3. Y = a + x * b 4. A line can be fit to transformed variables where dependent variable is log(Y).")
16
Exponential Trend – Cont. u R 2 declines and Residuals indicate poor fit

17
A More Complex Model u Use more than one variable in model (Econometric Model) u In this case we use a medical cost index and the consumer price index to predict workers compensation severity
 u In this case we use a medical cost index and the consumer price index to predict workers compensation severity")
18
Multivariable Regression

19
Regression Output

20
Regression Output cont. u Standardized residuals more evenly spread around the zero line – but pattern still present u R 2 is.84 vs.52 of simple trend regression u We might want other variables in model (i.e, unemployment rate), but at some point overfitting becomes a problem
, but at some point overfitting becomes a problem.")
21
Multicollinearity u Predictor variables are assumed uncorrelated u Assess with correlation Matrix

22
Remedies for Multicollinearity u Drop one of the highly correlated variables u Use Factor analysis or Principle components to produce a new variable which is a weighted average of the correlated variables

23
Exponential Smoothing u A weighted average with more weight given to more recent values u Linear Exponential Smoothing: model level and trend

24
Exponential Smoothing Fit

25
Tail Development Factors: Another Regression Application u Typically involve non-linear functions: u Inverse Power Curve: u Hoerel Curve: u Probability distribution such as Gamma, Lognormal

26
Example: Inverse Power Curve Can use transformation of variables to fit simplified model: LDF=1+k/t a ln(LDF-1) =a+b*ln(1/t) Use nonlinear regression to solve for a and c Uses numerical algorithms, such as gradient descent to solve for parameters. Most statistics packages let you do this

27
Nonlinear Regression: Grid Search Method Try out a number of different values for parameters and pick the ones which minimize a goodness of fit statistic You can use the Data Table capability of Excel to do this Use regression functions linest and intercept to get k and a Try out different values for c until you find the best one

28
Fitting non-linear function

29
Using Data Tables in Excel

30
Use Model to Compute the Tail

31
Fitting Non-linear functions u Another approach is to use a numerical method u Newton-Raphson (one dimension) u x n+1 = x n – f’(x n )/f’’(x n ) u f(x n ) is typically a function being maximized or minimized, such as squared errors u x’s are parameters being estimated u A multivariate version of Newton_Raphson or other algorithm is available to solve non-linear problems in most statistical software u In Excel the Solver add-in is used to do this
 u x n+1 = x n – f’(x n )/f’’(x n ) u f(x n ) is typically a function being maximized or minimized, such as squared errors u x’s are parameters being estimated u A multivariate version of Newton_Raphson or other algorithm is available to solve non-linear problems in most statistical software u In Excel the Solver add-in is used to do this")
32
Claim Count Triangle Model Chain ladder is common approach

33
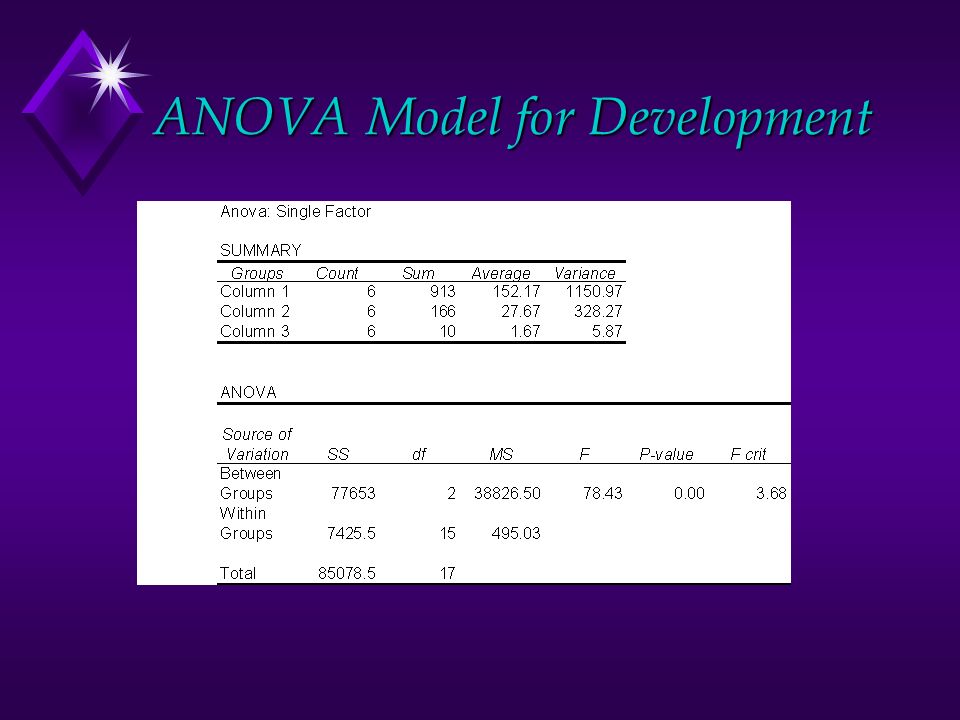
Claim Count Development u Another approach: additive model u This model is the same as a one factor ANOVA

34
ANOVA Model for Development

36
Regression With Dummy Variables u Let Devage24=1 if development age = 24 months, 0 otherwise u Let Devage36=1 if development age = 36 months, 0 otherwise u Need one less dummy variable than number of ages

37
Regression with Dummy Variables: Design Matrix

38
Equivalent Model to ANOVA

39
Apply Logarithmic Transformation u It is reasonable to believe that variance is proportional to expected value u Claims can only have positive values u If we log the claim values, can’t get a negative u Regress log(Claims+.001) on dummy variables or do ANOVA on logged data
 on dummy variables or do ANOVA on logged data")
40
Log Regression

41
Poisson Regression u Log Regression assumption: errors on log scale are from normal distribution. u But these are claims – Poisson assumption might be reasonable u Poisson and Normal from more general class of distributions: exponential family of distributions

42
“Natural” Form of the Exponential Family

43
Specific Members of the Exponential Family u Normal (Gaussian) u Poisson u Negative Binomial u Gamma u Inverse Gaussian
 u Poisson u Negative Binomial u Gamma u Inverse Gaussian")
44
Some Other Members of the Exponential Family u Natural Form u Binomial u Logarithmic u Compound Poisson/Gamma (Tweedie) u General Form [use ln( y ) instead of y ] u Lognormal u Single Parameter Pareto
![Some Other Members of the Exponential Family u Natural Form u Binomial u Logarithmic u Compound Poisson/Gamma (Tweedie) u General Form [use ln( y ) instead of y ] u Lognormal u Single Parameter Pareto](http://images.slideplayer.com/24/7493294/slides/slide_44.jpg "Some Other Members of the Exponential Family u Natural Form u Binomial u Logarithmic u Compound Poisson/Gamma (Tweedie) u General Form [use ln( y ) instead of y ] u Lognormal u Single Parameter Pareto")
45
Poisson Distribution u Natural Form: u “Over-dispersed” Poisson allows 1. u Variance/Mean ratio = u Poisson distribution:

46
Linear Model vs GLM u Regression: u GLM:

47
The Link Function u Like transformation of variables in linear regression u Y=AX B is transformed into a linear model u log(Y) = log(A) + B*log(X) u This is similar to having a log link function: u h(Y) = log(Y) u denote h(Y) as n u n = a+bx
 = log(A) + B*log(X) u This is similar to having a log link function: u h(Y) = log(Y) u denote h(Y) as n u n = a+bx")
48
Other Link Functions u Identity u h(Y)=Y u Inverse u h(Y) = 1/Y u Logistic u h(Y)=log(y/(1-y)) u Probit u h(Y) =
=Y u Inverse u h(Y) = 1/Y u Logistic u h(Y)=log(y/(1-y)) u Probit u h(Y) =")
49
The Other Parameters: Poisson Example Link function

50
LogLikhood for Poisson

51
Estimating Parameters u As with nonlinear regression, there usually is not a closed form solution for GLMs u A numerical method used to solve u For some models this could be programmed in Excel – but statistical software is the usual choice u If you can’t spend money on the software, download R for free

52
GLM fit for Poisson Regression u >devage<-as.facto((AGE) u >claims.glm<-glm(Claims~devage, family=poisson) u >summary(claims.glm) u Call: u glm(formula = Claims ~ devage, family = poisson) u Deviance Residuals: u Min 1Q Median 3Q Max u -10.250 -1.732 -0.500 0.507 10.626 u Coefficients: u Estimate Std. Error z value Pr(>|z|) u (Intercept) 4.73540 0.02825 167.622 < 2e-16 *** u devage2 -0.89595 0.05430 -16.500 < 2e-16 *** u devage3 -4.32994 0.29004 -14.929 < 2e-16 *** u devage4 -6.81484 1.00020 -6.813 9.53e-12 *** u --- u Signif. codes: 0 `***' 0.001 `**' 0.01 `*' 0.05 `.' 0.1 ` ' 1 u (Dispersion parameter for poisson family taken to be 1) u Null deviance: 2838.65 on 36 degrees of freedom u Residual deviance: 708.72 on 33 degrees of freedom u AIC: 851.38
 u (Intercept) < 2e-16 *** u devage < 2e-16 *** u devage < 2e-16 *** u devage e-12 *** u --- u Signif. codes: 0 `*** `** 0.01 `* 0.05 `. 0.1 ` 1 u (Dispersion parameter for poisson family taken to be 1) u Null deviance: on 36 degrees of freedom u Residual deviance: on 33 degrees of freedom u AIC:")
53
Deviance: Testing Fit u The maximum liklihood achievable is a full model with the actual data, y i, substituted for E(y) u The liklihood for a given model uses the predicted value for the model in place of E(y) in the liklihood u Twice the difference between these two quantities is known as the deviance u For the Normal, this is just the sum of squared errors u It is used to assess the goodness of fit of GLM models – thus it functions like residuals for Normal models
 u The liklihood for a given model uses the predicted value for the model in place of E(y) in the liklihood u Twice the difference between these two quantities is known as the deviance u For the Normal, this is just the sum of squared errors u It is used to assess the goodness of fit of GLM models – thus it functions like residuals for Normal models")
54
A More General Model for Claim Development

55
Design Matrix: Dev Age and Accident Year Model

56
More General GLM development Model u Deviance Residuals: u Min 1Q Median 3Q Max u -10.5459 -1.4136 -0.4511 0.7035 10.2242 u Coefficients: u Estimate Std. Error z value Pr(>|z|) u (Intercept) 4.731366 0.079903 59.214 < 2e-16 *** u devage2 -0.844529 0.055450 -15.230 < 2e-16 *** u devage3 -4.227461 0.290609 -14.547 < 2e-16 *** u devage4 -6.712368 1.000482 -6.709 1.96e-11 *** u AY1994 -0.130053 0.114200 -1.139 0.254778 u AY1995 -0.158224 0.115066 -1.375 0.169110 u AY1996 -0.304076 0.119841 -2.537 0.011170 * u AY1997 -0.504747 0.127273 -3.966 7.31e-05 *** u AY1998 0.218254 0.104878 2.081 0.037431 * u AY1999 0.006079 0.110263 0.055 0.956033 u AY2000 -0.075986 0.112589 -0.675 0.499742 u AY2001 0.131483 0.107294 1.225 0.220408 u AY2002 0.136874 0.107159 1.277 0.201496 u AY2003 0.410297 0.110600 3.710 0.000207 *** u --- u Signif. codes: 0 `***' 0.001 `**' 0.01 `*' 0.05 `.' 0.1 ` ' 1 u (Dispersion parameter for poisson family taken to be 1) u Null deviance: 2838.65 on 36 degrees of freedom u Residual deviance: 619.64 on 23 degrees of freedom u AIC: 782.3
 u (Intercept) < 2e-16 *** u devage < 2e-16 *** u devage < 2e-16 *** u devage e-11 *** u AY u AY u AY * u AY e-05 *** u AY * u AY u AY u AY u AY u AY *** u --- u Signif. codes: 0 `*** `** 0.01 `* 0.05 `. 0.1 ` 1 u (Dispersion parameter for poisson family taken to be 1) u Null deviance: on 36 degrees of freedom u Residual deviance: on 23 degrees of freedom u AIC:")
57
Plot Deviance Residuals to Assess Fit

58
QQ Plots of Residuals

59
An Overdispersed Poisson? u Variance of poisson should be equal to its mean u If it is greater than that, then overdispersed poisson u This uses the parameter u It is estimated by evaluating how much the actual variance exceeds the mean

60
Weighted Regression u There an additional consideration in the analysis: should the observations be weighted? u The variability of a particular record will be proportional to exposures u Thus, a natural weight is exposures

61
Weighted Regression u Least squares for simple regression u Minimize SUM((Y i – a – bX i ) 2 ) u Least squares for weighted regression u Minimize SUM((w i (Y i – a –bx i ) 2 ) u Formula
 2 ) u Least squares for weighted regression u Minimize SUM((w i (Y i – a –bx i ) 2 ) u Formula")
62
Weighted Regression u Example: u Severities more credible if weighted by number of claims they are based on u Frequencies more credible if weighted by exposures u Weight inversely proportional to variance u Like a regression with # observations equal to number of claims (policyholders) in each cell u A way to approximate weighted regression u Multiply Y by weight u Multiply predictor variables by weight u Run regression u With GLM, specify appropriate weight variable
 in each cell u A way to approximate weighted regression u Multiply Y by weight u Multiply predictor variables by weight u Run regression u With GLM, specify appropriate weight variable")
63
Weighted GLM of Claim Frequency Development u Weighted by exposures u Adjusted for overdispersion

64
Introductory Modeling Library Recommendations u Berry, W., Understanding Regression Assumptions, Sage University Press u Iversen, R. and Norpoth, H., Analysis of Variance, Sage University Press u Fox, J., Regression Diagnostics, Sage University Press u Chatfield, C., The Analysis of Time Series, Chapman and Hall u Fox, J., An R and S-PLUS Companion to Applied Regression, Sage Publications u 2004 Casualty Actuarial Discussion Paper Program on Generalized Linear Models, www.casact.org

Similar presentations


: –Hypothesis Tests and Confidence Intervals for Intercept and Slope –Confidence.>")


