Download presentation
Presentation is loading. Please wait.

1
ITC protocol for measuring exposure to secondhand tobacco smoke Mark Travers, MS Andrew Hyland, PhD Roswell Park Cancer Institute

2
Outline of Presentation FCTC, Health effects of SHS exposure Effects of smoke-free air policies Results of air quality studies Why measure air quality? How to measure air quality using the TSI Sidepak – ITC protocol What you can do and how we can help

3
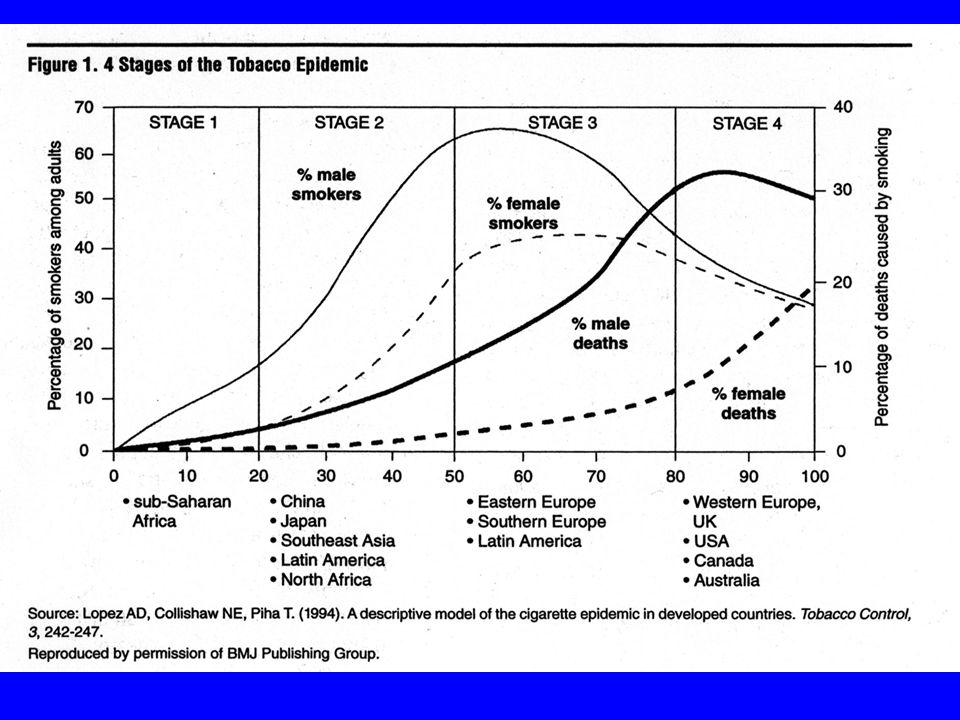
Why go smokefree? -SHS harmful -Lung cancer, heart disease, adverse respiratory effects in kids, and now breast cancer in younger women -FCTC, Article 8 - Protection from exposure to tobacco smoke -“Each Party shall adopt and implement in areas of existing national jurisdiction as determined by national law and actively promote at other jurisdictional levels the adoption and implementation of effective legislative, executive, administrative and/or other measures, providing for protection from exposure to tobacco smoke in indoor workplaces, public transport, indoor public places and, as appropriate, other public places.”

4
Effects Causally Associated with ETS Exposure Developmental Effects Fetal Growth: Low birthweight and decrease in birthweight Sudden Infant Death Syndrome (SIDS) Pre-term delivery Respiratory Effects Acute lower respiratory tract infections in children (e.g. bronchitis and pneumonia) Asthma induction and exacerbation in children and adults Chronic respiratory symptoms in children Eye and nasal irritation in adults Middle ear infections in children Carcinogenic Effects Lung cancer Nasal sinus cancer Breast cancer in younger, primarily premenopausal women Cardiovascular and Hematological Effects Heart disease mortality Acute and chronic coronary heart disease morbidity Altered vascular properties Source: Proposed Identification of Environmental Tobacco Smoke as a Toxic Air Contaminant. California Environmental Protection Agency, Air Resources Board, Office of Environmental Health Hazard Assessment. June 2005.
 Asthma induction and exacerbation in children and adults Chronic respiratory symptoms in children Eye and nasal irritation in adults Middle ear infections in children Carcinogenic Effects Lung cancer Nasal sinus cancer Breast cancer in younger, primarily premenopausal women Cardiovascular and Hematological Effects Heart disease mortality Acute and chronic coronary heart disease morbidity Altered vascular properties Source: Proposed Identification of Environmental Tobacco Smoke as a Toxic Air Contaminant. California Environmental Protection Agency, Air Resources Board, Office of Environmental Health Hazard Assessment. June")
5
Effects with Suggestive Evidence of a Causal Association with ETS Exposure Reproductive and Developmental Effects Spontaneous Abortion, Intrauterine Growth Retardation Adverse Impact on Cognition and Behavior Allergic Sensitization Decrease pulmonary function growth Adverse effects on fertility or fecundability Cardiovascular and Hematological Effects Elevated risk of stroke in adults Respiratory Effects Exacerbation of Cystic Fibrosis Chronic respiratory symptoms in adults Carcinogenic Effects Cervical Cancer Brain Cancer and lymphomas in children Nasopharyngeal cancer All cancers – adult and child Source: Proposed Identification of Environmental Tobacco Smoke as a Toxic Air Contaminant. California Environmental Protection Agency, Air Resources Board, Office of Environmental Health Hazard Assessment. June 2005.

7
Price Smoke- free Air Treatment Counter Marketing Components of Smoking Vaccine

8
Evaluation of Smoke-free Air Law ImplementationPublic Health Impact Adverse Side Effects Support or Opposition Compliance Exceptions to Law (Waivers) Direct Effects Indirect Effects Economic Impact
 Direct Effects Indirect Effects Economic Impact")
9
Evaluation of Smoke-free Air Law Public Health Impact Direct Effects Decrease indoor air pollution Reduce exposure to carcinogens and toxins Improve health and reduce incidence of tobacco smoke related diseases

10
Evaluation of Smoke-free Air Law Public Health Impact Direct Effects Indirect Effects Promote cessation Decrease consumption

12
Measuring Air Quality Cigarettes, cigars and pipes are major emitters of respirable suspended particles less than 2.5 microns (PM 2.5 ) in diameter that are easily inhaled deep into the lungs TSI SidePak AM510 Personal Aerosol Monitor (weight: 1 lb)
 in diameter that are easily inhaled deep into the lungs TSI SidePak AM510 Personal Aerosol Monitor (weight: 1 lb)")
13
Why PM 2.5 ? Very sensitive marker of ETS Can monitor and record data in real time Relatively inexpensive equipment Marker of the more than 4,000 chemical in ETS –E.g. 2,000:1, PM 2.5 :PAH Meaningful measure: there are PM 2.5 standards in place to protect public health –The EPA has set standards of 15 μg/m 3 as the average annual level of PM 2.5 exposure and 65 μg/m 3 24-hour exposure in order to protect the public health

14
US EPA Air Quality Index Air Quality Air Quality Index PM 2.5 ( g/m 3 ) Health Advisory Good0-50≤15 None. Moderate51-10016-40 Unusually sensitive people should consider reducing prolonged or heavy exertion. Unhealthy for Sensitive Groups 101-15041-65 People with heart or lung disease, older adults, and children should reduce prolonged or heavy exertion. Unhealthy151-20066-150 People with heart or lung disease, older adults, and children should avoid prolonged or heavy exertion. Everyone else should reduce prolonged or heavy exertion. Very Unhealthy 201-300151-250 People with heart or lung disease, older adults, and children should avoid all physical activity outdoors. Everyone else should avoid prolonged or heavy exertion. Hazardous≥301≥251 People with heart or lung disease, older adults, and children should remain indoors and keep activity levels low. Everyone else should avoid all physical activity outdoors.

15
Hayman Fire – Worst in Colorado History, June 8 2002

16
Denver June 9, 2002

17
Denver’s visibility – before Hayman fire

18
Denver’s visibility – 1 day after Hayman fire Worst PM 2.5 - 43 µg/m 3 (24-hr max) or 200 µg/m 3 (hourly max)
 or 200 µg/m 3 (hourly max)")
19
Results Pre-post study design –Indiana Air Monitoring Study –Western New York Air Monitoring Study Travers, M.J., et al., Indoor Air Quality in Hospitality Venues Before and After the Implementation of a Clean Indoor Air Law-Western New York, 2003. Morbidity and Mortality Weekly Report (MMWR), 2004.
,")
20
Indiana Air Monitoring Study December 2004 to January 2005 Indiana Tobacco Prevention and Cessation Roswell Park Cancer Institute

21
VENUE 1a VENUE 2a VENUE 3a VENUE 4a VENUE 5a VENUE 6a VENUE 7a VENUE 8a Indiana Air Monitoring Study: Bloomington, IN, December 10 th, 2004 12/10/04 6:00pm 12/11/04 1:20am

22
VENUE 1b VENUE 2b VENUE 3b VENUE 4b VENUE 5b VENUE 6b VENUE 7b VENUE 8b 1/21/05 6:14pm 1/22/05 1:34am Indiana Air Monitoring Study: Bloomington, IN, January 21 st, 2005

23
Bloomington, IN Before and After Clean Indoor Air Law

24
annual PM 2.5 standard (15μg/m 3 ) 24-hour PM 2.5 standard (65μg/m 3 ) 89% 95%
 24-hour PM 2.5 standard (65μg/m 3 ) 89% 95%")
26
Indoor Air Quality Before and After the New York State Clean Indoor Air Law in Western New York Hospitality Venues, July to September 2003 Mark Travers, 1 Michael Cummings, 1 James Repace, 2 Andrew Hyland 1 1 Division of Cancer Prevention and Population Sciences, Roswell Park Cancer Institute; Buffalo, New York 2 Repace Associates, Inc.; Bowie, Maryland

27
Change in Air Quality in Western New York Bars and Restaurants After Implementation of the New York State Clean Indoor Air Law Before Law: Average = 412 μg/m 3 After Law: Average = 27 μg/m 3 Only venue with active smoking during post-law sampling Mean size of venue = 365m 3 Mean pre-law active smoker density = 1.38 cigs/100m 3

28
Results Cross sectional study design –Multi-City Air Monitoring Study –Global Irish Pub Study –Global Air Monitoring Study

29
Multi-City Air Monitoring Study: Philadelphia, PA April 10 th, 2004 All venues are smoking venues with observed smoking in all venues 4/10 7:01pm 4/11 1:41am VENUE 42 VENUE 43 VENUE 44 VENUE 45 VENUE 46 VENUE 47 VENUE 48

30
Multi-City Air Monitoring Study: New York City, NY April 17 th, 2004 All venues are smoke-free by law and no smoking was observed in an venue 4/17 6:43pm 4/18 2:38am VENUE 56 VENUE 57 VENUE 58 VENUE 59 VENUE 60 VENUE 61 VENUE 62

31
Multi-City Air Monitoring Study: New York City, NY April 17 th, 2004 and Philadelphia, PA April 10 th, 2004

33
Average Level of PM 2.5 by City

36
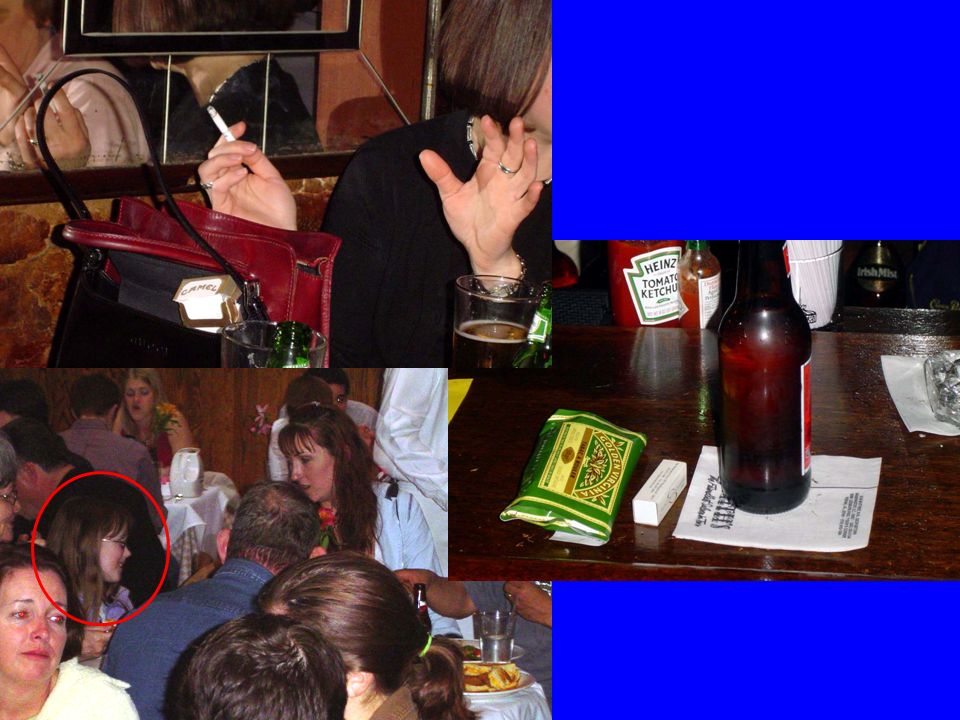
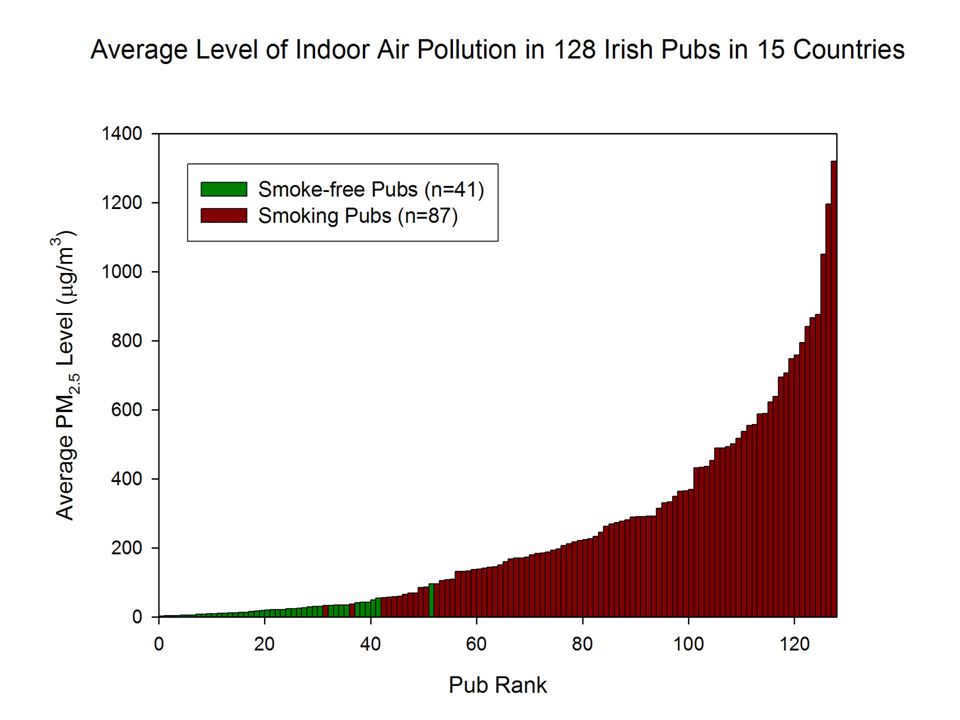
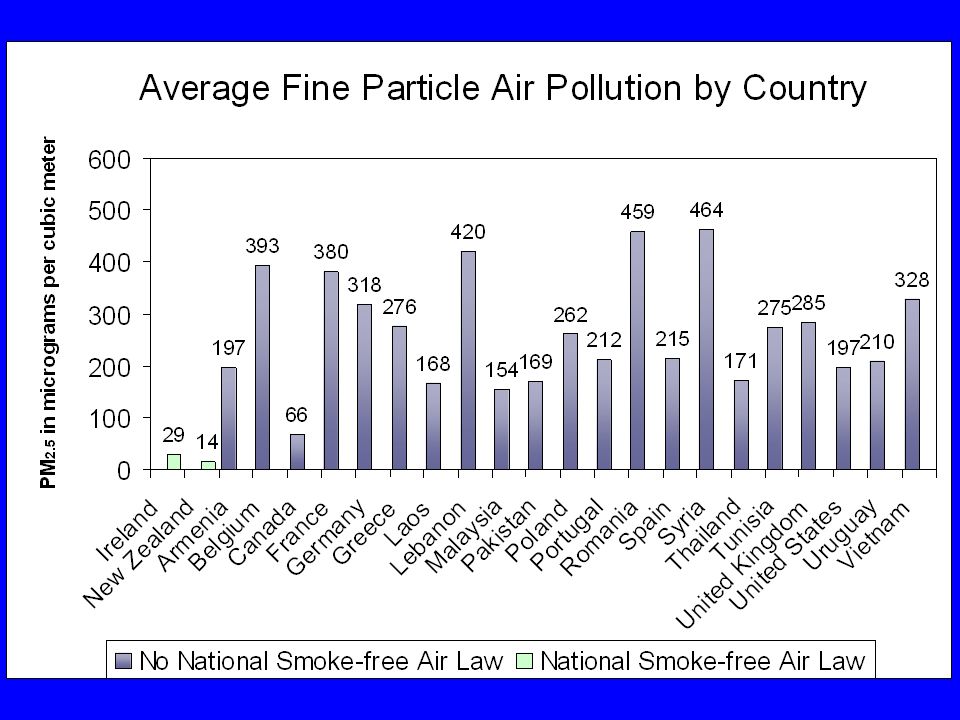
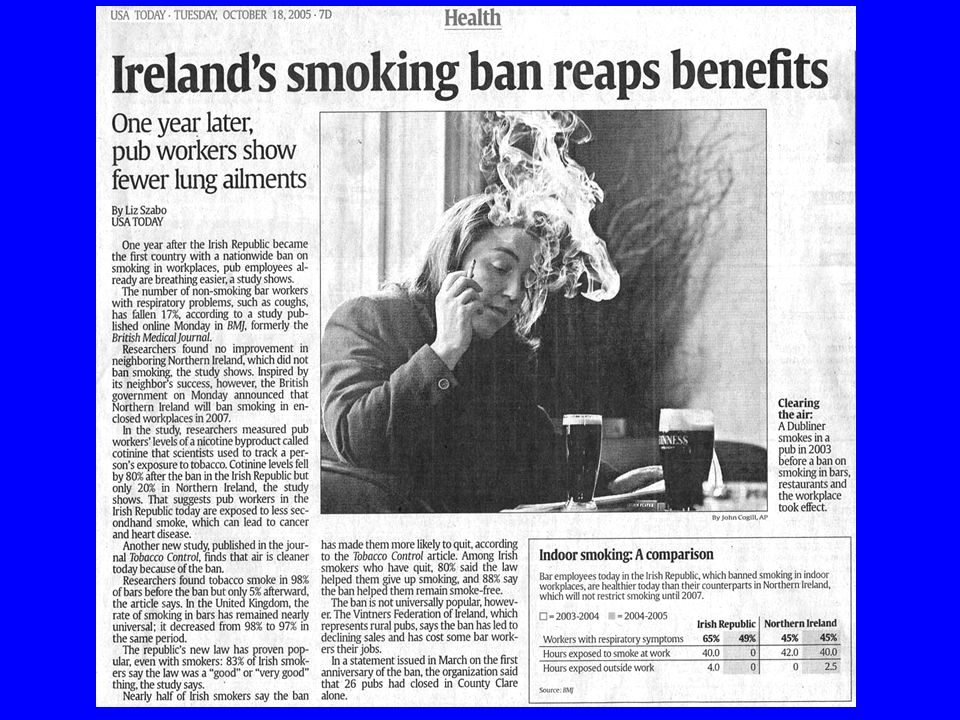
Global Irish Pub Study Indoor air quality was assessed in 128 Irish pubs in 15 countries, between January 21, 2004 and March 10, 2006 The level of air pollution inside Irish pubs located in smoke-free cities was 93% lower than the level found in pubs in cities allowing indoor smoking

38
Current participating countries (n=38) Global Air Monitoring Study
 Global Air Monitoring Study")
40
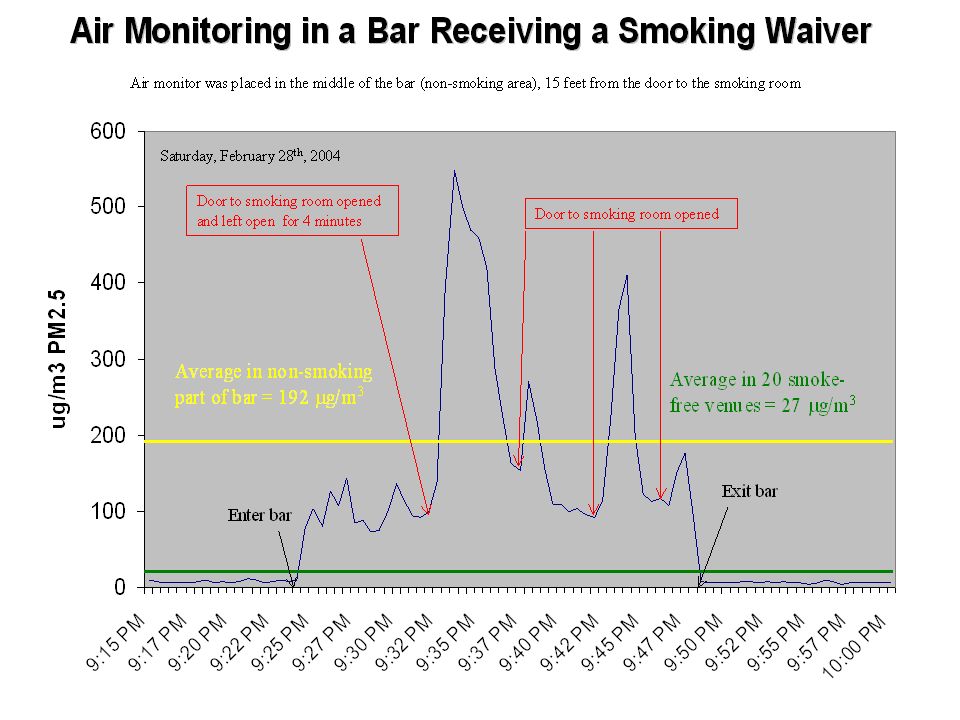
Results Case studies –One bar with a designated smoking room

42
Why measure air quality? Quantify exposure, determine risk Educate the public and policy makers Evaluate smoke-free air policies Generate media attention

43
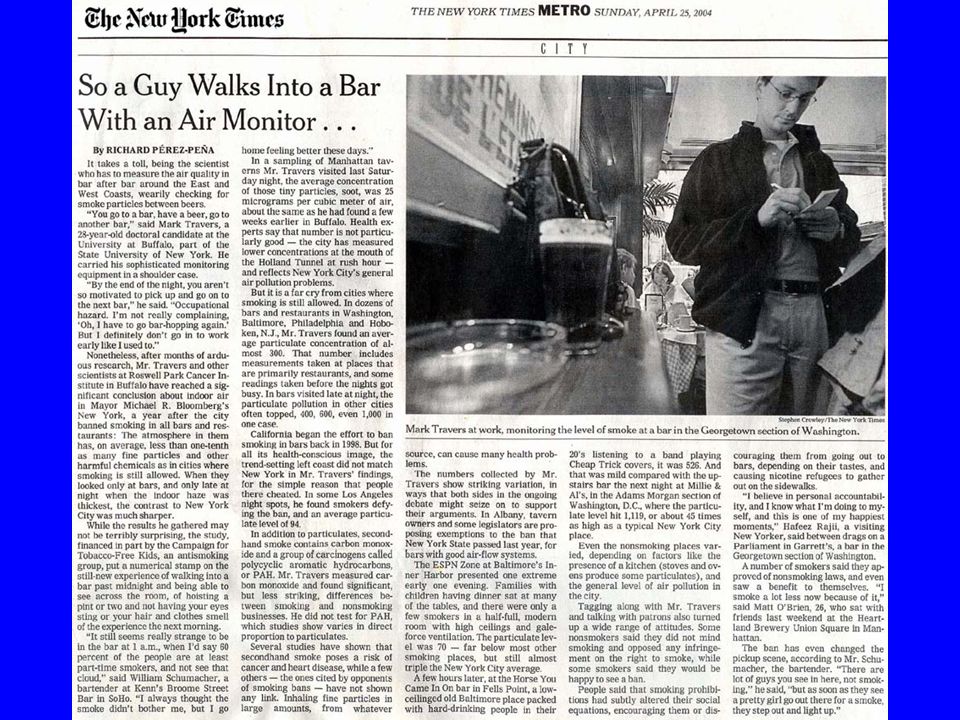
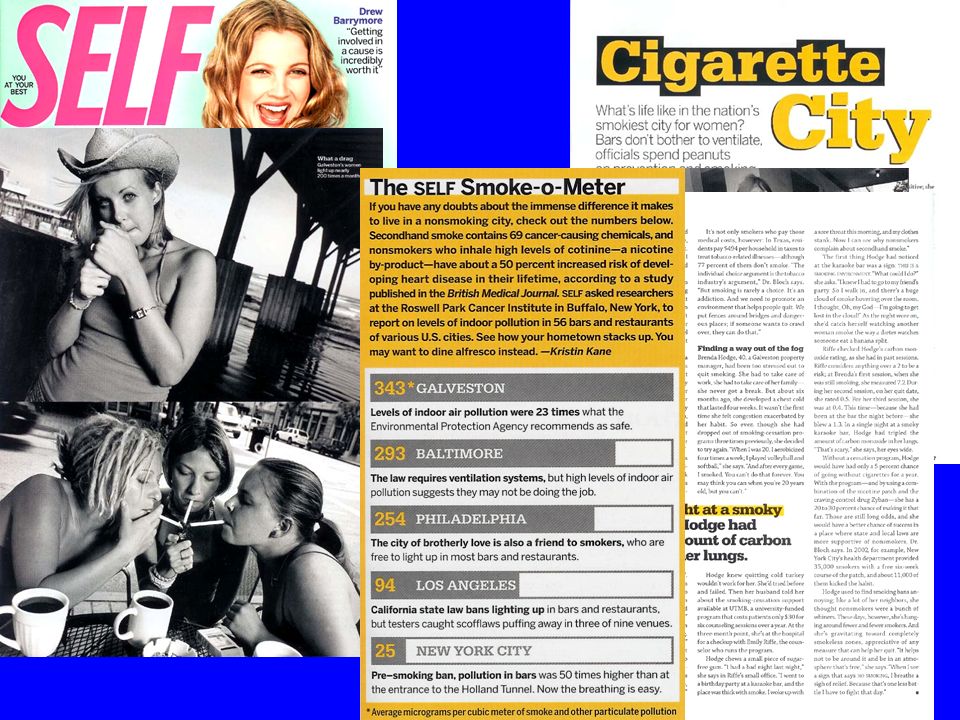
Data from air monitoring studies is used to educate the public about the dangers of secondhand smoke. News articles Editorial support

46
How to measure air quality using the TSI Sidepak How does it work? Important issues to be aware of –Calibration Factor –Flow rate How to prepare and operate the Sidepak Measurements and observations Advantages Limitations

47
The training course at www.tobaccofreeair.org

48
Schematic of a Laser Photometer

49
Calibration The TSI SidePak Personal Aerosol Monitor uses a built-in pump to bring air past a laser. The particles in the air scatter the light from the laser and the device determines the mass concentration of particles based on the amount of scattering. These types of devices must be calibrated with the specific type of aerosol (tobacco smoke) that you are measuring.
 that you are measuring..")
50
SidePak Factory Calibration Certificate

51
Calibration: Unadjusted Data Repace, J., Respirable particles and carcinogens in the air of Delaware hospitality venues before and after a smoking ban. Journal of Occupational and Environmental Medicine, 46:9, 887-905. Oct. 10 th 2003 Bowie, MD

52
Calibration: Adjusted Data Oct. 10 th 2003 Bowie, MD

53
Flow Rate The flow rate needs to be set at 1.7 liters per minute in order for the 2.5 micron impactor to work properly

54
Flow Rate Calibration The flow rate can be calibrated with either a simple rotameter or a primary calibrator. The flow rate will already be calibrated on the equipment we provide!

55
How to Prepare and Operate the Sidepak 1) Charge Battery 2) Clean and grease the impactor 3) Zero calibrate the Sidepak 4) Log (record) data into memory 5) Download data from Sidepak to the PC
 Charge Battery 2) Clean and grease the impactor 3) Zero calibrate the Sidepak 4) Log (record) data into memory 5) Download data from Sidepak to the PC")
56
1) Charge battery
 Charge battery")
57
2) ) Clean and grease the impactor
 ) Clean and grease the impactor")
58
3) Zero Calibrate the Sidepak
 Zero Calibrate the Sidepak")
59
4) Set Sidepak to log (record) data into memory
 Set Sidepak to log (record) data into memory")
60
5) Download data from Sidepak to the computer
 Download data from Sidepak to the computer")
61
The TSI SidePak is small and can be used for discrete sampling

62
Romanian researcher carrying the TSI sidepak (in shoulder bag)
")
63
Kang using a Sidepak to sample Durty Nellies Irish Pub in Beijing, China

64
Measurements and Observations Use a sonic measure to determine the size (volume) of the rooms you sample
 of the rooms you sample")
65
Measurements and Observations Take notes on your location, times of entry and exit, counts every 15 minutes of number of people and number of burning cigarettes Take descriptive notes as well

66
Waterloo, Canada Greece

67
Average Particle Concentration versus Average Smoking Density r=0.421

68
Average Particle Concentration versus Average Smoking Density by Ventilation 1.0<ACH<2.1 ACH 1.0 ACH 2.1 r=0.908 r=0.834 r=0.832

69
Limitations of PM 2.5 as a Marker of SHS Not specific to tobacco smoke; other sources include cooking, vehicles, ambient/background levels

71
Bangkok, Thailand, February 2006 Outdoors on busy Bangkok streets Restaurant with smoking

72
Bangkok, Thailand, February 2006 Outdoors on busy Bangkok streets Restaurant with smoking Pub

74
What you can do Collect SHS exposure data in your own country to: –Generate relevant local data for use in your own country –Inform the debate on smoke-free air policy –Contribute to the Global Air Monitoring Study

75
How we can help Provide training on equipment use and data collection Provide equipment for you to use (Sidepaks) Help in study design Analyze data and generate reports Help generate media attention in your results WWW.TOBACCOFREEAIR.ORG
 Help in study design Analyze data and generate reports Help generate media attention in your results")
76
How we can help Small grants are available from the ITC project to help you get started. See the RFP in your packet – focused projects in specific areas Data should inform policy debates <$10,000 USD, 5-10 awards made 6 page proposals due September 1 Submit online at www.tobaccofreeair.org

77
Summary The TSI SidePak is a is scientifically valid and effective tool for real-time PM 2.5 monitoring in SHS studies Can show immediate, direct causal link between smoking and fine particle air pollution With some expert training and guidance you can collect data in your own country Simple environmental monitoring studies can be powerful in policy debates

78
Equipment Availability Rent –Ashtead Technologies –http://www.ashtead-technology.com/http://www.ashtead-technology.com/ Buy –TSI Inc. –http://www.tsi.comhttp://www.tsi.com Borrow –Roswell Park Cancer Institute

79
Contact Mark Travers –Roswell Park Cancer Institute, Elm and Carlton Streets, Buffalo, NY 14222 USA –Mark.travers@roswellpark.orgMark.travers@roswellpark.org –(716) 845-5881 –(716) 845-8487 fax
 –(716) fax")
80
Website www.tobaccofreeair.org Training course Protocols Templates Examples of reports Examples of media Latest results Other links and resources

81
END

Similar presentations


 is a mixture of 2 forms of smoke that come from burning tobacco: Sidestream smoke ( 支流煙 ) – smoke from the lighted.>")


>")

 AQI = 230; Poor Responsible Pollutant: PM 10 Indian Institute of Technology Kanpur, Kanpur.>")


