Download presentation
Presentation is loading. Please wait.

1
Senior Design Spring 2015 Lindsay Sullivan Emily Simonelli Taniya Singh United Illuminating in Orange, CT 1/21/2015 1/22/2014 Copyright © 2014 – Advanced Power Electronics & Electric Drives Lab (APEDL)
")
2
Useful Macros We compiled several macros that can be used in sheets contained in the main excel workbook Can be used throughout the planning process to speed up tasks Easy to alter for future use if they need to be adjusted Graph macros allow for visuals of data being compared

3
Creating Charts Can be used for easily creating graphs that will be used every year This way they don’t take up space and complicate the sheet but are still easily used Colors, titles and other preferences can all be predetermined. Makes sure that all graphs look alike for continuity in reports and summaries

4
Changing Chart Types Can create a dashboard with several buttons to adjust the types of graphs easily in case the data would be easier to understand in a different way

5
Add/Find Rows Because there are so many rows of information the user form allows someone to isolate information much quicker Adds rows of information by finding the first empty one and inputting whatever information was put into the user form

6
Hide/Show Columns Starts off as hide columns button that will hide predetermined columns Easy to change this range Once the button is pressed it turns into show columns button Helps to clean up spreadsheet and hide data that isn’t being used when something is being updated

7
Creating a Data Structure A Data Structure using Excel and Visual Basic would be a possible way to integrate the hierarchy of the Data with the users. Master sheet will contain all the data and can only be edited by those in charge. Different excel workbooks can be pulled from the master sheet. Data will be password protected and only 1 program can be viewed at one time.

8
Overview of Data Structure

9
Example of Extracting Data

11
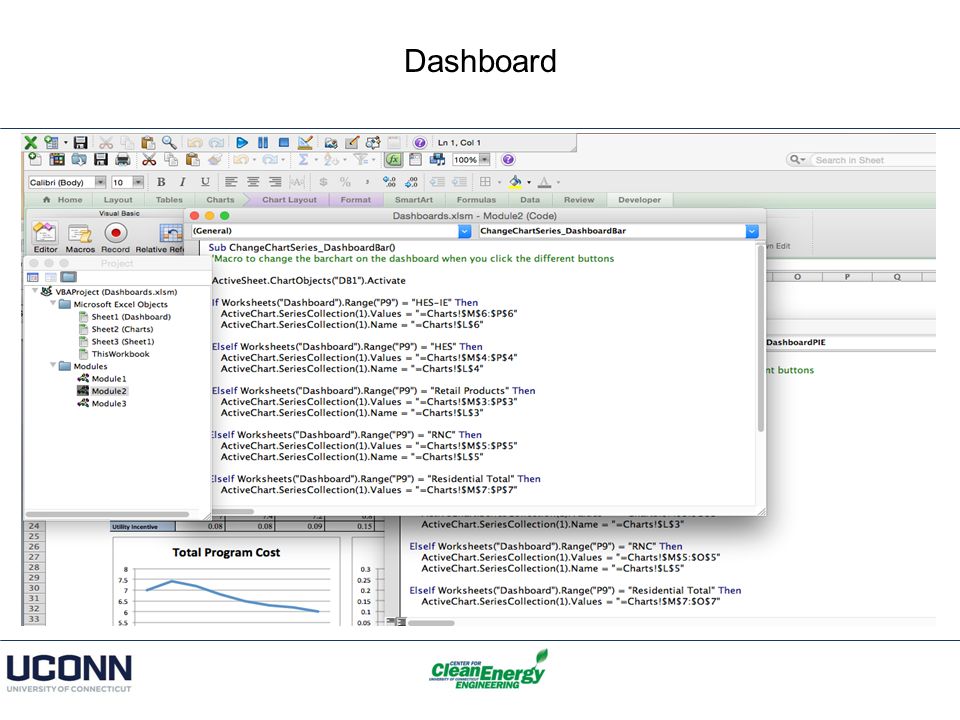
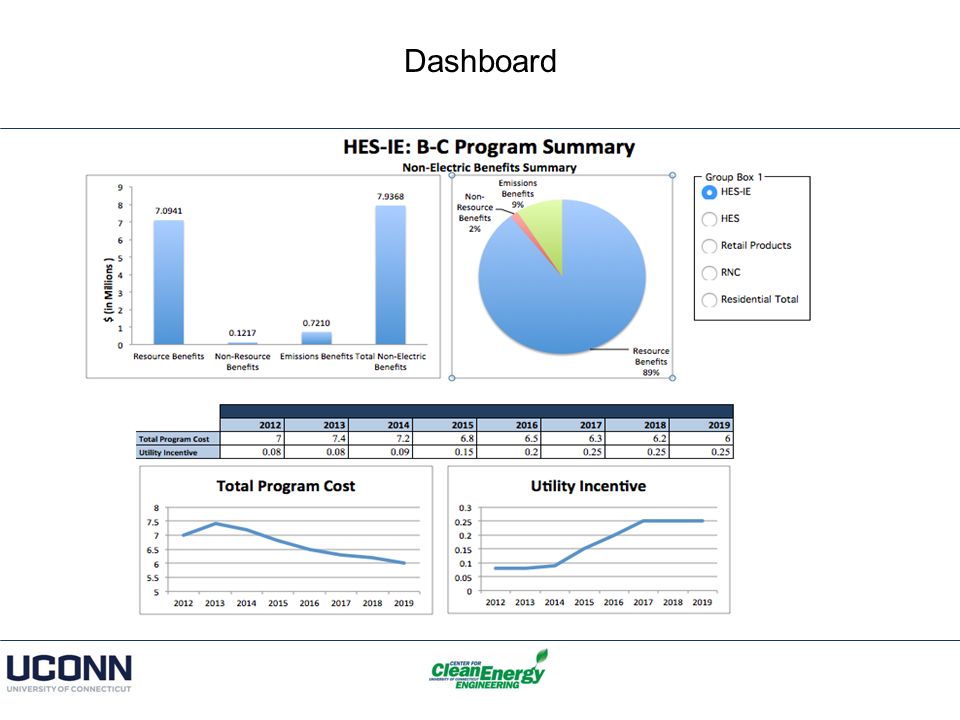
Dashboard Dashboards are an efficient way to highlight important data in a condensed report. User defined data chosen from a drop-down menu and/or check box Unchangeable components and format Options such as year, program, and cost profiles available

12
Dashboard

16
Timeline

Similar presentations


, For Youth Initiative.>")


, For Youth Initiative.>")
