Download presentation
Presentation is loading. Please wait.

1
Descriptive Statistics and Graphing

2
The Normal Distribution If the frequency (or number) of data points is plotted on the Y-axis, a bell-shaped curve may be produced. # Slow Fast Running Speed of People

3
Skewed Distribution (Not Normal) # Slow Fast Running Speed of People
 # Slow Fast Running Speed of People")
4
Central Tendency Mean – average Median – middle value Mode – most common value

5
Disadvantages - Mean Influenced by outliers Example- Population estimates of waterfowl on seven lakes: 400 200 220 210 340 250 44,000 Mean = 6,517

6
Disadvantages - Median The central number may not be representative, particularly with small samples. Example: 0, 0, 1, 2, 480, 500

7
Range 100, 75, 50, 25, 0 52, 51, 50, 49, 48

8
Standard Deviation The standard deviation describes the “spread” of data points. It is useful if the data fit a normal distribution. # Slow Fast Running Speed of People

9
Calculating the Standard Deviation

10
1) Calculate the mean
 Calculate the mean")
11
2) Calculate deviation from the mean
 Calculate deviation from the mean")
12
3) Square the deviations
 Square the deviations")
13
4) Sum the squared deviations
 Sum the squared deviations")
14
5) Divide by n-1
 Divide by n-1")
15
6) Take square root of variance
 Take square root of variance")
16
Normal Distribution 68% of the data points are within 1 standard deviation of the mean: = mean + or – S.D. In the previous example, this is 31 + or – 5.42 31+5.42 = 36.42 31-5.42 = 25.58 Therefore 68% of the data will fall between 25.58 and 36.42.

17
Normal Distribution Approximately 95% of the data points are within 2 standard deviations of the mean: = mean + or – 2 S.D. In the previous example, this is 31 + or – (2 X 5.42) 31 + (2*5.42) = 41.84 31 – (2*5.42) = 20.16. Therefore 95% of the data points fall between 20.16 and 41.84. Approximately 99% of the data points fall within three standard deviations of the mean.
 31 + (2*5.42) = – (2*5.42) = Therefore 95% of the data points fall between and Approximately 99% of the data points fall within three standard deviations of the mean..")
18
Heart Rate (beats per minute) Speed (kilometers per hour) 11 12 13 14 15 16 17 Variables 165 160 155 150 145 140 135 130
 Speed (kilometers per hour) Variables")
19
Number of mammals in a 1.2 ha woodlot in Clinton County, NY Grey squirrel – 8 Red squirrels – 4 Chipmunks – 17 White-footed mice – 26 White-tailed deer – 2 Create a Graph Website: http://nces.ed.gov/nceskids/graphing/

20
Bar Graph - Mammals

21
pH of an a pond in Clinton County, NY on 5/11/05 1:00 AM – 5.2 3:00 AM – 5.1 5:00 AM – 5.1 7:00 AM – 6.0 9:00 AM – 6.6 11:00 AM – 6.9 1:00 PM – 7.0 3:00 PM – 7.0 5:00 PM – 6.6 7:00 PM – 5.9 9:00 PM – 5.3 11:00 PM – 5.2

22
Line Graph - pH

23
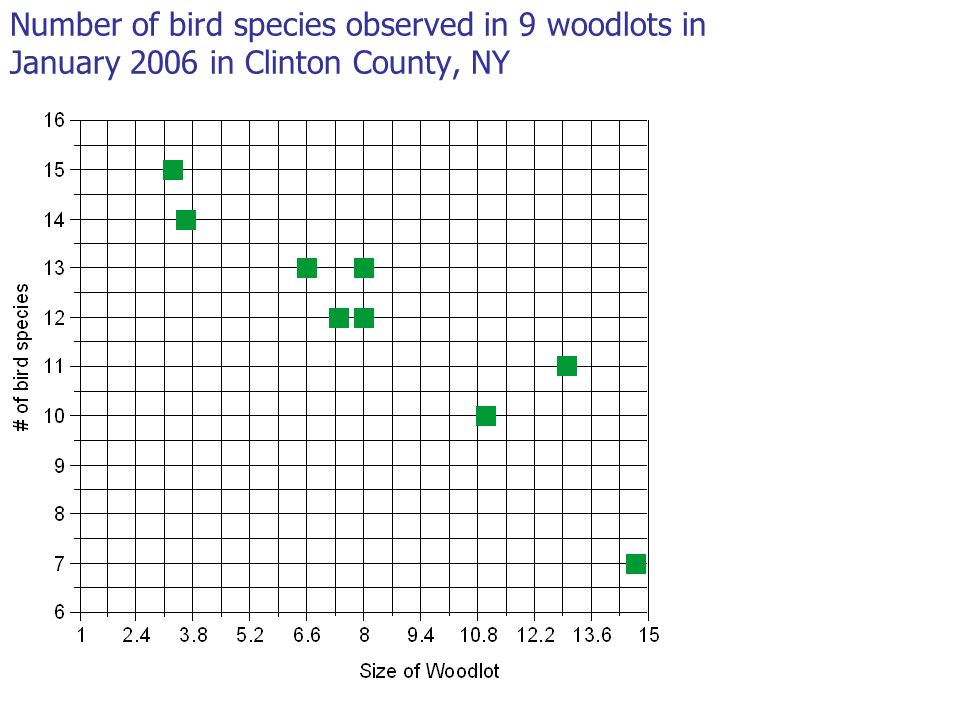
Number of bird species observed in 9 woodlots in January 2006 in Clinton County, NY Size of Woodlot (ha)# Bird Species 3.311 813 3.613 14 1.17 1114 7.412 6.614 812
# Bird Species")
24
Number of bird species observed in 9 woodlots in January 2006 in Clinton County, NY

27
Group 1 - Hormone Weight (grams) Group 2 – No Hormone Weight (grams) 12.58 138.5 128 8 137.5 1410.5 137 10.58.5 9.56.5 117 Statistical Testing Mean = 12.05 7.95
 Group 2 – No Hormone Weight (grams) Statistical Testing Mean =")
28
Conclusion P is the probability that the difference is due to chance. If p > 0.05, conclude that the difference is due to chance. If p < 0.05, conclude that the difference is real (not due to chance).
..")
29
t-test http://faculty.clintoncc.suny.edu/faculty/Michael.Greg ory/files/shared%20files/Statistics/t-test.xls http://faculty.clintoncc.suny.edu/faculty/Michael.Greg ory/files/shared%20files/Statistics/t-test.xls

Similar presentations


 Statistics Percentages (frequencies) Ratios and Rates Measures of Central Tendency Measures of Variability Descriptive statistics.>")


 Used for continuous measures Statistical Analysis of Data ______________ statistics – summarize data.>")


