Download presentation
Presentation is loading. Please wait.

1
IB Business and Management
3.2 Investment Appraisal

2
Learning Outcomes Calculate Payback Period and ARR for an Investment
Analyse the results of calculations Calculate the NPV for an investment (HL) Analyse the results of the calculations (HL)
 Analyse the results of the calculations (HL)")
3
Definition Investment appraisal is the process of businesses evaluating whether an investment is attractive Or, where alternatives exist, which option is likely to be the best.

4
Investments: tie up the firm’s finance for a long period, normally for a number of years; generate financial benefits (profits) over most or all of their useful life; often have a resale or scrap value at the end of their life. Because of the major capital outlays involved, managers try to calculate expected profitability/ cash flows for the proposed investment.
 over most or all of their useful life; often have a resale or scrap value at the end of their life. Because of the major capital outlays involved, managers try to calculate expected profitability/ cash flows for the proposed investment.")
5
Before we start looking at techniques……
Before we start looking at techniques……. Consider the following investment decision

6
Which investment should be chosen?
Investment A Investment B Investment C Initial Cost £70,000 £100,000 £200,000 Estimated Profit Generated Year 1 £10,000 £50,000 £20,000 Year 2 £40,000 £30,000 Year 3 Year 4 £60,000 Year 5 Year 6

7
Quantitative Techniques
Payback Average Rate of Return (ARR) Net Present Value (NPV)
 Net Present Value (NPV)")
8
Payback period

9
Payback This method of investment appraisal calculates how long it takes a project to repay its original investment. The shorter the payback period, the more faourable the investment It highlights investments which pay back the initial investment the quickest

10
Payback – Which Investment should be chosen?
Investment A Investment B Investment C Initial Cost £70,000 Estimated Profit Generated Year 1 £10,000 £20,000 £30,000 Year 2 Year 3 Year 4 Year 5 Year 6 £40,000 Total £130,000 £120,000 £110,000

11
Results Investment C would be chosen because it has the shortest payback time, i.e. slightly less than three years. Investment A’s payback stretches into the fifth year and Investment B’s into the fourth. Note that total income is not taken into account in this method. In fact Project C has the lowest total return over the 6 years.

12
Calculating the exact pay back period
In order to make back the £70,000 Investment we need: All of the profits from years 1-4 Plus £10,000 of the £30,000 generated in year 5 The payback period is therefore 4 years plus 10,000/30,000 In Days 10,000/30,000 X 365 = In Weeks 10,000/30,000 X 52 = In Months 10,000/30,000 X 12= Investment A Initial Cost £70,000 Estimated Profit Generated Year 1 £10,000 Year 2 Year 3 £20,000 Year 4 Year 5 £30,000 Year 6 £40,000 Total £130,000

13
Question Project A Project B Initial Cost £8,000 £6,000 Income Year 1 £3,000 £5,000 Year 2 £4,000 Year 3 £9,000 Total £17,000 £15,000 Which project should the company choose fi payback period is being used?

14
Answer Both projects have the same return over 3 years.
Project A has a payback of 2 years Project B has a payback of 1 year 3 months Therefore Project has the shortest payback time and should be chosen

15
Average Rate of Return

16
ARR- Average Rate of Return
The ARR method measures the net return each year as a percentage of the initial cost of the investment. The formula for ARR is: Average Annual Profit X 100 Initial Outlay

17
Example Project X Project Y Project Z Cost £50,000 £40,000 £90,000
Return: Year 1 £10,000 £20,000 Year 2 Year 3 £30,000 Year 4 Year 5

18
Step 1- Calculate Total Net Profit
This is total profits over the life time of the investment with the initial investment deducted £70,000 - £50,000 = £20,000 for Project X.

19
Step 2 – Calculate Annual Profit
The next step is to calculate the net profit per annum by dividing the total net profit by the number of years the project runs for £20,000 5 = £4,000 for Project X.

20
Step 3 – Calculate the ARR
Average Annual Profit X 100 Initial Outlay For Project X £4,000 x = 8% £50,000

21
Overall Results – Calculate the ARR for Project Y and Project Z
Project X Project Y Project Z Initial Cost £50,000 Total Net Profit £20,000 Net Profit per Annum £4,000 ARR 8%

22
Overall Results… Which Project should be chosen?
Project X Project Y Project Z Initial Cost £50,000 £40,000 £90,000 Total Net Profit £20,000 Net Profit per Annum £4,000 £5,000 £8,000 ARR 8% 12.5 % 8.9%

23
Come back to this decision from the start of the lesson
Investment A Investment B Investment C Initial Cost £70,000 £100,000 £200,000 Estimated Profit Generated Year 1 £10,000 £50,000 £20,000 Year 2 £40,000 £30,000 Year 3 Year 4 £60,000 Year 5 Year 6 Calculate the Payback and ARR for each of these Investments. Which one do you think should be chosen? Why?

24
Task – Practice Questions
Answer the questions: Payback and ARR Quick Questions Pilgrims Choice (Payback and ARR)
")
25
The Higher Level Stuff Net Present Value

26
Money now is more valuable than money later on…… Why?

27
Present Values So $1,000 now is the same as $1,100 next year (at 10% interest) We say the Present Value of $1,100 next year is $1,000
 We say the Present Value of $1,100 next year is $1,000.")
28
And on and on…… So…. Businesses might find it useful to know the Present Values of future profits they expect to make

29
Example Investment A promises you $90,0 00 in 3 years, what is the Present Value? To take a future payment backwards three years divide by 1.10 three times So $90,000 in 3 years is: $90,000 ÷ 1.10 ÷ 1.10 ÷ 1.10 $90,000 ÷ (1.10 × 1.10 × 1.10) = 1.103 $90,000 ÷ 1.331 $67,618 now Question: What would the difference be if only a 5% interest rate was assumed?
 = $90,000 ÷ $67,618 now. Question: What would the difference be if only a 5% interest rate was assumed")
30
Net Present Value NPV is a method of investment appraisal that take the present value of future profits/cashflows into account rather than the nominal value It therefore favours investments that bring in profits/cashflows more immediately It considers overall profitability of investments at present values

31
Making decisions using NPV
Normally the project with the highest NPV will be chosen. If the NPV is positive - cash benefits exceed cash costs - this means that the project will earn a return in excess of its cost of capital (the rate of interest/discounting used in the calculation). If the NPV is negative - this tells the managers that the cost of investing in the project exceeds the present value of future receipts, and that it is not worth investing in it.
. If the NPV is negative - this tells the managers that the cost of investing in the project exceeds the present value of future receipts, and that it is not worth investing in it.")
33
Example Question Year Project A Project B -250 1 +50 +200 2 +100 3
-250 1 +50 +200 2 +100 3 Assuming that the interest rate is 10%, calculate the NPV of both projects and decide which one would be the better investment Use the discount table

34
Example Answers (Assuming an interest rate of 10%)
Project A Returns Discount Factor Year 0 -£250 Year 1 +£50 Year 2 +£100 Year 3 +£200 Present Value 1.00 -£250 0.91 £45.50 0.83 £83 0.75 £150 Net Present Value = £28.50

35
Example Answers (Assuming an interest rate of 10%)
Project B Returns Discount Factor Year 0 -£250 Year Year 2 +£100 Year 3 +£50 Present Value 1.00 -£250 0.91 £182 0.83 £83 0.75 £37.50 Net Present Value = £52.50

36
Question (All values in £)
Year Investment A Investment B -800 -500 1 300 100 2 150 3 250 4 5 Calculate the Net Present Value for these two investments assuming a discount factor of 8%

37
Answers 1.00 0.89 0.80 0.71 0.64 0.57 Year Investment A
Discount Factor Present Value -800 1.00 1 300 0.89 267 2 0.80 240 3 0.71 213 4 0.64 192 5 0.57 171 NPV= 283

38
Answers Year Investment B Discount Factor Present Value -500 1.00 1 100 0.89 89 2 150 0.80 120 3 250 0.71 177.50 4 0.64 160 5 300 0.57 171 NPV= 217.50

39
Interpretation Purely based on NPV Investment A should be chosen with a return of £283 against a return of £ for investment B However if we look at the return as a % of the initial investment Project A = 35% whereas Project B = 44%. The company may wish to look at non-financial factors to help them make the decision

40
Task - Questions Answer the questions: NPV Quick Questions
Pilgrims Choice (NPV)
")
41
Evaluating Each method….

42
Task Each group take one method of Investment Appraisal.
Try to come up with your own list of advantages and disadvantages of each method. Payback ARR NPV

43
Payback Period Advantages and Disadvantages
it is easy to calculate and understand its use emphasises liquidity, because the calculations are based exclusively on cash flows it helps managers to reduce risk by selecting the project which recovers its outlay most quickly Limitations cash earned after the ‘payback’ is not taken into account in the decision to invest it completely ignores the potential profits that can be earned since the criterion is the speed of repayment Short-termism Doesn’t take into consideration decreasing value of money

44
Average Rate of Return Advantages and Limitations
it is simple to calculate and understand it shows clearly the profitability of an investment project it allows a better comparison of alternative projects, because it is related to the size of the initial investment outlay Can be directly compared to bank interest rates it disregards the fact that money received at a later date does not possess the same real value as money received today

45
Net Present Value Advantages and Limitations
Net Present Value takes into account that interest rates affect the present value of future income. future cashflows are discounted by a ‘discount factor’ that the firm decides on and is affected by the rate of interest It is time consuming and more difficult to calculate than payback and ARR Choosing the right discount factor can be difficult

46
What else should be taken into account?
Qualitative Factors

47
Introduction Investment Appraisal provides a scientific decision-making technique for managers However financial data do not always show the full picture, so a firm must not base its decisions solely on investment appraisal results. Other factors to be considered, and their relative importance will vary according to circumstances

48
Key Qualitative Factors
The aims of the organisation Liquidity position Reliability of data Production Requirements Personnel The economy Image/public relations Subjective factors A profit making firm will emphasise the results of an investment appraisal, companies with liquidity problems may deem payback to be the most appropriate method. A firm that places a high value on social issues might reject a profitable investment if it is considered to exploit the workforce or damage the environment. Future costs and incomes rely on the accuracy of market research and an ability to predict external changes. Particularly for investments of a longer duration, predictions can be wildly inaccurate Projects providing a high return on investment often involve risk. A firm may choose to choose a lower but more certain return The company must consider the compatibility of any new machinery with its existing range. A firm may be reluctant to deal with a new supplier if it enjoys a good service from its existing supplier. The availability of spare parts, the promise of JIT deliveries and general benefits arising from the goodwill of another company may prove to be more important than a minor financial gain Will any new equipment or method suit the companies staff? The ease of use, level of training needed, safely of the machine, impact on the number of staff employed are all factors that should be considered. Interest rates will have a major impact. If interest rates are rising, any investment will be required to generate greater profit. Future economic changes such as a boom or a recession must be considered when making predictions about future costs and revenues The firm should consider the influence of a project on its image and public relations. Ultimately individuals, who have their own personal preferences take investment decisions. In the relocation of a factory managers may take into consideration the impact on their own family and their own views on the attractiveness of an area

49
Timed IB Question – 18 minutes
Answer the Altair Incorporated question (SL students only have to do ARR and Payback. Q1 will only be worth 5 marks and only 13 minutes will be given)
")
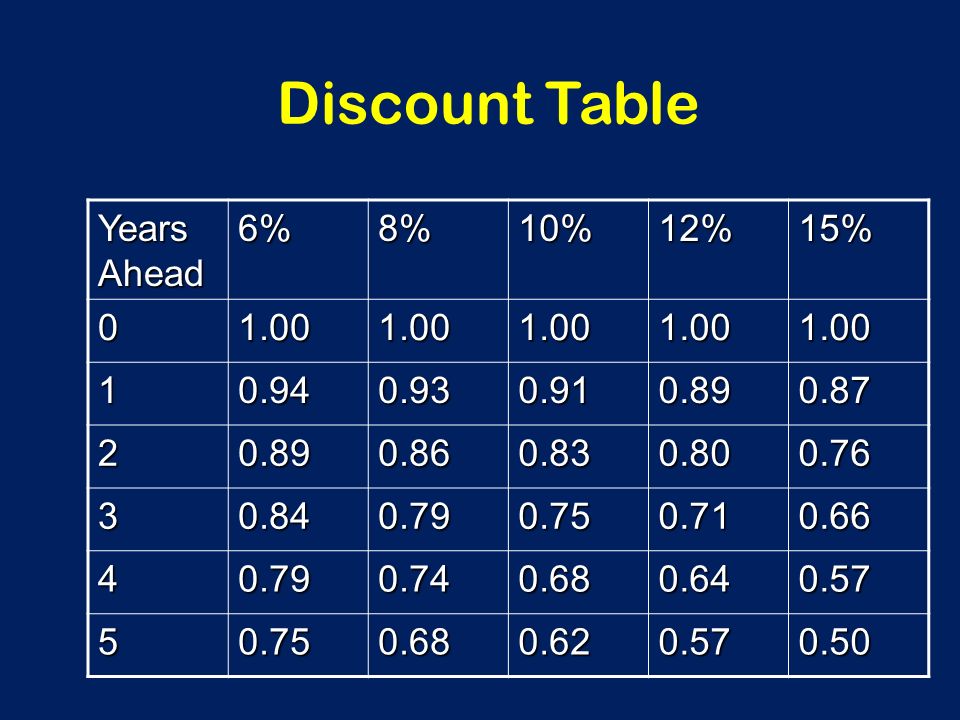
50
Discount Table Years Ahead 6% 8% 10% 12% 15% 1.00 1 0.94 0.93 0.91
1.00 1 0.94 0.93 0.91 0.89 0.87 2 0.86 0.83 0.80 0.76 3 0.84 0.79 0.75 0.71 0.66 4 0.74 0.68 0.64 0.57 5 0.62 0.50
Similar presentations


>")


>")


