Download presentation
Presentation is loading. Please wait.

1
Photosynthesis

2
Chloroplast Draw, label and function Stroma Thylakoid
Thylakoid membrane Granum Chlorophyll

3
Mesophyll tissue Draw, label and function Stomata Mesophyll
Lower/upper epidermis cuticle

4
Solar energy 42% of solar radiation passes through atmosphere and reaches the surface Visible light – used in vision and photosynthesis, makes up most of 42% Pigments (photons) absorb certain wavelengths of light – absorption spectrum
 absorb certain wavelengths of light – absorption spectrum.")
5
Absorption/Action Spectrum
Chlorophylls a, b – absorb blue and red, reflect green (why look green) Carotenoids – absorb violet-blue-green, look yellowish orange (see this in Fall leaves when chlorophyll breaks down Spectrophotometer – measures amount of light that goes through a sample, calculates how much is absorbed. Action Spectrum – use production rate of oxygen as a means to measure the rate of photosynthesis at each wavelength of light
 Carotenoids – absorb violet-blue-green, look yellowish orange (see this in Fall leaves when chlorophyll breaks down. Spectrophotometer – measures amount of light that goes through a sample, calculates how much is absorbed. Action Spectrum – use production rate of oxygen as a means to measure the rate of photosynthesis at each wavelength of light.")
6
photosynthesis C.B. van Niel – oxygen given off comes from water, not carbon dioxide (1930) Redox reaction 6CO2 + 6H2O (solar energy) yields C6H12O6 + 6O2 Carbon dioxide is reduced to a carbohydrate Water is oxidized to Oxygen
 yields C6H12O6 + 6O2. Carbon dioxide is reduced to a carbohydrate. Water is oxidized to Oxygen.")
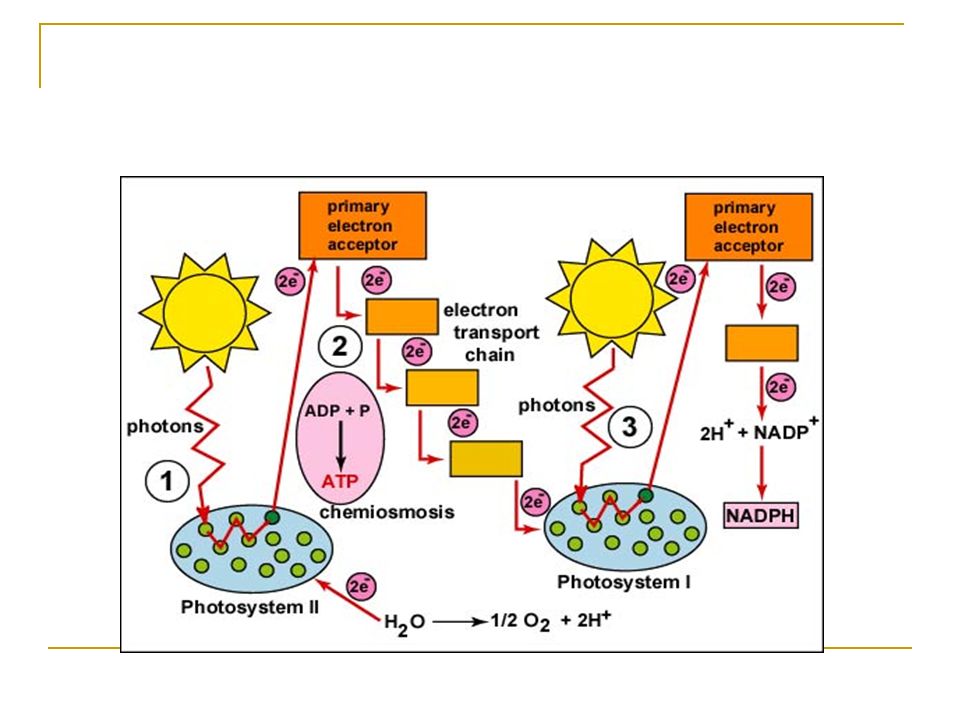
7
Reactions 1905 – F.F. Blackman – involves 2 reactions Light Reactions
Absorption of light in thylakoid membrane Electrons are energized and move down ETC Energy is captured, ATP production NADP+ is an electron carrier and becomes NADPH Calvin Cycle reactions – Stroma Carbon dioxide taken up, reduced to carb. Use energy from ATP and NADPH which return to light reaction to cycle again

8
Summary of Photosynthesis
Solar energy (sun) chemical energy (as ATP and NADPH) chemical energy (carbohydrate) That’s ALL!!
 chemical energy (as ATP and NADPH) chemical energy (carbohydrate) That’s ALL!!")
Similar presentations


 2. algae. ADP + Pi + energy* ATP* *Light energy from the sun Energy captured from sunlight This energy used to drive.>")


