Download presentation
Presentation is loading. Please wait.

1
Curtis Walker – UCAR/SOARS/SUNY Oneonta Scott Sewell – NCAR/HAO Steve Tomczyk – NCAR/HAO

2
Sun’s “Atmosphere” Sun’s “Atmosphere” ~10 ⁶ K plasma ~10 ⁶ K plasma Origin of the Solar Wind Origin of the Solar Wind Emits massive quantities of energy Emits massive quantities of energy Can only be seen naturally during total solar eclipse Can only be seen naturally during total solar eclipse Total solar eclipse, July 11, 1991, observed at Hawaii. Photo Credit: S. Koutcmy, IAP-CNRS (France)
.")
3
Instrumentation that produces a false eclipse of the sun allowing coronal observation Instrumentation that produces a false eclipse of the sun allowing coronal observation Ground-based and satellite-based varieties Ground-based and satellite-based varieties Zeiss Coronagraph at Lomnicky Peak Observatory in Slovakia Photo Credit: Steve Tomczyk LASCO Satellite Photo Credit: NASA SOHO

4
Dark Frame Corrections Dark Frame Corrections Flat Field Corrections Flat Field Corrections Aerosol Removal Aerosol Removal

6
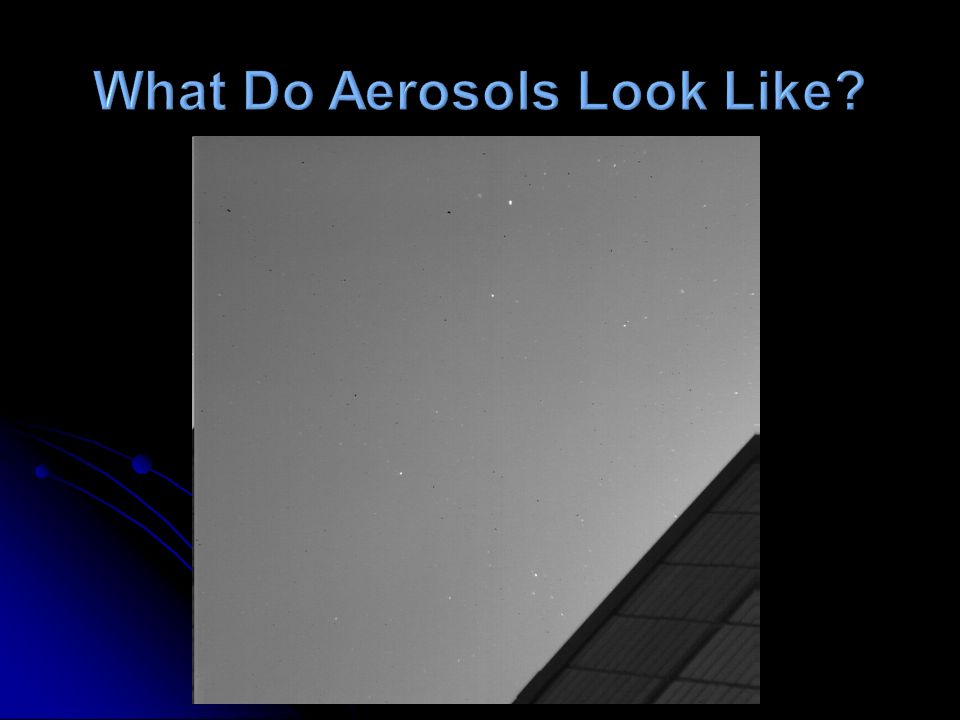
The white tracks represent aerosol trajectories over ~1s. One image from time series of 120 images.

7
Image histogram representing dynamic range of image. Adjusted image histogram showing saturated pixel spike at 4000 ADU.

8
A series of 120 images containing atmospheric aerosols were obtained in Boulder, CO on June 16, 2010. A series of 120 images containing atmospheric aerosols were obtained in Boulder, CO on June 16, 2010. The mean and median images of this time series were calculated. The mean and median images of this time series were calculated. Time Series Based Algorithm Time Series Based Algorithm Mean Time Series Algorithm Mean Time Series Algorithm Median Time Series Algorithm Median Time Series Algorithm Processing Time in both cases ~180s Processing Time in both cases ~180s

9
Mean image of all 120 images. Note the aerosol streaks near the building and at left. Median image of all 120 images. Note that the streaks disappear.

10
Image resulting from replacement of elements from mean image. Image histogram showing lack of signal above 3000 ADU.

11
Image resulting from replacement of elements from median image. Image histogram showing lack of signal above 3000 ADU.

12
Before Aerosol RemovalAfter Aerosol Removal

13
We have successfully removed aerosols from our images efficiently utilizing a pair of time series based algorithms (mean and median). We have successfully removed aerosols from our images efficiently utilizing a pair of time series based algorithms (mean and median). Future work will investigate more subtle deviations between using mean and median images (i.e. - streaks in mean image?). Future work will investigate more subtle deviations between using mean and median images (i.e. - streaks in mean image?). We will seek to optimize these algorithms to allow for real-time processing. We will seek to optimize these algorithms to allow for real-time processing.
. Future work will investigate more subtle deviations between using mean and median images (i.e. - streaks in mean image ). Future work will investigate more subtle deviations between using mean and median images (i.e. - streaks in mean image ). We will seek to optimize these algorithms to allow for real-time processing. We will seek to optimize these algorithms to allow for real-time processing..")
14
Science Mentor: Scott Sewell Science Mentor: Scott Sewell Writing Mentor: Amy Stevermer Writing Mentor: Amy Stevermer Community Mentor: Lance Jones Community Mentor: Lance Jones Peer Mentor: Theresa Aguilar Peer Mentor: Theresa Aguilar HAO Instrumental Group HAO Instrumental Group UCAR Community UCAR Community This work was performed under the auspices of the Significant Opportunities in Atmospheric Research and Science Program.

15
Image histogram spike at 4000 ADU is due to aerosol contamination. Resultant image histogram of Mean Time Series Algorithm. No signal at 4000 ADU.

16
Pixels were given a value of 0 or 1 based on threshold. Pixels were given a value of 0 or 1 based on threshold. 0 (black) if they were below two standard deviations above the mean (2-sigma). 0 (black) if they were below two standard deviations above the mean (2-sigma). 1 (white) if they were above 2-sigma. THESE WERE THE AEROSOLS! 1 (white) if they were above 2-sigma. THESE WERE THE AEROSOLS!
 if they were below two standard deviations above the mean (2-sigma). 0 (black) if they were below two standard deviations above the mean (2-sigma). 1 (white) if they were above 2-sigma. THESE WERE THE AEROSOLS. 1 (white) if they were above 2-sigma. THESE WERE THE AEROSOLS!.")
17
The white tracks represent aerosol trajectories over ~1s. Aerosol trajectories fainter, but still present after Mean Time Series Algorithm.

18
Image from LASCO Satellite on July 6, 2009. Image from Mauna Loa Solar Observatory in Hawaii on July 15, 1999.

Similar presentations


 – National Center for Atmospheric Research (NCAR) The National Center for Atmospheric Research is operated by the University.>")


 – National Center for Atmospheric Research (NCAR) The National Center for Atmospheric Research is operated by the University.>")

, G. Kopp (CU/LASP), H. Hudson (UCB/SSL)>")


