Download presentation
Presentation is loading. Please wait.

1
The Uppsala Monitoring Centre
Pharmacovigilance and the WHO Collaborating Centre for International Drug Monitoring in Uppsala Technical Briefing Seminar in Essential Medicines Policies, Geneva, October 2007 Ronald Meyboom, MD, PhD The Uppsala Monitoring Centre

2
16% of hospital admissions are drug-related (medical ward)
16% of hospital admissions are drug-related (medical ward). Nelson KM, Talbert RL. Pharmacotherapy 1996;16: Adverse drug reactions are the 5th leading cause of death in a hospital. Lazarou J. Pomeranz BH, Corey PN. JAMA 1998;279: Avoidable in ca. 50 %
. Nelson KM, Talbert RL. Pharmacotherapy 1996;16: Adverse drug reactions are the 5th leading cause of death in a hospital. Lazarou J. Pomeranz BH, Corey PN. JAMA 1998;279: Avoidable in ca. 50 %")
3
Definition of Pharmacovigilance: (WHO, 2002, ISBN 9241590157)
The science and activities relating to the detection, assessment, understanding and prevention of adverse effects or any other drug-related problems Treatment evaluation science

4
Why pharmacovigilance?
Clinical trials focus on demonstrating efficacy and tolerability (selected ‘healthy’ patients, limited in number and duration) Incomplete knowledge, e.g. effectiveness, rare but serious adverse reactions, interactions, ‘real-live’ patients, sub-populations Do not produce all the information needed for the balance of benefit and harm
 Incomplete knowledge, e.g. effectiveness, rare but serious adverse reactions, interactions, ‘real-live’ patients, sub-populations. Do not produce all the information needed for the balance of benefit and harm.")
5
How pharmacovigilance?
Spontaneous Reporting Intensive monitoring (hospital) Prescription Event Monitoring Case Control Surveillance Comprehensive population databases, data-mining Patient series Observational studies
 Prescription Event Monitoring. Case Control Surveillance. Comprehensive population databases, data-mining. Patient series. Observational studies.")
6
Formal studies Vigilance
Defined aim (identified problem) Hypothesis testing (problem solving) Established methods (clinical trial, case control, cohort) Comparison Limited in time, drugs, population, place Open question: looking for the unexpected Hypothesis generation (‘problem raising’) Exploratory, controversial (SR, PEM, CCS) No comparison Continuous, all drugs, total population
 Hypothesis testing (problem solving) Established methods (clinical trial, case control, cohort) Comparison. Limited in time, drugs, population, place. Open question: looking for the unexpected. Hypothesis generation (‘problem raising’) Exploratory, controversial (SR, PEM, CCS) No comparison. Continuous, all drugs, total population.")
9
Emphasis on Early warning Generation of knowledge Dissemination of information Rational and safe use of medicines Benefit and harm together

10
Three categories of adverse drug reactions Need different methods for detection An ABC of drug-related problems. Drug Saf 2000;22:415-23 Type A (pharmacological) Type B (hypersensitivity) Type C (more frequent in exposed than in unexposed) Clinical trial Spontaneous reporting Pharmacoepidemiologychallenge
 Type B. (hypersensitivity) Type C. (more frequent in exposed than in unexposed) Clinical trial. Spontaneous reporting. Pharmacoepidemiologychallenge.")
11
Spontaneous Reporting
A country-wide system for the reporting of suspected adverse reactions to drugs A case report is a notification from a health care professional, describing the history of a patient with a disorder that is suspected to be drug-induced Limitations because of privacy protection and medical secrecy

12
Spontaneous Reporting
When different doctors independently report the same unknown and unexpected adverse experience with a drug, this may be a valid early signal Quantitative: more frequently reported than expected from the background

13
Advantages of Spontaneous Reporting
Effective ‘All’ patients; ‘all’ drugs; many ADRs Continuous Rapid Cheap Not much health care infrastructure needed

14
Limitations of Spontaneous Reporting
Suspicions, incomplete, uncertain Underreporting is vast but unknown and variable Exposure data available? No frequency measurement Comparison of drugs difficult Insensitive to type C adverse effects Further study for signal testing and explanation

15
Data assessment in pharmacovigilance
Individual case report assessment Interest, relevance (new, serious?) Medical, pharmacological; coding Follow-up Causality assessment Aggregated study and interpretation Signal detection Risk factors, interactions Serial (clinicopathological) study Frequency estimation
 Medical, pharmacological; coding. Follow-up. Causality assessment. Aggregated study and interpretation. Signal detection. Risk factors, interactions. Serial (clinicopathological) study. Frequency estimation.")
16
e.g. possible, probable, etc
General design of systems for causality assessment Drug Safety 1997;17: Basic questions Sub-questions Scores Overall score Causality category, e.g. possible, probable, etc

17
None of the available systems has been validated (i. e
None of the available systems has been validated (i.e. shown to consistently and reproducibly gives a reasonable approximation of the truth) Validation = ‘proving that a procedure actually leads to the expected results’ No gold standard Causality category definitions
 Validation = ‘proving that a procedure actually leads to the expected results’ No gold standard. Causality category definitions.")
18
What causality assessment can do What causality assessment cannot do
Decrease disagree-ment between assessors Classify relationship likelihood (semi-quantitative) Mark individual case reports Education / improve-ment of scientific assessment What causality assessment cannot do Give accurate quantitative measurement of relationship likelihood Distinguish valid from invalid cases Prove the connection between drug and event Quantify the contribution of a drug to the development of an adverse event Change uncertainty into certainty
 Mark individual case reports. Education / improve-ment of scientific assessment. What causality assessment cannot do. Give accurate quantitative measurement of relationship likelihood. Distinguish valid from invalid cases. Prove the connection between drug and event. Quantify the contribution of a drug to the development of an adverse event. Change uncertainty into certainty.")
19
Underreporting Vast (> 90%) Unknown Variable Biased Difficult to adjust for No frequency calculation Delays signal detection

20
Hypothesis, data, arguments
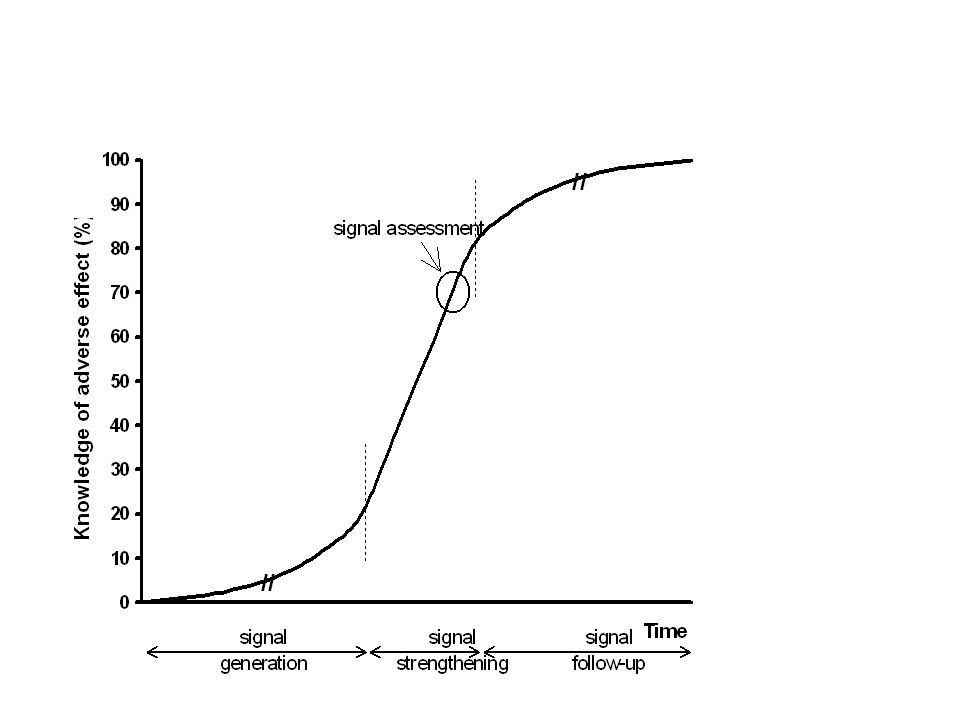
A signal is a set of data constituting a hypothesis that is relevant to the rational and safe use of a medicine Hypothesis, data, arguments Pharmacological Clinical/pathological Epidemiological Quantitative / qualitative Dynamic; develops over time Drug Safety 1997;17:

22
The balance of evidence in a signal
Quantitative strength of the association number of case reports statistical disproportionality drug exposure Consistency of the data (pattern) Exposure-response relationship site, timing, dose, reversibility Biological plausibility of hypothesis pharmacological, pathological Experimental findings e.g. dechallenge, rechallenge, blood levels, metabolites, drugdependent antibodies Analogies Nature and quality of the data objectivity, documentation, causality assessment
 Exposure-response relationship. site, timing, dose, reversibility. Biological plausibility of hypothesis. pharmacological, pathological. Experimental findings. e.g. dechallenge, rechallenge, blood levels, metabolites, drugdependent antibodies. Analogies. Nature and quality of the data. objectivity, documentation, causality assessment.")
23
Signal detection is searching for the unknown
Signal detection is searching for the unknown. The same data can lead to different conclusions. Since the truth is unknown it is uncertain who is right, but nobody is wrong! Dilemma: a signal should be early and credible at the same time Signals may consist of only a few cases and may not be statistically prominent A signal is a snapshot and changes over time Signal testing and explanation require further study Many signals remain unconfirmed scientific limitations no funding

24
WHO Collaborating Centre for International Drug Monitoring
The Uppsala Monitoring Centre Stora Torget 3, Uppsala, Sweden

25
The Uppsala Monitoring Centre
WHO Collaborating Centre for International Drug Monitoring, Geneva Moved to Uppsala after agreement between Sweden and WHO Non-profit foundation with international administrative board WHO Headquarters responsible for policy Self-financing Global pharmacovigilance

26
The Uppsala Monitoring Centre
Director: Prof Ralph Edwards Deputy director: Dr Marie Lindquist International affairs: Sten Olsson Pharmacists (Bio)medics IT specialists Financing (‘Products and Services’) Administrative Together 45
medics. IT specialists. Financing (‘Products and Services’) Administrative. Together 45.")
28
WHO International Pharmacovigilance Programme, March 2006

29
Collaboration with National Centres
Aims and activities Collaboration with National Centres World-wide collection, analysis and distribution of data Signal detection and analysis Pooling of data, comparing experiences Communication, exchange of information Technical support Development of methods and tools Improvement of pharmacovigilance around the world

30
Cumulative number of reports in ’Vigibase’

32
World-wide accumulation and assessment of data
80 participating National Pharmaco-vigilance Centres around the world 3.5 million case reports Early warning - acceleration of signal detection Early signal strengthening by comparing countries

33
Automated quantitative signal detection
Extremely large numbers of drug - adverse reaction combinations Selects automatically high-interest combinations, using quantitative disproportionality Manageable subsets of data No human time needed No investigators bias Objective, transparent, reproducible Flexible / adjustable Explorative

34
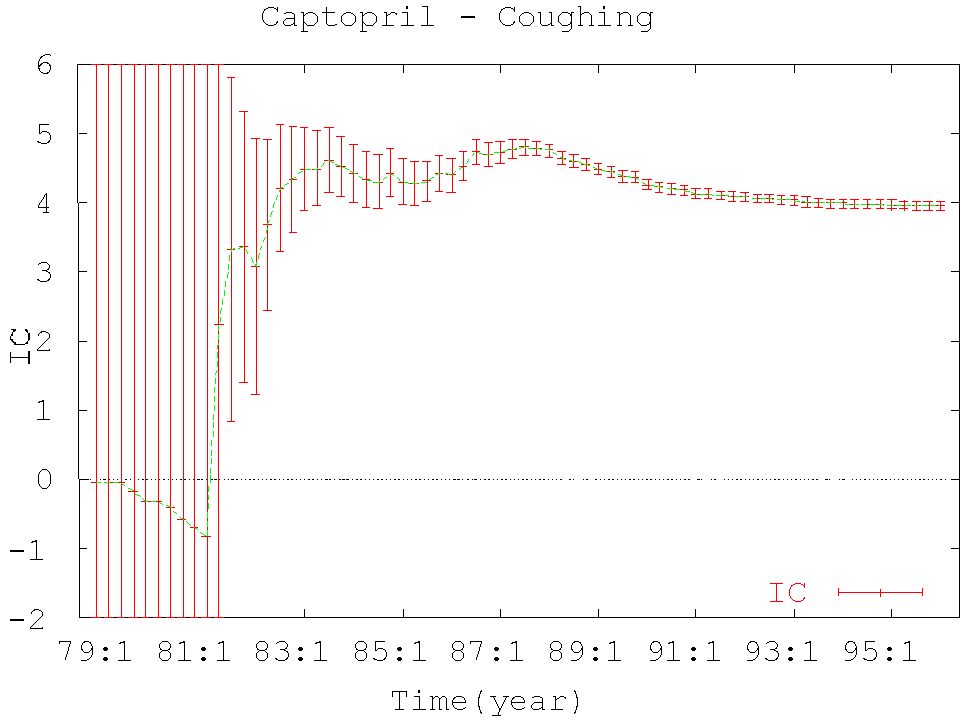
Signal detection at the Uppsala Monitoring Centre Eur J Clin Pharmacol 1998;54:315-321
A combination of Automated quantitative data mining, using Bayesian statistics and a neural network architecture (Information Component – ‘IC value’) ‘Triage’ Human assessment National Centres Review Panel UMC staff
 ‘Triage’ Human assessment. National Centres. Review Panel. UMC staff.")
35
Triage filter, combining quantitative and qualitative criteria; automatic selection of associations that IC025 > 0; two or more countries Quarterly IC increase of 2 or more New and serious (WHOART Critical Terms) Target reaction terms (e.g. SJS), two or more reports, irrespective of IC value Literature check
 Target reaction terms (e.g. SJS), two or more reports, irrespective of IC value. Literature check.")
37
SSRI Neonatal convulsions or neonatal withdrawal syndrome

38
Example of results in one Quarter (2004)
Total number of combinations: No. of associations IC025 > 0: Triage selection: No. of signals for SIGNAL:

39
Signal Review Panel 40 Experts around the world Evaluate signals, together with UMC staff and National Centres Select associations for follow-up Write signals in the SIGNAL document Preference for System Organ Class or drug group (ATC)
")
40
The SIGNAL document Sent to all National Centres (national distribution) Individualized section available to industry All recipients encouraged to comment on topics presented A WHO signal is a hypothesis together with data and arguments. A signal is not only uncertain but also preliminary in nature: the situation may change substantially over time one way or another.

41
Presentations at ISOP annual meeting 2006
HMG-CoA inhibitors and pulmonary fibrosis β-2-Adrenoceptor agonists and nocturnal enuresis Systemic effects of intranasal cortico-steroids (neuropsychiatric reactions, spontaneous abortion) Taxoids (paclitaxel and docetaxel) and myocardial infarction Hypersensitivity reactions to Umckaloabo (Pelargonium sidoides and P. reniforme) Potentiation of warfarin by glucosamine
 Taxoids (paclitaxel and docetaxel) and myocardial infarction. Hypersensitivity reactions to Umckaloabo (Pelargonium sidoides and P. reniforme) Potentiation of warfarin by glucosamine.")
42
Examples of articles Clark DW, Strandell J. Myopathy including polymyositis: a likely class adverse effect of proton pump inhibitors? Eur J Clin Pharmacol 2006;62:473-9. Sanz E, et al. Selective serotonin reuptake inhibitors in pregnant women and neonatal withdrawal syndrome. Lancet 2005;365: Coulter D, et al. Antipsychotic drugs and heart muscle disorders in international pharmacovigilance: data mining study. BMJ 2001;322:

43
Support to National Centres
Methodology Terminologies, guidelines Software (VIGIFLOW) Harmonisation, standardisation VIGIMED discussion group Annual meetings Training Books and brochures
 Harmonisation, standardisation. VIGIMED discussion group. Annual meetings. Training. Books and brochures.")
44
Terminologies, guidelines Links with WHO Geneva, CIOMS, ICH
WHOART Drug Dictionary Guidelines for setting up and running of a Pharmacovigilance Centre Herbal ATC Accepted scientific names of therapeutic plants. 2005, ISBN WHO guidelines on safety monitoring of herbal medicines

45
Harmonisation, standardisation
Definitions (Biriell C, Edwards IR. Drug Safety 1994;23:95-9) WHO causality categories Reporting adverse drug reactions. Definitions of terms and criteria for their use (CIOMS Council for International Organizations of Medical Sciences. WHO, 1999, Geneva. ISBN )
 WHO causality categories. Reporting adverse drug reactions. Definitions of terms and criteria for their use (CIOMS Council for International Organizations of Medical Sciences. WHO, 1999, Geneva. ISBN )")
46
Herbal and traditional medicines
UMC Herbals database (Dr Mohamed Farah) Herbal reviewers panel Collaboration with Uppsala University, Sweden WHO Collaborating Centre, Cape Town, South Africa Royal Botanical Garden, Kew, UK University of Exeter, UK Harvard, US
 Herbal reviewers panel. Collaboration with. Uppsala University, Sweden. WHO Collaborating Centre, Cape Town, South Africa. Royal Botanical Garden, Kew, UK. University of Exeter, UK. Harvard, US.")
47
New development areas Integrate Chinese ADR database
Patient safety focus including medication errors World Alliance for Patient Safety Improved reporting and analysis of vaccine reactions (AEFI) Flu pandemic planning Safety surveillance for other Public Health Programmes Involvement in active surveillance Cohort Event Monitoring Data mining analysis of longitudinal patient records
 Flu pandemic planning. Safety surveillance for other Public Health Programmes. Involvement in active surveillance. Cohort Event Monitoring. Data mining analysis of longitudinal patient records.")
48
Thank you for your attention

Similar presentations


>")


 Health.>")