Download presentation
Presentation is loading. Please wait.

1
DATA FROM A SAMPLE OF 25 STUDENTS ABBAB0 00BABB BB0A0 A000AB ABA0BA

2
112100127120134118105110109112 110118117116118122114 105109 107112114115118117118122106110 116108110121113120119111104111 120113120117105110118112114 DATA ON HIGH TEMPERATURES IN O F Source: The World Almanac and Book of Facts

3
DATA ON TESTING CENTER THE NUMBER OF CARDIOGRAM PERFORMED EACH DAY FOR 20 DAYS 2531203213 144325723 3632333244 3252445145

4
THE STAGES FOR STATISTICAL THINKING ARE: 1- DEFINE THE PROBLEM 2- DETERMINE WHAT DATA IS NEEDED 3- SELECT A SAMPLE 4- COLLECT DATA 5- SUMMARIZE AND ANALYZE DATA 6- MAKE INFERENCES AND DECISIONS BASED ON INFORMATION

5
The Journey to Making Decisions Begin Here: Identify the Problem DATA INFORMATION KNOWLEDGE DECISION MAKING Descriptive Statistics, Probability, Computers Experience, Theory, Literature Inferential Statistics, Computers

6
DATA: Specific observations of measured numbers. INFORMATION: Processed and summarized data yielding facts and ideas. KNOWLEDGE: Selected and organized information that provides understanding, recommendations, and the basis for decisions.

7
Descriptive Statistics include graphical and numerical procedures that summarize and process data and are used to transform data into information Descriptive Statistics include graphical and numerical procedures that summarize and process data and are used to transform data into information Inferential Statistics provide the bases for predictions, forecasts, and estimates that are to transform information to knowledge Descriptive Statistics include graphical and numerical procedures that summarize and process data and are used to transform data into information Descriptive Statistics include graphical and numerical procedures that summarize and process data and are used to transform data into information

8
USAUKARGENTINATURKEY Average3,32,72,83,9 Maximum4,54,411,98,9 Minimum0,80,2-10,9-7,5 Standard Error 1,21,06,75,8 Source: World Development Indicators (WDI) 2006 CD-ROM Comparison of the Growth Rates (1992-2005) %
 2006 CD-ROM Comparison of the Growth Rates ( ) %")
9
POPULATION: A complete set of individuals, objects or measurements having common observable characteristics. Examples of Populations - Names of all registered voters in TURKEY - Incomes of all families living in ANKARA - Annual return of all stocks traded on the ISTANBUL STOCK EXCHANGE - Grade Point Averages of all the students in your University - BILKENT

10
SAMPLE: A subset or part of a population Examples of Samples - Names of 50.000 registered voters in TURKEY - Incomes of 10.000 families living in ANKARA - Annual return of 150 stocks traded on the ISTANBUL STOCK EXCHANGE - Grade Point Averages of 500 students from different departments in your University - BILKENT

11
n: Sample N: POPULATION n: Sample

12
IR COMD POLS COMD IR Global COMD POLS IR Global Psychology IR COMD IR Psychology IR COMD IR COMD IR Psychology POLS IR POLS IR Psychology Global POLS COMD POLS IR POLS Global IR COMD POLS IR Global POLS Psychology DATA on the Departments From A SAMPLE OF 50 STUDENTS

13
The points scored during each game by a basketball team last season were: 60, 58, 65, 75, 50, 65, 60, 72, 64, 70, 58, 65, 56, 40, 68, and 55 Construct a dotplot of these data.

14
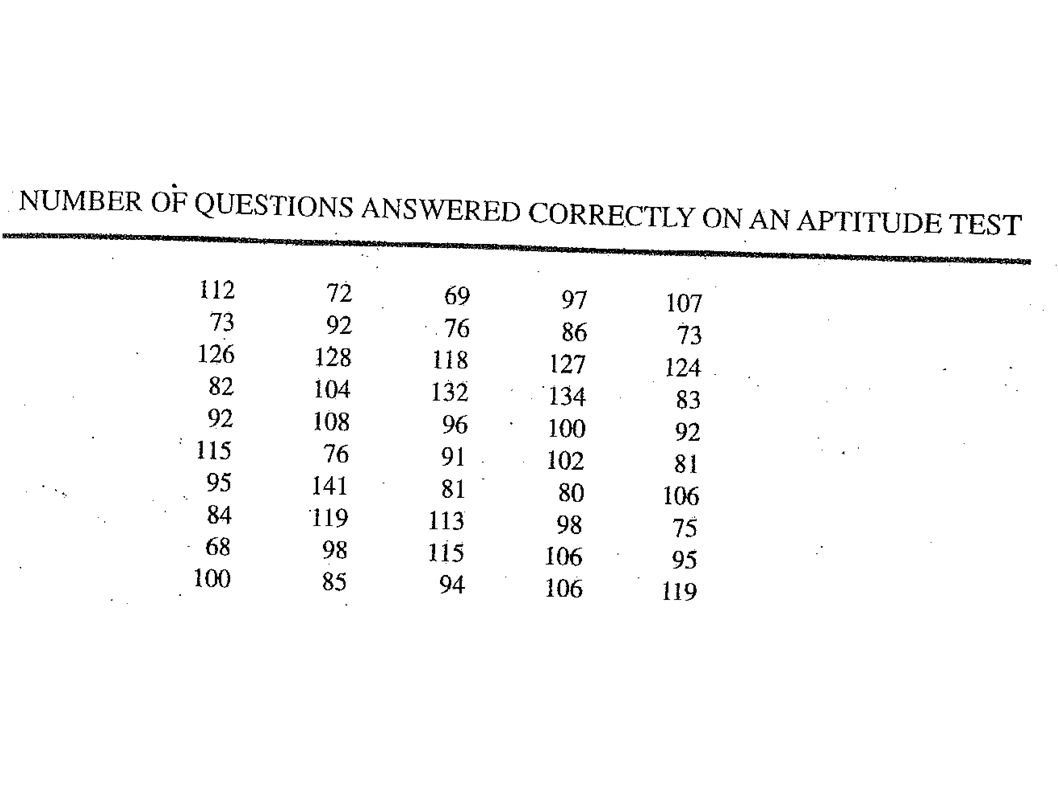
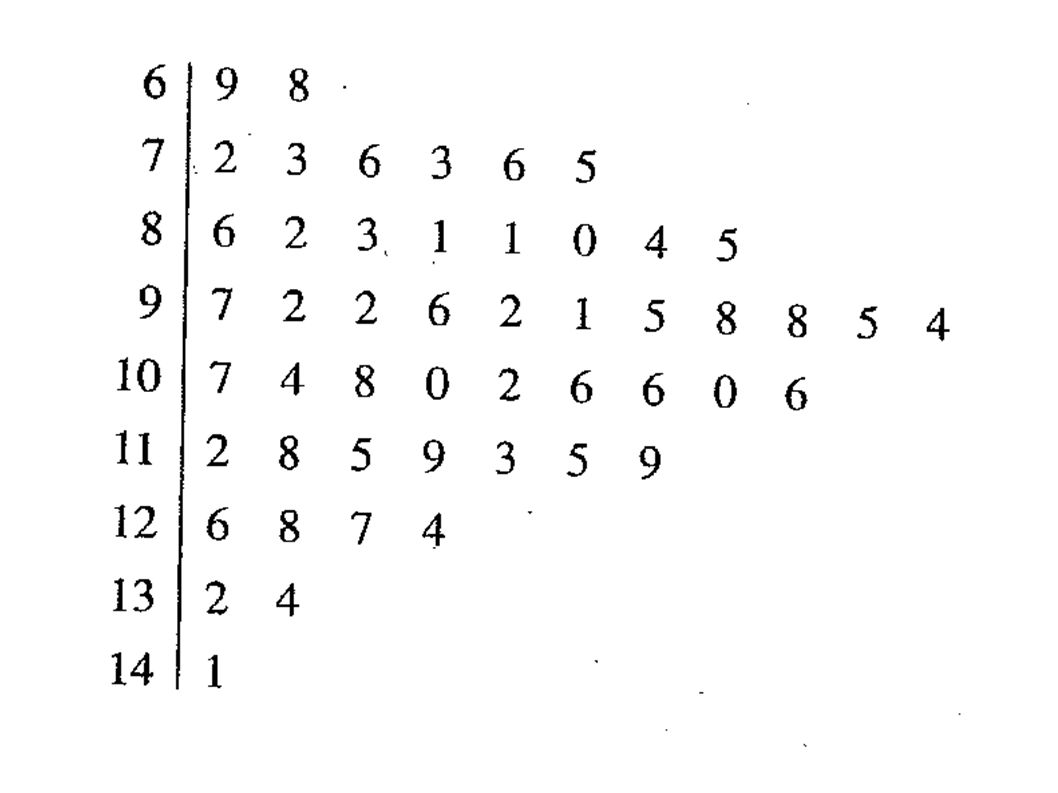
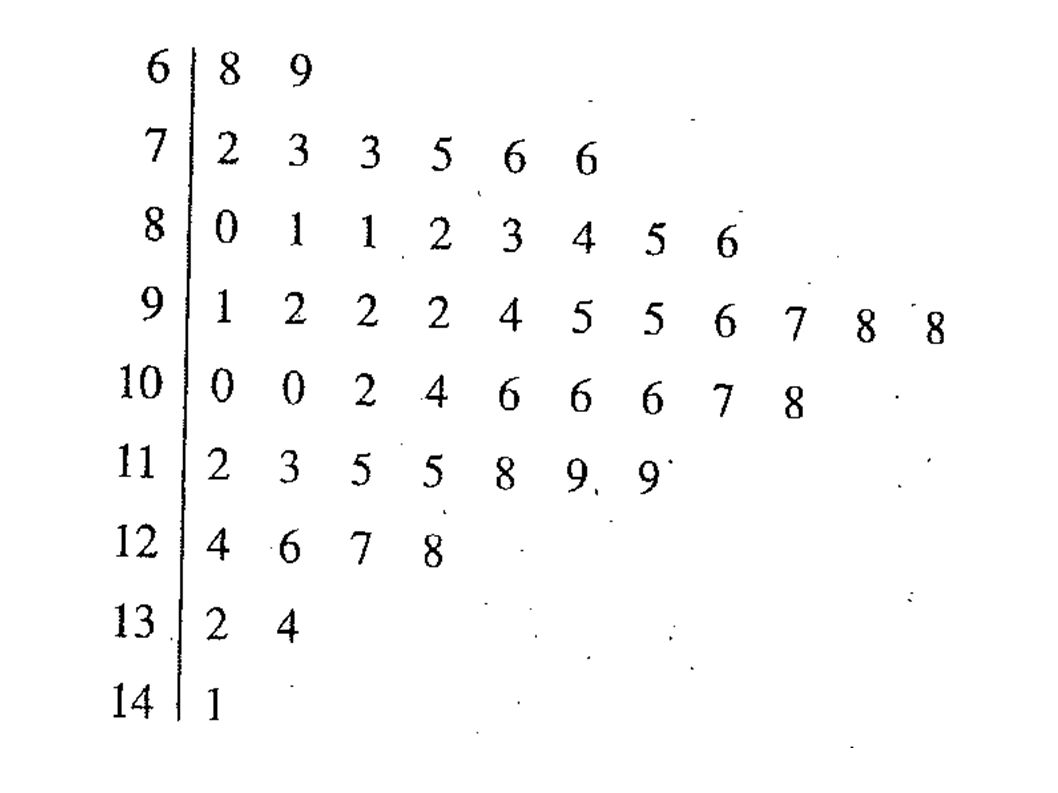
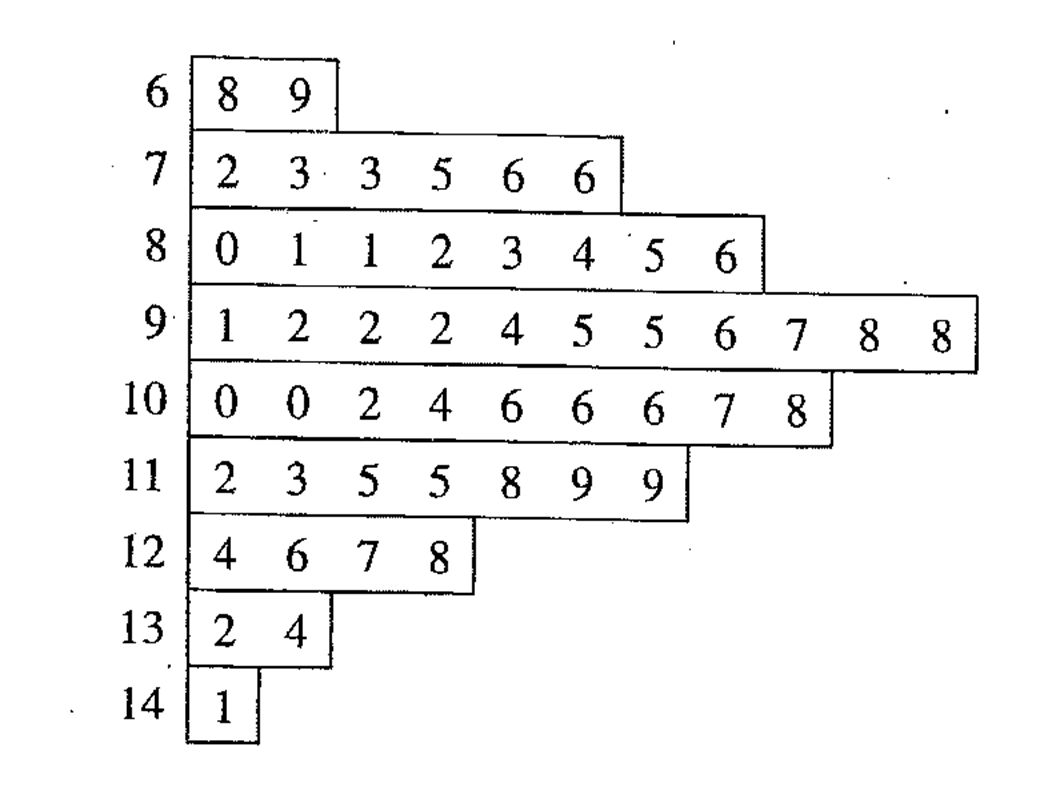
The following Table represents a sample of 50 final exam scores

15
YEAR - END AUDIT TIMES (in days) These data show the time in days required to complete year-end audit for a sample of 20 clients of a small accounting firm
 These data show the time in days required to complete year-end audit for a sample of 20 clients of a small accounting firm")
20
Annual Incomes of 10 Families Income TL 540003900037500367503525031500 25500 Family12345678910

21
MONTHLY STARTING SALARY (In TRL) GraduateMonthly Starting Salary 12,850 22,950 33,050 42,880 52,755 62,710 72,890 83,130 92,940 103,325 112,920 122,880 TOTAL: 35,280
 GraduateMonthly Starting Salary 12,850 22,950 33,050 42,880 52,755 62,710 72,890 83,130 92, , , ,880 TOTAL: 35,280")
22
Properties of the Mean 1- The Mean can be calculated for any set of NUMERICAL Data 2- The Mean is unique and unambiguous value. 3- The means of several sets of data can always be combined into the overall mean of all the data. 4- If each value in a sample were replaced by the mean, then ∑X would remain unchanged 5- The mean takes into account the value of each item in a set of data. 6- The mean is relatively reliable in the sense that means of many samples drawn from the same population generally do not fluctuate, or vary, as widely as other statistics used to estimate the mean of a population.

23
Properties of the Median In addition to the properties of the Mean; 1- It splits the data into two parts 2- The median is preferable to the mean because it is not so easily affected by extreme values.

Similar presentations