Download presentation
Presentation is loading. Please wait.

1
Richard Johnson richardj@microsoft.com

2
How can we use the visualization tools we currently have more effectively? How can the Software Development Lifecycle benefit from visualizations? What is the impact of visualizations on our software security processes?

3
What is visualization? Information transmission through imagery Why is visualization important? Visualizations utilize the mind’s most perceptive input mechanism What are the challenges in visualization? Create intuitive spatial mappings of non-spatial data Retain clarity while presenting highly dimensional data

4
Data Visualization

5
Information Visualization

6
Concept Visualization

7
Strategy Visualization

8
Metaphor Visualization

9
Problem Space Program Visualization Algorithm Visualization Sourcing Data Static vs Dynamic data Inaccurate analysis tools The goal is always: Reduce Complexity!

10
Structural Connectivity Execution & Data Flow Class Hierarchies State Machine Models Memory profile Algorithm Complexity Revision History Age and authorship Milestones in quality assurance

11
Execution tracing Code coverage Indirect relationships Dynamic dependencies Memory tracing Heap management patterns Object instances Taint propagation Environment

12
Attack Surface Area Dataflow entry points Privilege boundaries Implementation Flaws Arithmetic flaws Comparison flaws Unchecked user input Exploitability Execution environment Compiler security Reachability History Code age Author credibility

13
Hierarchical Layout Layered by order of connectedness Not for highly connected graphs

14
Circular Nodes aligned on circles Clustering

15
Orthogonal Edges aligned on axes Clustering

16
Force Directed Spring, Magnetic, and Gravitational force Packing

17
Hyperbolic Space Clarity on center focus Packing

18
Higher Dimensional Space Clarity with high connectivity Multi-level views

19
Nodes Spatial coordinates Spatial extents Color Shape Edges Color Shape Width Style

20
Nodes Spatial coordinates Spatial extents Color Shape Edges Color Shape Width Style

21
Nodes Spatial coordinates Spatial extents Color Shape Edges Color Shape Width Style

22
Observe binary interdependencies

23
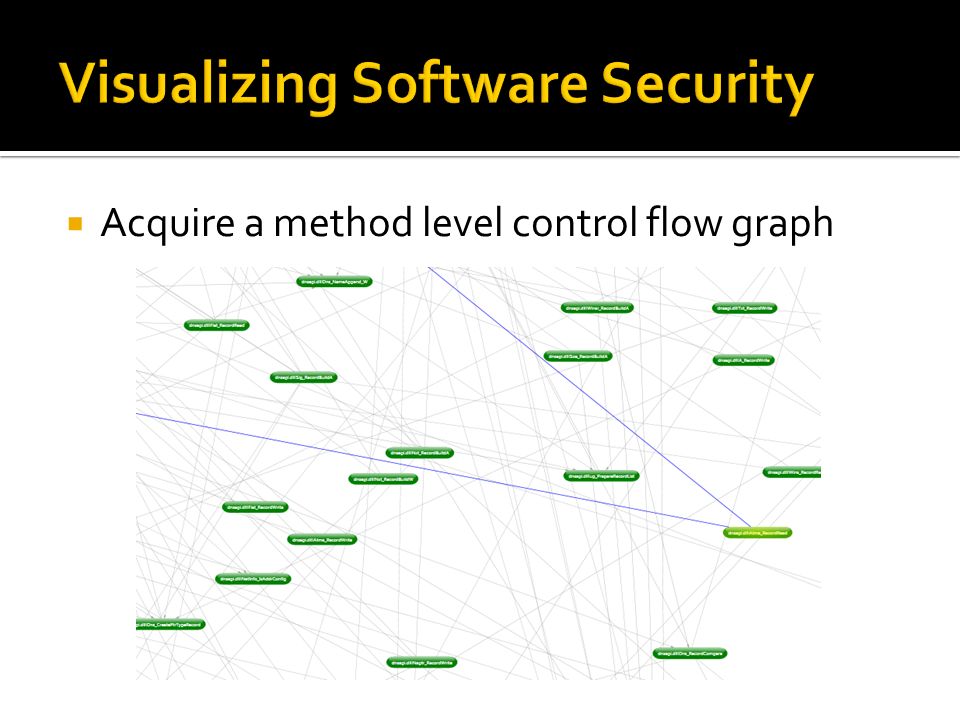
Acquire a method level control flow graph

25
Reduce graph using code coverage data

26
Trace dataflow dependency to discover taint propagation

27
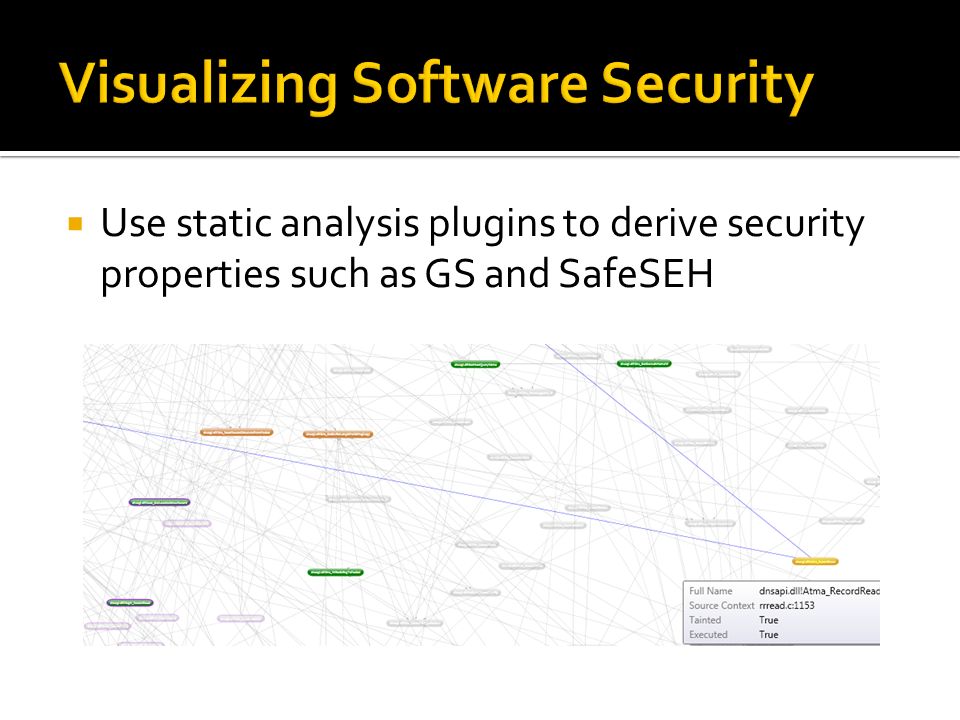
Use static analysis plugins to derive security properties such as GS and SafeSEH

29
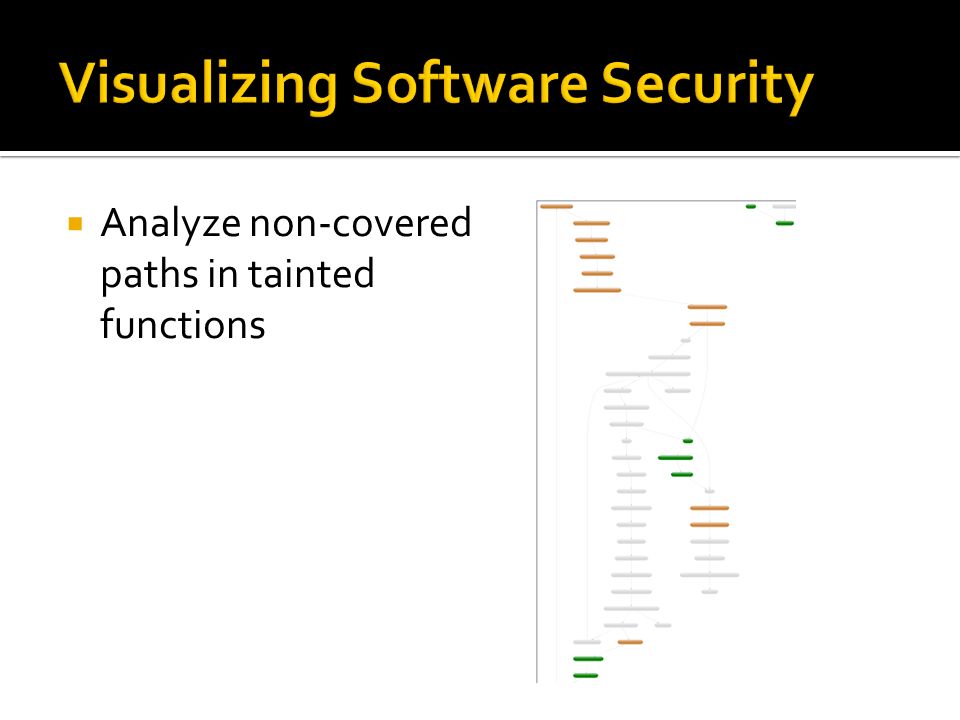
Analyze non-covered paths in tainted functions

31
Examine source code where correlations occur

32
Source Code Revision History History Flow

33
Source Code Revision History History Flow

34
State Machine Models Thinking Machine

35
State Machine Models Thinking Machine

36
Richard Johnson richardj@microsoft.com

Similar presentations


 James E. Mitchell, Ph.D. IT GIS Manager Kurt L. Johnson.>")


![1 Presented by Jean-Daniel Fekete. 2 Motivation Mélange [Elmqvist 2008] Multiple Focus Regions.](/15/4851107/big_thumb.jpg "1 Presented by Jean-Daniel Fekete. 2 Motivation Mélange [Elmqvist 2008] Multiple Focus Regions.>")


