Download presentation
Presentation is loading. Please wait.

1
Chapter 1 DATA AND PROBLEM SOLVING

2
Section 1.1 GETTING STARTED

3
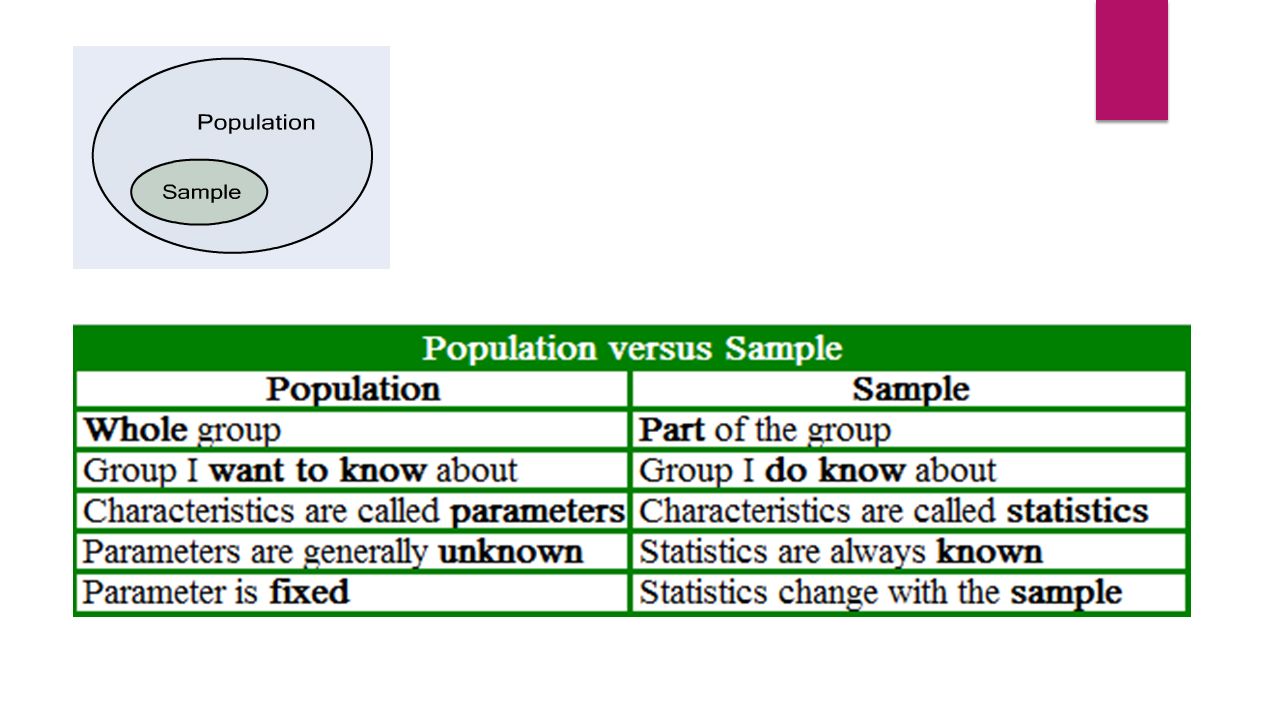
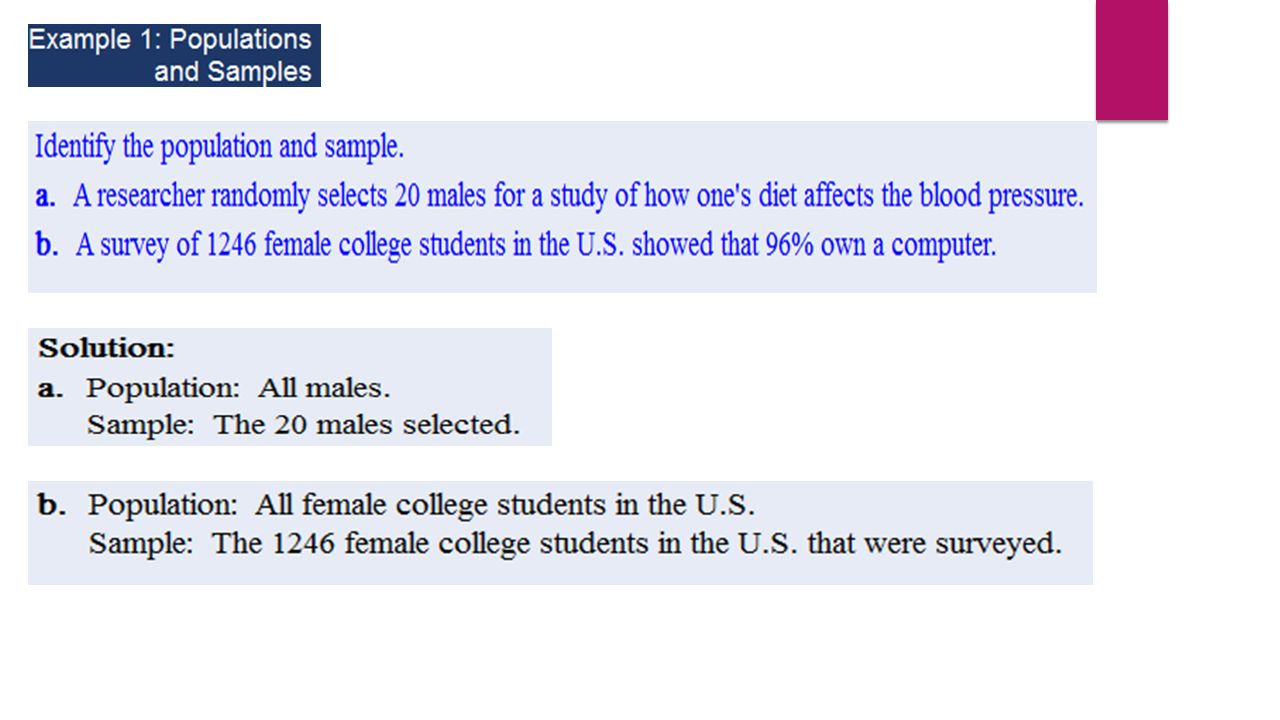
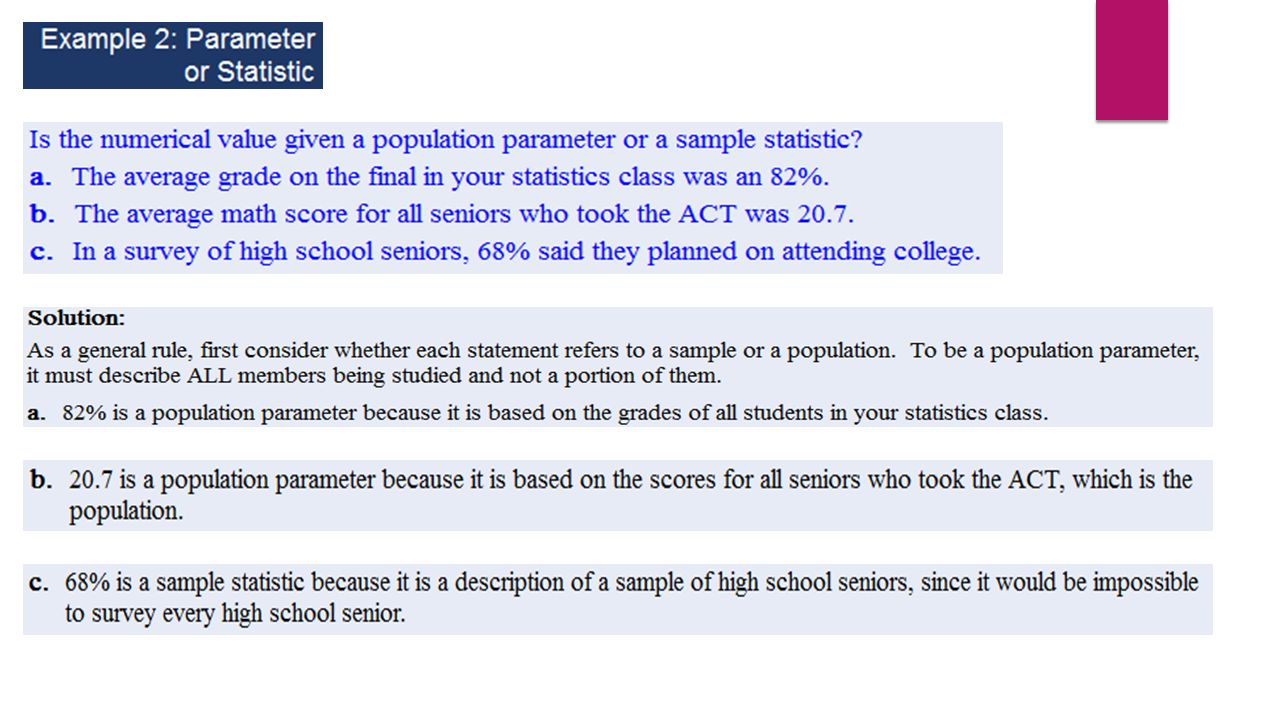
Vocabulary Statistics – The science of gathering, describing and analyzing data or the actual numerical descriptions of sample data. Population – The particular group of interest. Data – Information prepared for a study Census – When data is obtained from every member of the population. Parameter – A numerical description of a particular population characteristic. Sample – A subset of the population from which data is collected. Sample Statistic – The actual numerical description of a particular sample characteristic.

7
Two Types of Statistics Descriptive Statistics – Inferential Statistics -

8
Example 3 Descriptive

9
Example 4 Inferential

10
Section 1.2 LEVEL OF MEASUREMENT

11
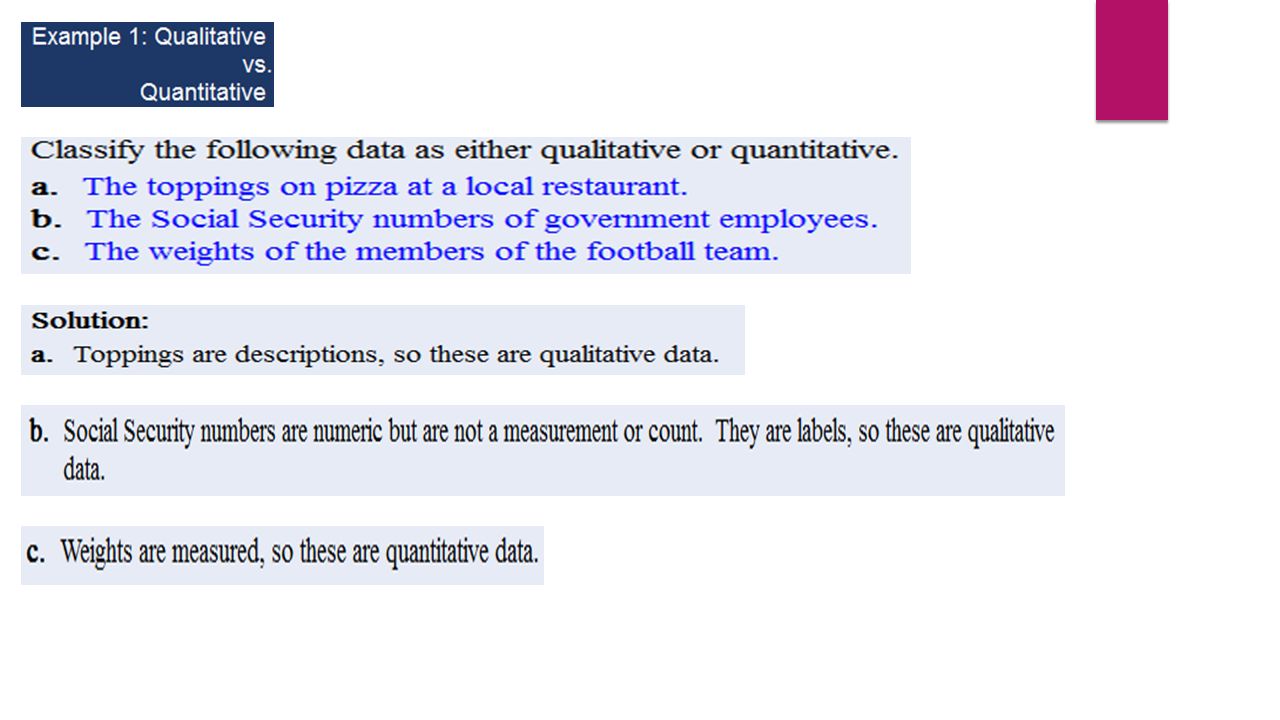
Qualitative vs. Quantitative Labels or descriptions of traits of the sample Categorical Examples Foods Places Colors Identification Numbers Counts and measurements Numerical Examples Test scores Average rainfall Median heights

13
Continuous vs. Discrete Data that can take any value within an interval Cannot be counted Examples Measurements Time Temperature Data that refers to individual data that is countable Can be counted Examples Number of pets

15
Levels of Measurement

17
Example 1 Qualitative Neither Nominal

18
Example 2 Quantitative Continuous Ratio

19
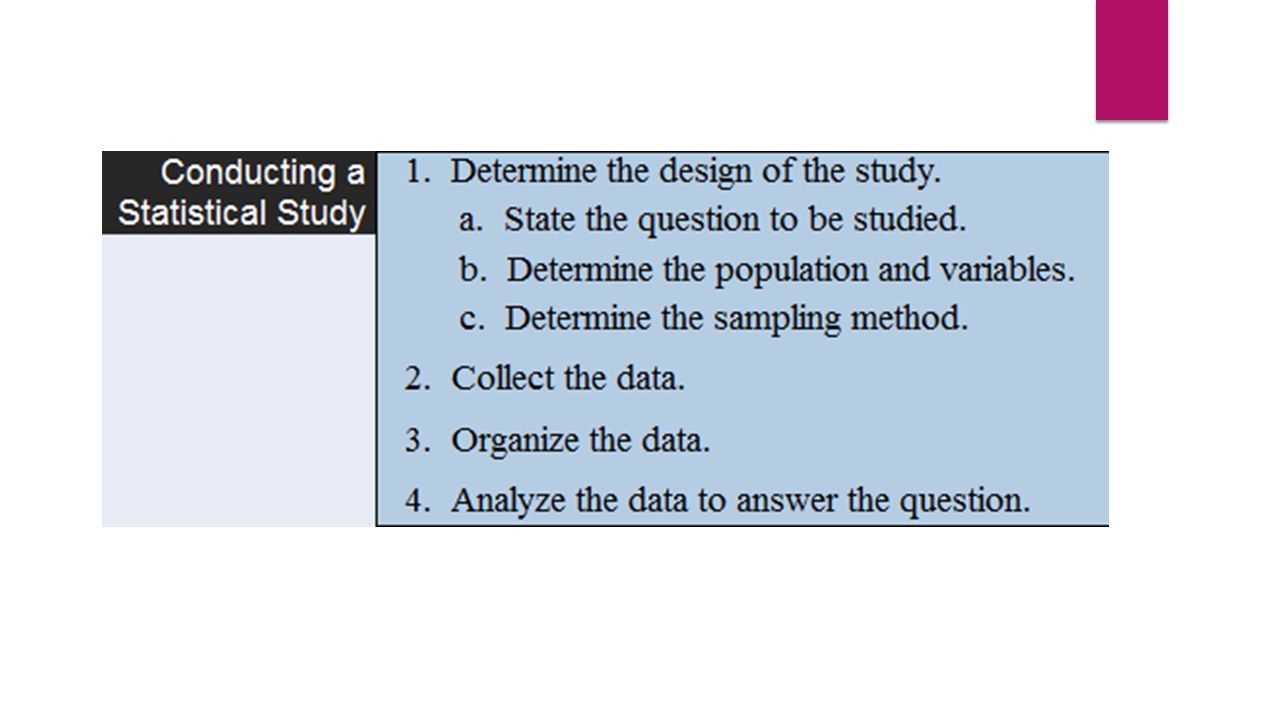
Section 1.3 THE PROCESS OF A STATISTICAL STUDY

21
Ways to Collect Data

22
Sampling Methods Random Every member of the population has an equal chance of being selected. Example: Drawing names from a hat. Stratified The population is divided into groups based on a characteristic, then members from each group are chosen randomly. Example: Separating students by class, then randomly choosing 5 from each class. Cluster The population is divided into groups that are similar to the population, then groups are chosen at random to sample. Example: Dividing students so there are 10 of each class in a group, then choosing 2 groups to sample.

23
Sampling Methods cont. Systematic The population is aligned in no specific order then every nth member is chosen. Example: Choosing every 5 th person. Convenience Choosing a sample the is “convenient” to the researcher. Example: Teacher surveying students from one of their classes to represent the population.

26
Types of Studies

27
Single-blind vs. Double-blind

28
Additional Vocabulary

30
Section 1.4 THE REALITY OF CONDUCTING A STUDY

31
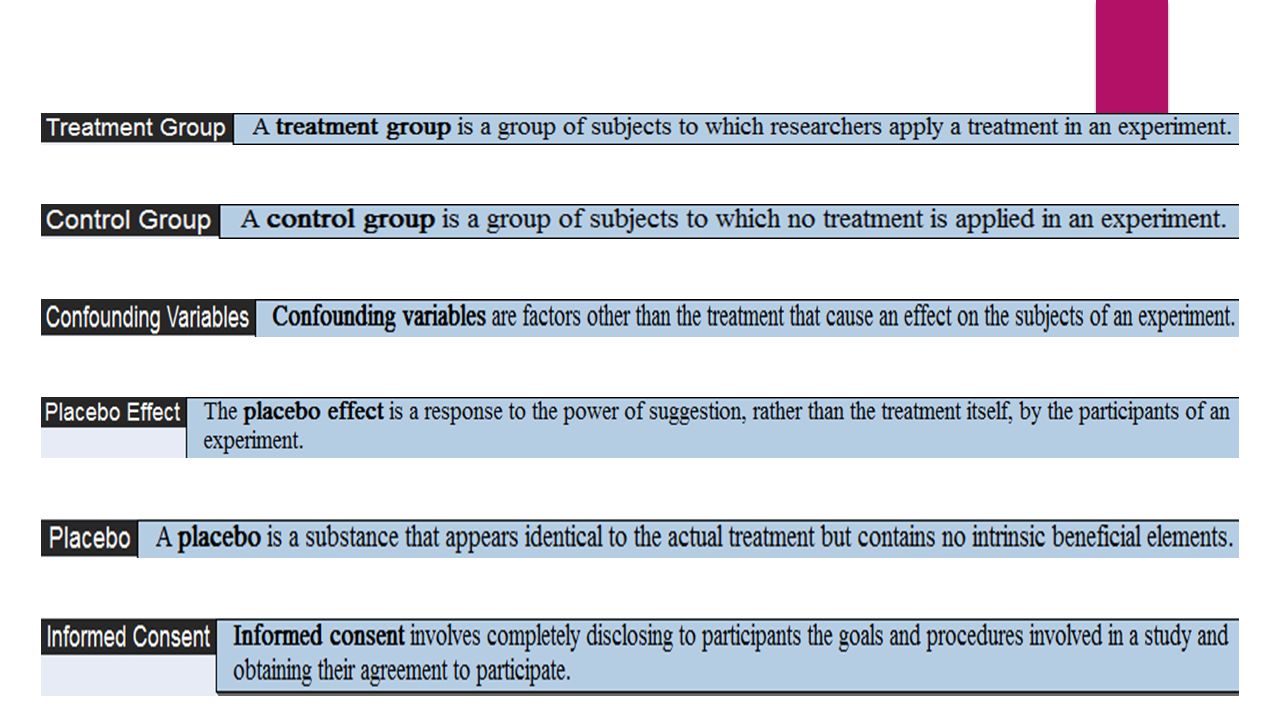
Institutional Review Board A group of people who review the design of a study to make sure that it is appropriate and the no unnecessary harm will come to the subjects involved.

32
Ethical and Practical Concerns Informed Consent Completely disclosing to participants the goals and procedures involved in a study and obtaining their agreement to participate. Biased A study tends to favor certain results Researcher Bias When the researcher influences the results of the study to favor a certain outcome.

33
Sampling Errors Errors resulting from the way the sample is chosen Dropout A participant who begins the experiment but then fails to complete it. Participation Bias When there is a problem with either the participation – or lack thereof – of those chosen for the study.

34
Non-sampling Errors Occur from sources other than the construction of the sample. Processing Errors A type of non-sampling error that occurs in the reporting, could be a typo in the data set.

35
Non-adheres Subjects who stray from the directions they were given, but remain in the sample to the end. Confounding Variables Variables that the researcher did not account for.

Similar presentations


 from numerical information, data, obtained in.>")


