Download presentation
Presentation is loading. Please wait.

1
Nuclear Magnetic Resonance in Structural Biology Part I the physical principle the physical principle the spectrometer the spectrometer the NMR spectrum the NMR spectrum the applications (what you can do) the applications (what you can do) the sample the sample the limits (what you cannot do) the limits (what you cannot do) protein structure calculation protein structure calculation references references
 the applications (what you can do) the sample the sample the limits (what you cannot do) the limits (what you cannot do) protein structure calculation protein structure calculation references references")
2
Nuclear Magnetic Resonance in Structural Biology Part II Journal Club A zinc clasp structure tethers lck to T cell coreceptors CD4 and CD8. P.W Kim, Z.J. Sun, S. C. Blacklow, G. Wagner, M. J. Eck Science 301(19 Sept): 1725-1728 (2003) (the PDF file can be downloaded from www.sciencemag.org)
: (2003) (the PDF file can be downloaded from")
3
The physical principle B (magnetic field) Energy nuclear spin, I=½ +½+½ -½-½ = B/2 At B=11.7 T (tesla, 10 4 Gauss) the resonant frequency for 1 H is 500 MHz (earth magnetic field = 30-60 T; magnetic stirrer = 0.1 T) In NMR, excitation is achieved through short ( s) electromagnetic (radio-frequency) pulses. The E is very small (10 -2 cal) low population difference low sensitivity
 low population difference low sensitivity.")
4
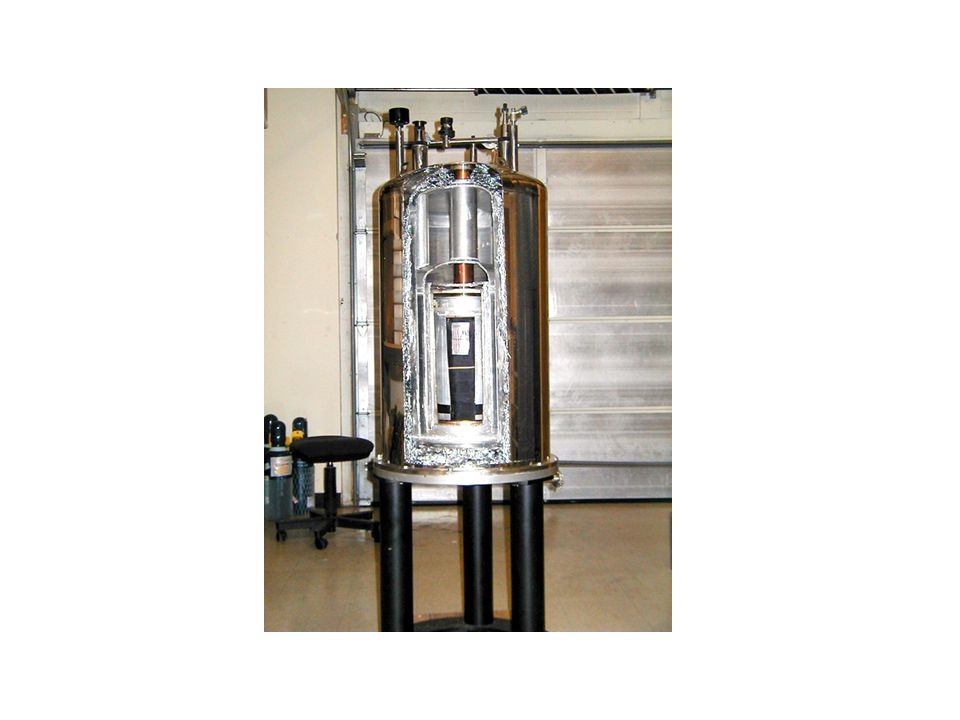
The spectrometer

9
The NMR spectrum In biomolecules (proteins, nucleic acids, peptides, oligosaccharides,...) the information available is contained in the NMR-active nuclei and limited by their natural abundance and sensitivity: 1 H (99.98%) 12 C (98.93%) not active 14 N (99.63%) not detectable 16 O (99.76%) not active 32 S (94.93%) not active 31 P (100%) limited use resonant frequency (chemical shift, ppm) signal intensity J-couplings (spin-spin interactions through covalent bonds) lineshape
 the information available is contained in the NMR-active nuclei and limited by their natural abundance and sensitivity: 1 H (99.98%) 12 C (98.93%) not active 14 N (99.63%) not detectable 16 O (99.76%) not active 32 S (94.93%) not active 31 P (100%) limited use resonant frequency (chemical shift, ppm) signal intensity J-couplings (spin-spin interactions through covalent bonds) lineshape")
10
Other useful nuclei used in NMR 1 H 1/2 99.98 1.00 1.00 100.000 2 H 1 1.5x10 -2 9.65x10 -3 1.45x10 -6 15.351 13 C 1/2 1.108 1.59x10 -2 1.76x10 -4 25.144 14 N 1 99.63 1.01x10 -3 1.01x10 -3 7.224 15 N 1/2 0.37 1.04x10 -3 3.85x10 -6 10.133 19 F 1/2 100 0.83 0.83 94.077 23 Na 3/2 100 9.25x10 -2 9.25x10 -2 26.451 31 P 1/2 100 6.63x10 -2 6.63x10 -2 40.481 113 Cd 1/2 12.26 1.09x10 -2 1.33x10 -3 22.182 isotopeIabundance(%) sensitivity (relative) sensitivity (absolute) Frequency (MHz) at 2.3488
 sensitivity (relative) sensitivity (absolute) Frequency (MHz) at")
11
The chemical shift The chemical shift depends on: the atom type (NH, aliphatic CH, aromatic CH,...) the amino acid type (Ala, Phe,...) the chemical (spatial) environment The resonant frequency of a certain atom is called chemical shift. For convenience, the chemical shift is expressed as follows: (sample) – (reference) spectrometer frequency (ppm) = 10 6 Advantages: more compact annotations independent on the spectrometer field In practice, the 1 H chemical shifts are in the range 0-10 ppm
 – (reference) spectrometer frequency (ppm) = 10 6 Advantages: more compact annotations independent on the spectrometer field In practice, the 1 H chemical shifts are in the range 0-10 ppm.")
12
The 1D spectrum of a peptide N H C H CN OH CH2CH2 8 7 6 5 4 3 2 ppm

13
The assignment problem Which resonance corresponds to which atom? N H C H CN OH CH3CH3 C H H3CH3C through-bonds magnetization transfer (J-couplings) through-space magnetization transfer (NOE)
 through-space magnetization transfer (NOE).")
14
The 2D spectrum The information contained in 1D spectra can be expanded in a second (frequency) dimension 2D NMR In a 1D experiment a resonance (line) is identified by a single frequency: NH(f1 nh ) In 2D spectra, a resonance (cross-peak) is identified by two different frequencies: NH (f1 nh, f2 ha ) Usually, the second frequency depends on how the NMR experiment is designed. f1 f2

15
The 2D spectrum of a peptide (DQF-COSY) Ac-GRGGFGGRG-NH 2 N H C H CN OH CH 2 Ph
 Ac-GRGGFGGRG-NH 2 N H C H CN OH CH 2 Ph")
16
The 2D spectrum of a peptide (TOCSY) Ac-GRGGFGGRG-NH 2 N H C H CN OH CH2CH2 CH2CH2 CH2CH2 ~
 Ac-GRGGFGGRG-NH 2 N H C H CN OH CH2CH2 CH2CH2 CH2CH2 ~")
17
The 2D spectrum of a peptide (ROESY) Ac-GRGGFGGRG-NH 2 + N H C H CN O H CH 2 ~ + + + + + + + +
 Ac-GRGGFGGRG-NH 2 + N H C H CN O H CH 2 ~")
18
The NMR experiment as a black box ? sampleNMR spectrum ? Playing around with r.f. pulses (and magnetization): power length ( s) phase (x, -x, y, -y) receiver phase (x, -x, y, -y) time delays p1 p2 p3 detection (s) t1t1 t2t2 exp-1 exp-2 exp-3....
: power length ( s) phase (x, -x, y, -y) receiver phase (x, -x, y, -y) time delays p1 p2 p3 detection (s) t1t1 t2t2 exp-1 exp-2 exp")
19
The 2D spectrum of a protein (NOESY) Practical applications of 2D homonuclear NMR are limited by peak overlap.
 Practical applications of 2D homonuclear NMR are limited by peak overlap.")
20
From 1D to 2D and 3D NMR nuclear magnetic resonancein structural biology, part Inuclear magnetic resonance1D in structural biology, part I nuclear magnetic resonance2D jhjhkhshhkhsh hkjlshjhkhkfh kshhhjhfkjshd fkhkhfkjhfkjhf khkjfhkhfkhjh hdjfhjkfhooye ywuhiwhuiyur ihuifhjkhkjhfk hfkhkfhkhfkd 3D qwertyuiopasdfghjklzxc vbnmmfgcbfhutsfvcjkuo pklmnvtfsrwdaexvvhjny oihpjklmghvgydgstsrfcv xmgjbiurytgcbdmlocpuh gfdbvfnhwtadgffkvpok mncbdhjirurteysjbbnvn mvm,kfjvnjhvnlvmlpou khggfdtrebvxlkhjiuyiuth gdkljh,mbnbvjkfjidhop[i iuyiouykjgmhvb yuhgjvnmhkhltofuygdh dvcbdgdteurhgfnvkgbljp uoytkfdjsgsfxbgksghefi uonvohfoonvouebn]pup nvjpibujnvupiwuenvjvit ugoivnoiuevboviuvnidji uefnbvoipuefpjw\pwjnv uiepnuupeoiunveuoprue vnu\envop\eiunv\uerpun evuroientevotumjhjkhkh khhgkhskghkhgkhk iubpIYPNoeyroWENV[ Ouet[NBW[OUVWE[O RTONV[ENIUSDUHO SHFOOHWEBYORCB NYUhoevoeurnuoiauvn [uoiunveuoinjljglkjnboi ue[iewutnb’j\ivnldjfn;oi envjelinreeijn\pjseipjnbt j’nb’ipjtnmvj’pjntb’jpfg mvpjgnjpjrepjtn’piunbjn jtjnpbiuntbjtjtn’jinpt hjebrhyovnobehro;vubr[ oui’nejtbnoi\psetn;jklsdj fnijnl’bjsg/.kxjg’pojtn’j b\g;kntbjlgjgz’nljg’lz;nj b/\jsjgnp’jrpijn’\rjgpkdj gpiuntbjgpjmg’j’ptg\ubi nouroytino\btoiutn0847 08nbujgoiuremtiubn’u[0 4un’uginbj;tlijmrzv’ijrtn zijr;tojn;rzj;zordjtino’ab jmrujtirnb’iurnb’an
![From 1D to 2D and 3D NMR nuclear magnetic resonancein structural biology, part Inuclear magnetic resonance1D in structural biology, part I nuclear magnetic resonance2D jhjhkhshhkhsh hkjlshjhkhkfh kshhhjhfkjshd fkhkhfkjhfkjhf khkjfhkhfkhjh hdjfhjkfhooye ywuhiwhuiyur ihuifhjkhkjhfk hfkhkfhkhfkd 3D qwertyuiopasdfghjklzxc vbnmmfgcbfhutsfvcjkuo pklmnvtfsrwdaexvvhjny oihpjklmghvgydgstsrfcv xmgjbiurytgcbdmlocpuh gfdbvfnhwtadgffkvpok mncbdhjirurteysjbbnvn mvm,kfjvnjhvnlvmlpou khggfdtrebvxlkhjiuyiuth gdkljh,mbnbvjkfjidhop[i iuyiouykjgmhvb yuhgjvnmhkhltofuygdh dvcbdgdteurhgfnvkgbljp uoytkfdjsgsfxbgksghefi uonvohfoonvouebn]pup nvjpibujnvupiwuenvjvit ugoivnoiuevboviuvnidji uefnbvoipuefpjw\pwjnv uiepnuupeoiunveuoprue vnu\envop\eiunv\uerpun evuroientevotumjhjkhkh khhgkhskghkhgkhk iubpIYPNoeyroWENV[ Ouet[NBW[OUVWE[O RTONV[ENIUSDUHO SHFOOHWEBYORCB NYUhoevoeurnuoiauvn [uoiunveuoinjljglkjnboi ue[iewutnb’j\ivnldjfn;oi envjelinreeijn\pjseipjnbt j’nb’ipjtnmvj’pjntb’jpfg mvpjgnjpjrepjtn’piunbjn jtjnpbiuntbjtjtn’jinpt hjebrhyovnobehro;vubr[ oui’nejtbnoi\psetn;jklsdj fnijnl’bjsg/.kxjg’pojtn’j b\g;kntbjlgjgz’nljg’lz;nj b/\jsjgnp’jrpijn’\rjgpkdj gpiuntbjgpjmg’j’ptg\ubi nouroytino\btoiutn nbujgoiuremtiubn’u[0 4un’uginbj;tlijmrzv’ijrtn zijr;tojn;rzj;zordjtino’ab jmrujtirnb’iurnb’an](http://images.slideplayer.com/24/7463804/slides/slide_20.jpg "From 1D to 2D and 3D NMR nuclear magnetic resonancein structural biology, part Inuclear magnetic resonance1D in structural biology, part I nuclear magnetic resonance2D jhjhkhshhkhsh hkjlshjhkhkfh kshhhjhfkjshd fkhkhfkjhfkjhf khkjfhkhfkhjh hdjfhjkfhooye ywuhiwhuiyur ihuifhjkhkjhfk hfkhkfhkhfkd 3D qwertyuiopasdfghjklzxc vbnmmfgcbfhutsfvcjkuo pklmnvtfsrwdaexvvhjny oihpjklmghvgydgstsrfcv xmgjbiurytgcbdmlocpuh gfdbvfnhwtadgffkvpok mncbdhjirurteysjbbnvn mvm,kfjvnjhvnlvmlpou khggfdtrebvxlkhjiuyiuth gdkljh,mbnbvjkfjidhop[i iuyiouykjgmhvb yuhgjvnmhkhltofuygdh dvcbdgdteurhgfnvkgbljp uoytkfdjsgsfxbgksghefi uonvohfoonvouebn]pup nvjpibujnvupiwuenvjvit ugoivnoiuevboviuvnidji uefnbvoipuefpjw\pwjnv uiepnuupeoiunveuoprue vnu\envop\eiunv\uerpun evuroientevotumjhjkhkh khhgkhskghkhgkhk iubpIYPNoeyroWENV[ Ouet[NBW[OUVWE[O RTONV[ENIUSDUHO SHFOOHWEBYORCB NYUhoevoeurnuoiauvn [uoiunveuoinjljglkjnboi ue[iewutnb’j\ivnldjfn;oi envjelinreeijn\pjseipjnbt j’nb’ipjtnmvj’pjntb’jpfg mvpjgnjpjrepjtn’piunbjn jtjnpbiuntbjtjtn’jinpt hjebrhyovnobehro;vubr[ oui’nejtbnoi\psetn;jklsdj fnijnl’bjsg/.kxjg’pojtn’j b\g;kntbjlgjgz’nljg’lz;nj b/\jsjgnp’jrpijn’\rjgpkdj gpiuntbjgpjmg’j’ptg\ubi nouroytino\btoiutn nbujgoiuremtiubn’u[0 4un’uginbj;tlijmrzv’ijrtn zijr;tojn;rzj;zordjtino’ab jmrujtirnb’iurnb’an")
21
The NMR spectrum In biomolecules (proteins, nucleic acids, peptides, oligosaccharides,...) the information available is contained in the NMR-active nuclei and limited by their natural abundance. We can “add” information to the system replacing inactive/undetectable nuclei with active ones. This is called “labeling”. In fact, it should be called “isotopic enrichment” or “isotope abundance reversal”. These are naturally occurring isotopes! 1 H (99.98%) 12 C (98.93%) not active 13 C 14 N (99.63%) not detectable 15 N The additional active nucleus can be used to: “label” 1 H atoms with the frequency of the attached heteroatom ( 1 H- 15 N; 1 H- 13 C) transfer magnetization through covalents bonds using heteronuclear J-couplings
 12 C (98.93%) not active 13 C 14 N (99.63%) not detectable 15 N The additional active nucleus can be used to: label 1 H atoms with the frequency of the attached heteroatom ( 1 H- 15 N; 1 H- 13 C) transfer magnetization through covalents bonds using heteronuclear J-couplings.")
22
A 2D 1 H- 15 N heteronuclear NMR spectrum (HSQC) 15 N 1H1H C H 1 H (ppm) 15 N (ppm) H (f1,f2)
 15 N 1H1H C H 1 H (ppm) 15 N (ppm) H (f1,f2)")
23
A 3D NMR spectrum

24
A 2D plane of a 3D NMR spectrum (NOESY)
")
25
Applications small flexible molecules that cannot be crystallized (peptides, oligosaccharides,...) 3D structure determination of proteins, nucleic acids, protein/DNA complexes,...) dynamics (ps to s) electrostatics (pKa values) hydrogen bonding (NH temperature coefficients, H 2 O/D 2 O exchange) unfolded/partially folded states of proteins bound solvent protein/ligand interactions (also very weak) diffusion coefficients analysis of biomolecules in vivo membrane peptides and proteins (solid-state NMR)
 3D structure determination of proteins, nucleic acids, protein/DNA complexes,...) dynamics (ps to s) electrostatics (pKa values) hydrogen bonding (NH temperature coefficients, H 2 O/D 2 O exchange) unfolded/partially folded states of proteins bound solvent protein/ligand interactions (also very weak) diffusion coefficients analysis of biomolecules in vivo membrane peptides and proteins (solid-state NMR)")
26
Protein NMR: a practical approach Sample preparation 500 l, ~1 mM protein solution (10 kDa 10 mg/ml solution 5 mg 0.5 mol) highly efficient (> 10 mg/l), inducible expression system in M9 medium for isotopic enrichment ( 15 NH 4 Cl, 13 C 6 -glucose are expensive; rich labelled media are available) the protein must be: soluble monodispersed stable 20-40° C, pH 3-7 over 2-3 weeks compatible buffers: inorganic buffers (phosphate) low ionic strength (1-100 mM)
 highly efficient (> 10 mg/l), inducible expression system in M9 medium for isotopic enrichment ( 15 NH 4 Cl, 13 C 6 -glucose are expensive; rich labelled media are available) the protein must be: soluble monodispersed stable 20-40° C, pH 3-7 over 2-3 weeks compatible buffers: inorganic buffers (phosphate) low ionic strength (1-100 mM)")
27
Time schedule data acquisition: 1-3 weeks backbone assignments: 1-4 weeks side-chain assignments: 1-4 weeks list of restraint/structure calculation: 1-3 months Spectrometers 500 MHz 800 MHz depending on : the size (number of residues, molecular weight) isotopic enrichment ( 1 H, 15 N, 15 N/ 13 C, 15 N/ 13 C/ 2 H)
 isotopic enrichment ( 1 H, 15 N, 15 N/ 13 C, 15 N/ 13 C/ 2 H)")
28
Limits Molecular weight limits for protein structure calculation (monomer): 5-15 kDa: routine 15-20 kDa: usually feasible 20-30 kDa: long term project 40-50 kDa: in the next future? Molecular weight limits for peptide/protein, protein/protein interactions (MW of the AB complex, A < 10 kDa): 20-30 kDa: routine 30-50 kDa: feasible 50-100 kDa: in the next future
: kDa: routine kDa: feasible kDa: in the next future.")
29
Protein structure calculation by NMR cloning expression (labeling) purification data acquisition sequential assignments side-chain assignments NOE assignments list of geometrical restraints structure calculation structure refinement validation structure/function relationships (electrostatic potentials, surface analysis, ligand binding sites,...
 purification data acquisition sequential assignments side-chain assignments NOE assignments list of geometrical restraints structure calculation structure refinement validation structure/function relationships (electrostatic potentials, surface analysis, ligand binding sites,...")
30
Protein structure calculation by NMR Structure calculation is the determination of atoms position (x,y,z) in a coordinate system Atom positions in the liquid state are averaged over space and time Structure calculation in liquids must rely on internal coordinates; in other words, you must measure something that does not depend on atoms position
 in a coordinate system Atom positions in the liquid state are averaged over space and time Structure calculation in liquids must rely on internal coordinates; in other words, you must measure something that does not depend on atoms position")
31
HB HC HA Geometrical restraints that allow structure calculations: distances (NOE) angles (J-couplings) Protein structure calculation by NMR HB HC HA
 angles (J-couplings) Protein structure calculation by NMR HB HC HA")
32
HB HC HA Protein structure calculation by NMR HB HC HA

34
Books: NMR of proteins and nucleic acids Kurt Wühtrich, Wiley (1986) NMR of macromolecules: a practical approach edited by G. C. K. Roberts, IRL Press (1993) Protein NMR spectroscopy: principles and practice J. Cavanagh, W. Fairbrother, A. Palmer, N. Skelton Academic Press (1996) NMR on the web: http://www-keeler.ch.cam.ac.uk/lectures/ Useful links: http://www.spincore.com/nmrinfo/ http://www.spectroscopynow.com/ http://www.bmrb.wisc.edu/
 Protein NMR spectroscopy: principles and practice J. Cavanagh, W. Fairbrother, A. Palmer, N. Skelton Academic Press (1996) NMR on the web: Useful links:")
35
Nuclear Magnetic Resonance in Structural Biology Part I Nuclear Magnetic Resonance in Structural Biology Part I This PowerPoint presentation can be downloaded from plaza on the ICGEB sharing server (helix), together with a PDF copy of the Science article folder = NMR-1
, together with a PDF copy of the Science article folder = NMR-1")
Similar presentations


 FID represents the time-domain response of the spin system following application.>")

 Mon, Oct 30: Assignments: I a. Important homonuclear (e.g. 1 H) experiments b. Small molecules.>")


>")

