Download presentation
Presentation is loading. Please wait.

2
Dr.Bayat,MD Assistant professor of cardiology Echocardiologist

4
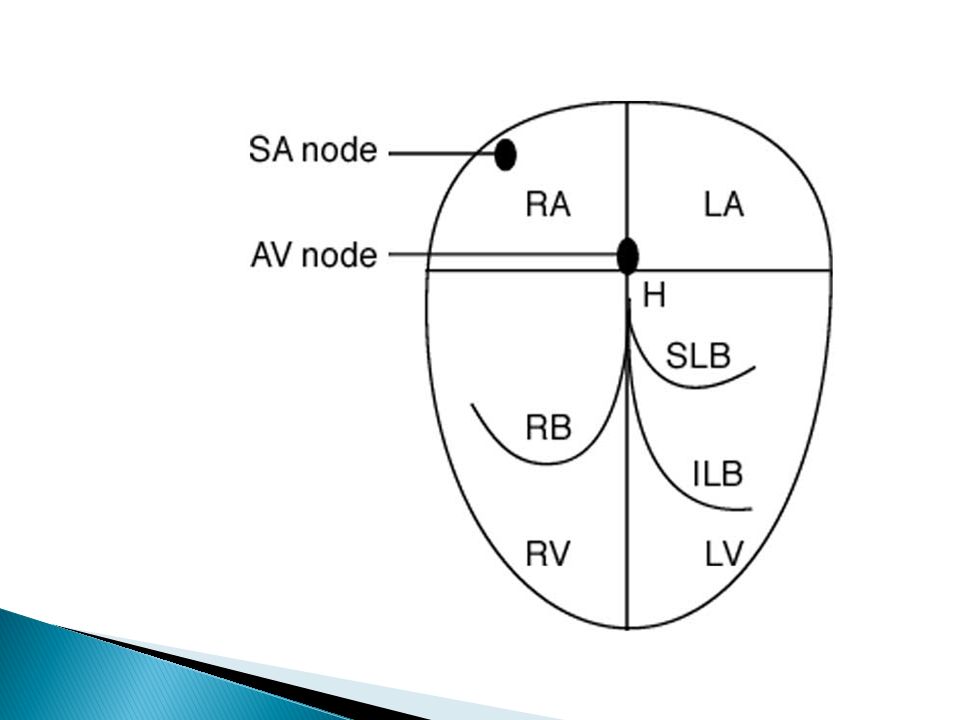
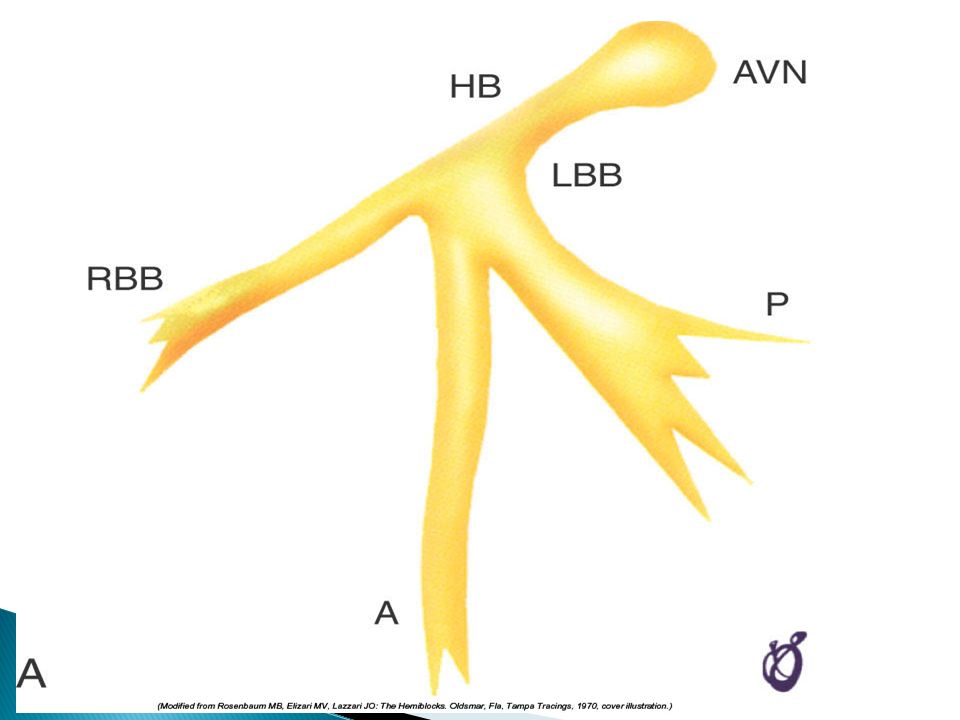
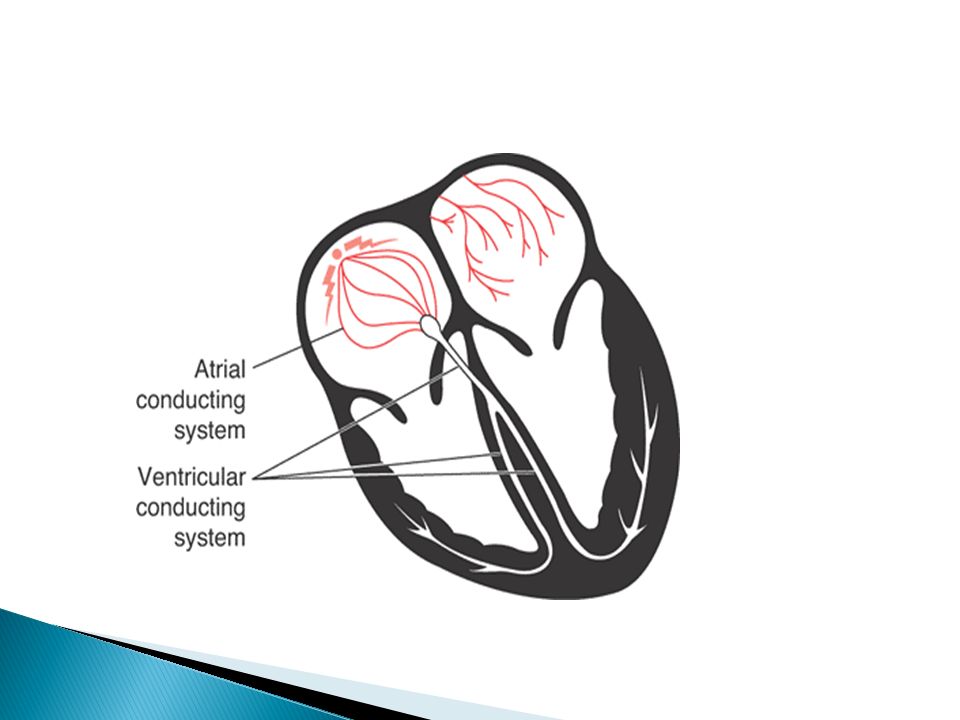
For more presentations www.medicalppt.blogspot.com Sinoatrial node AV node Bundle of His Bundle Branches Purkinje fibers

5
For more presentations www.medicalppt.blogspot.com Sinoatrial node AV node Bundle of His Bundle Branches Purkinje fibers

7
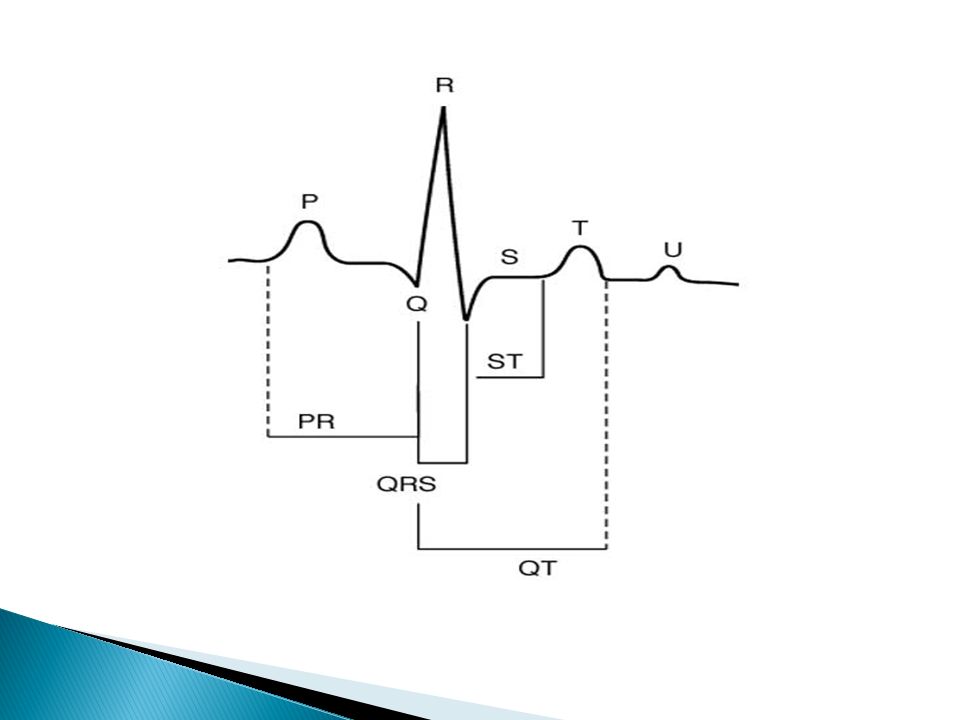
For more presentations www.medicalppt.blogspot.com P wave - Atrial depolarization T wave - Ventricular repolarization QRS - Ventricular depolarization

8
For more presentations www.medicalppt.blogspot.com Atrial depolarization + delay in AV junction (AV node/Bundle of His) (delay allows time for the atria to contract before the ventricles contract)
 (delay allows time for the atria to contract before the ventricles contract)")
9
P wave:When th atria depolarize before atrial contraction begins QRS COMPLEX :ventricular depolarization before contraction T WAVE:ventricular repolarization wave,250 to 350 msec after depolarizatiuon

10
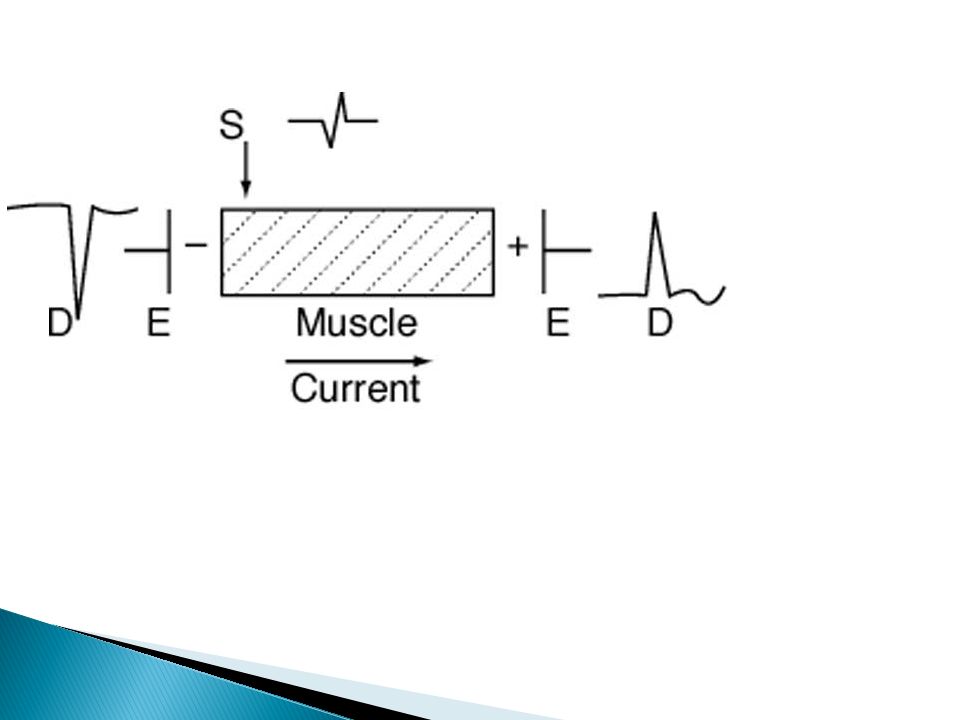
No potential is recordrd in the ECG when the ventricular muscle is either completely polarized or completely depolarized Only when the muscle is partly polarized and partly depolarized does current flow from one part of the ventricle to another part and therefore current also flows to the surface of the body to produce the ECG

11
P and QRS occurs at the begining of the atrial and ventricular contraction Ventricles remain contracted until after repolarization has occurred that is until after the end of the T wave Atrial repolarization,150-200 msec after termination of p wave(atrial T wave )Usually obscured by larger QRS complex T wave :200 msec after QRS,and period 150 msec(350 msec),lower voltage due to prolonged length
Usually obscured by larger QRS complex T wave :200 msec after QRS,and period 150 msec(350 msec),lower voltage due to prolonged length")
12
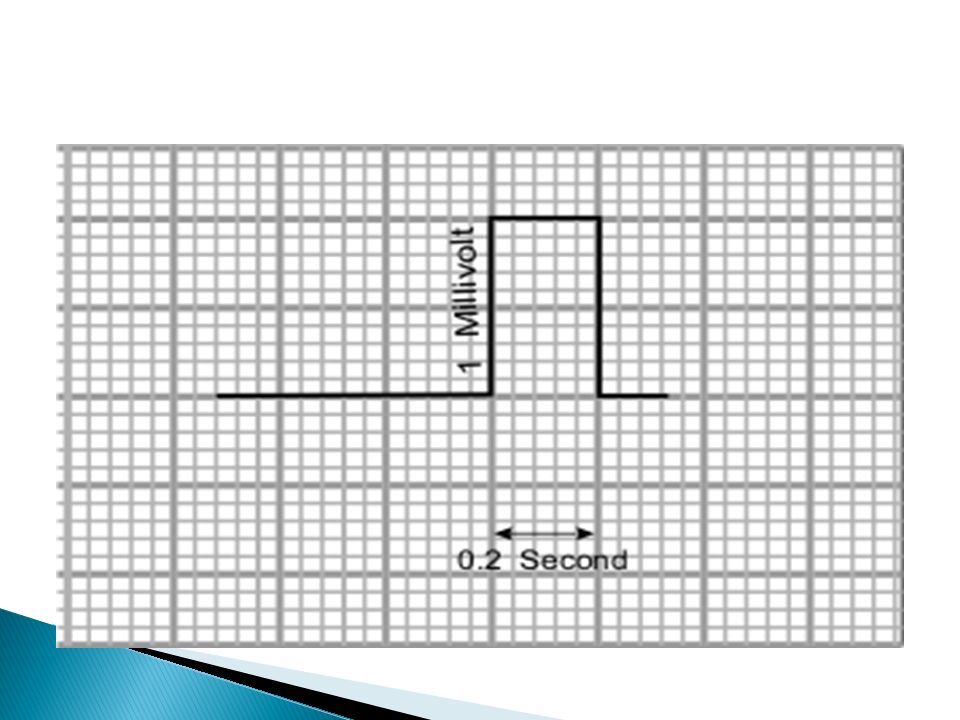
Paper speed:25 mm/sec,each 1mm represents 40 msec(5:200 msec) Voltage :each small box,0.1 mv Normal voltage: QRS=1-1.5 MV P WAVE=0.1-0.3 MV T WAVE=0.2-0.3 MV
 Voltage :each small box,0.1 mv Normal voltage: QRS=1-1.5 MV P WAVE= MV T WAVE= MV")
13
For more presentations www.medicalppt.blogspot.com Horizontally ◦ One small box - 0.04 s ◦ One large box - 0.20 s Vertically ◦ One large box - 0.5 mV

14
For more presentations www.medicalppt.blogspot.com Every 3 seconds (15 large boxes) is marked by a vertical line. This helps when calculating the heart rate. NOTE: the following strips are not marked but all are 6 seconds long. 3 sec

17
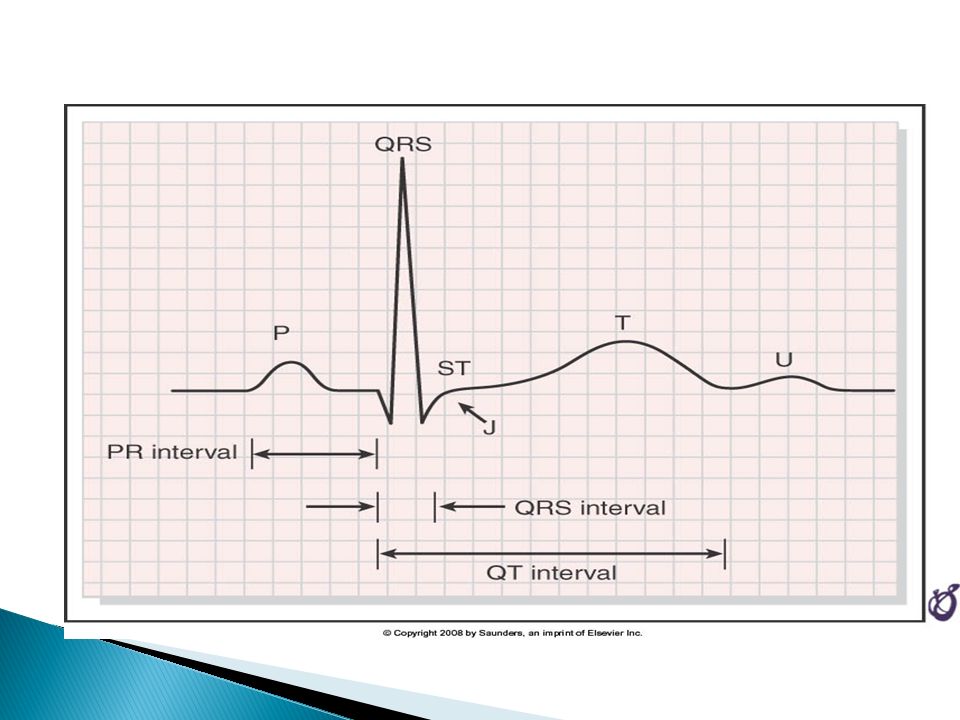
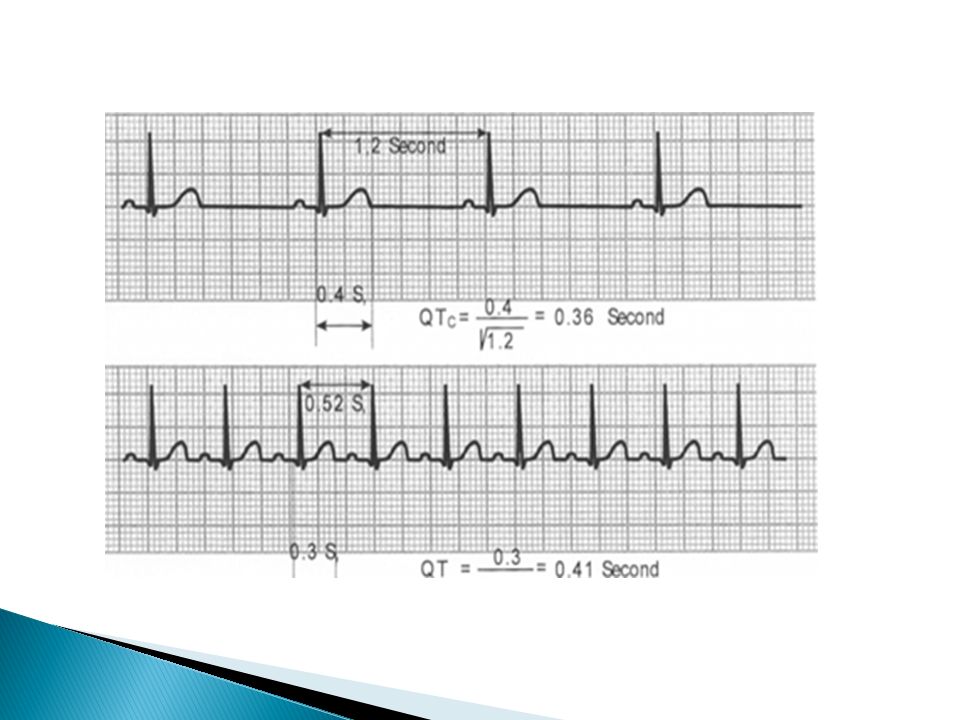
Physiogical measurements PR interval = 0.12-0.2 s (120-200 ms) QRS duration = 0.06-0.1 s (60-100 ms) QT interval = 0.30-0.46 s (300-460 ms) for heart rates varying between 45 to 115 beats per minute. The QT interval lengthens with bradycardia and shortens with tachycardia.

18
P-Q or P-R interval:atrial,AV node and His- purkinje conduction,160 msec(120-200msec) Q-T INTERVAL:contraction of the ventricles,350 msec HEART RATE:60/RR INTERVAL(SEC)
 Q-T INTERVAL:contraction of the ventricles,350 msec HEART RATE:60/RR INTERVAL(SEC)")
19
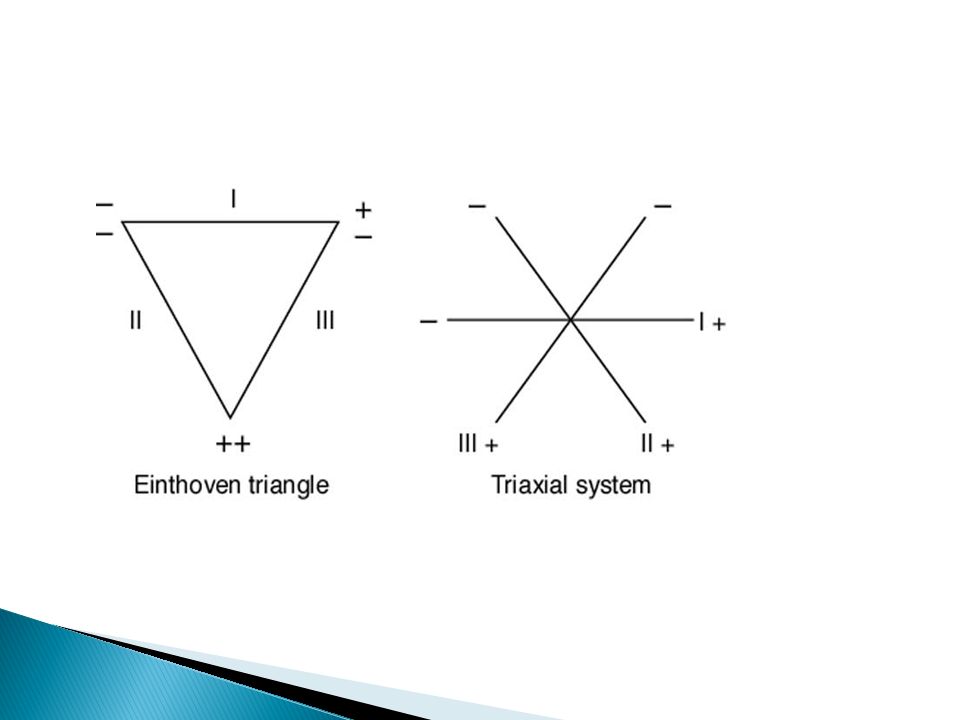
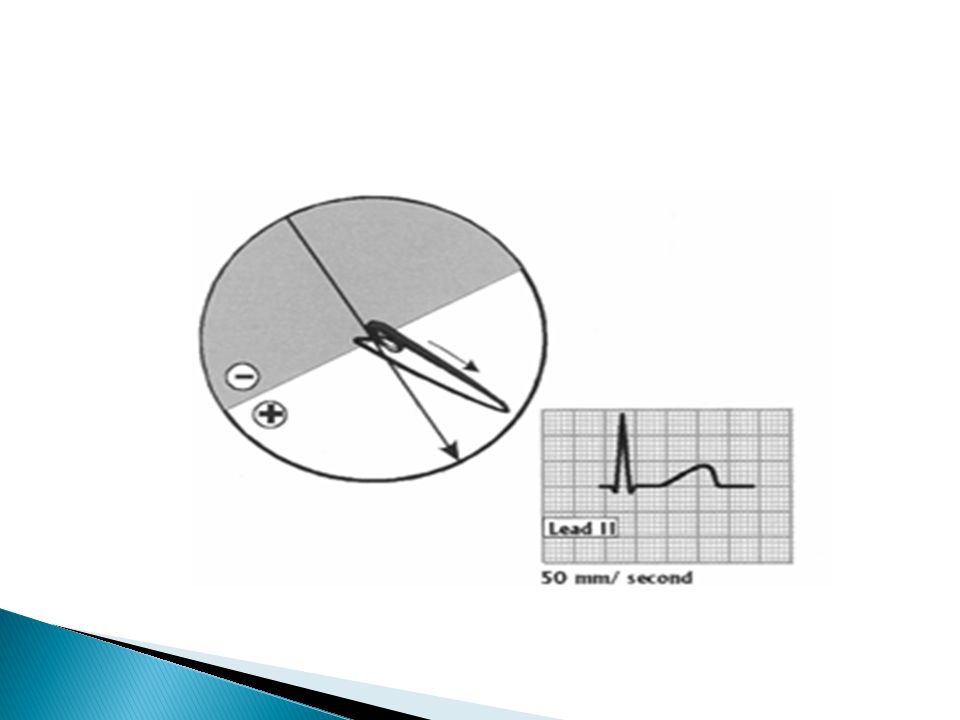
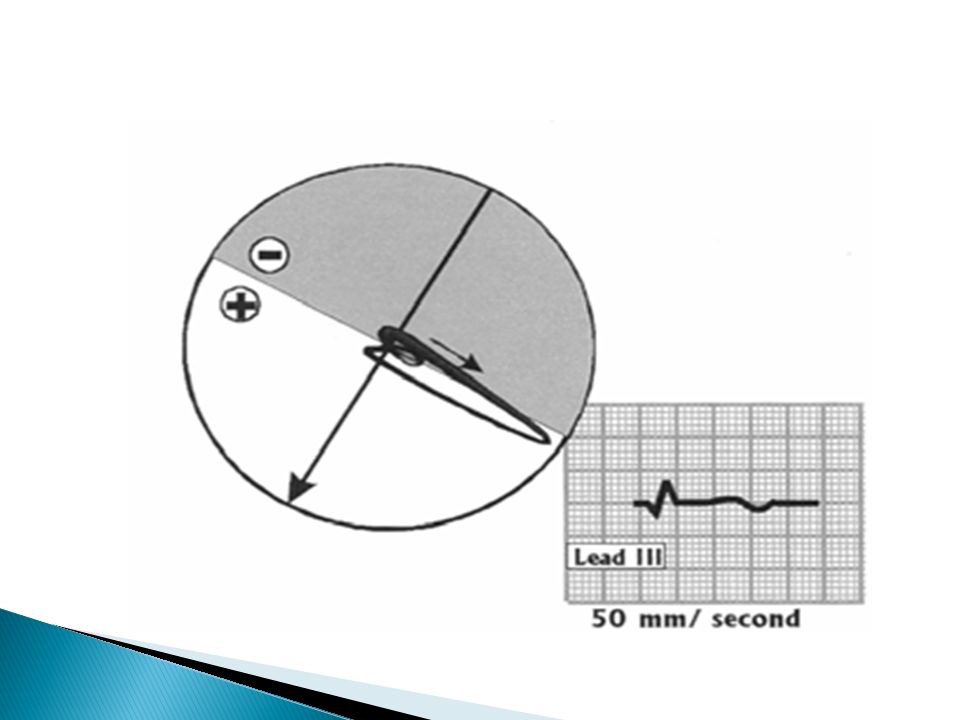
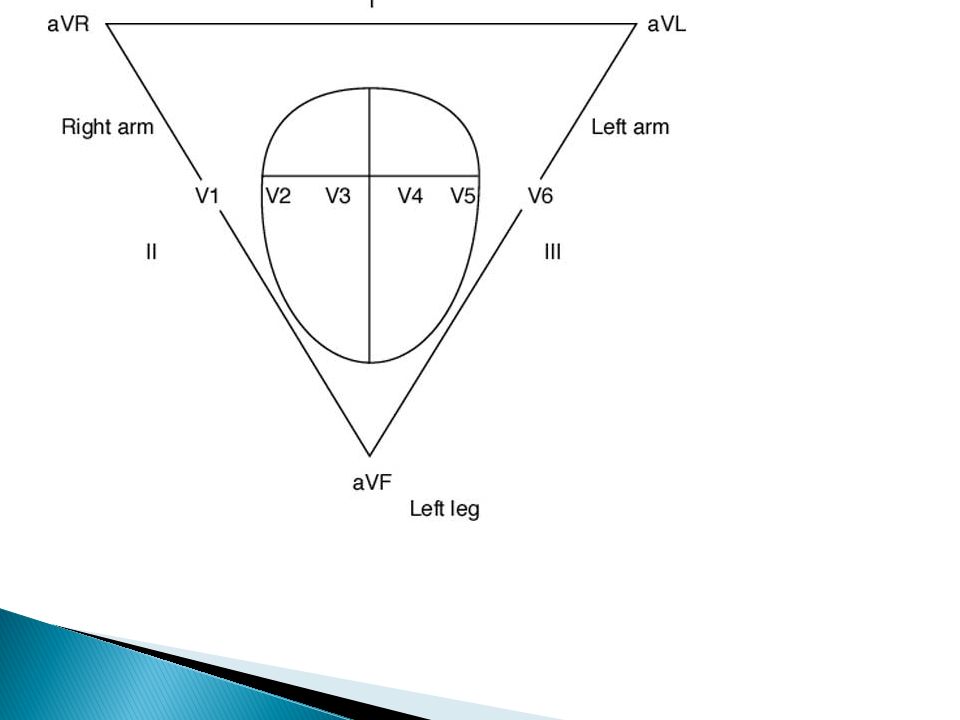
THREE BIPOLAR LIMB LEADS LEAD I:Right arm(-) to left arm(+) LEAD II:Right arm(-) to left leg(+) LEAD III:left arm(-) to left leg(+) EINTHOVEN’ S TRIANGLE EINTHOVEN’S LAW: SUM OF THE VLTAGES IN LEAD I+III=LEAD II
 to left arm(+) LEAD II:Right arm(-) to left leg(+) LEAD III:left arm(-) to left leg(+) EINTHOVEN’ S TRIANGLE EINTHOVEN’S LAW: SUM OF THE VLTAGES IN LEAD I+III=LEAD II")
25
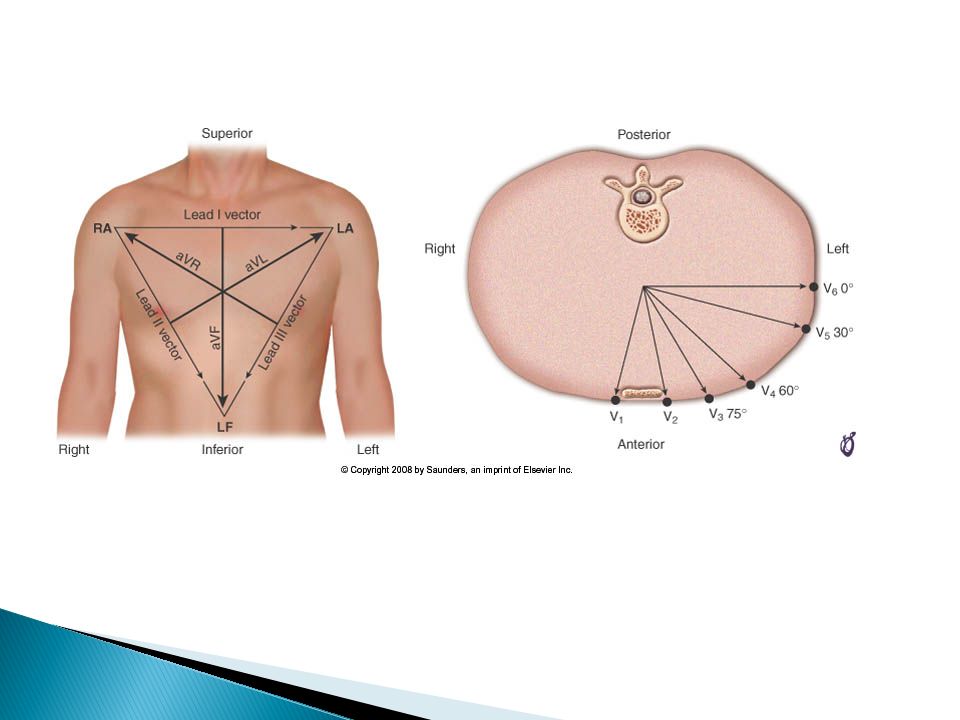
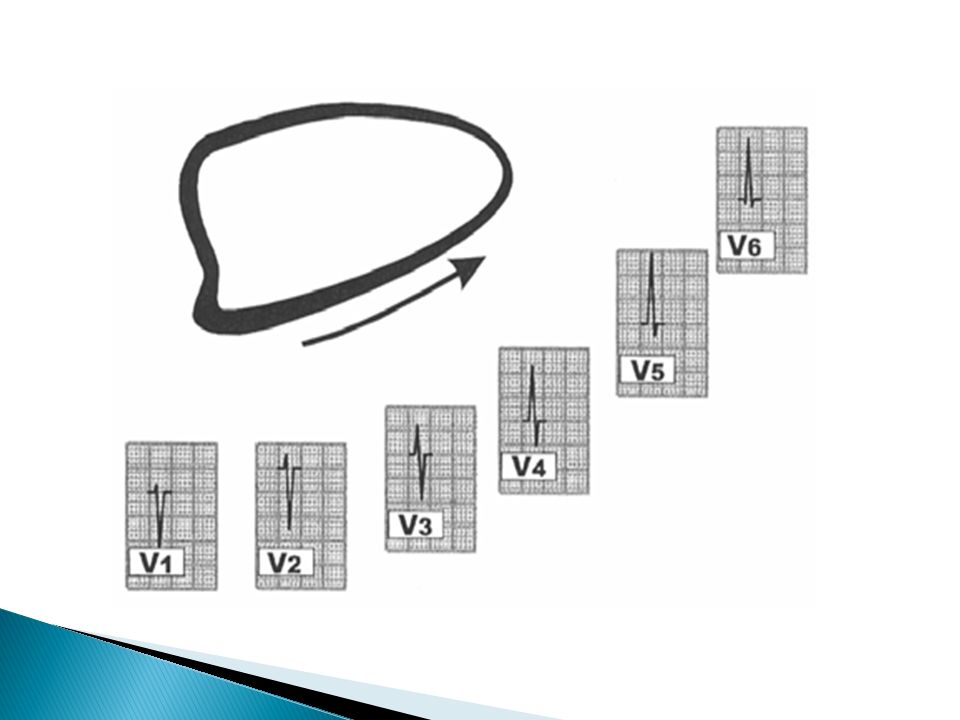
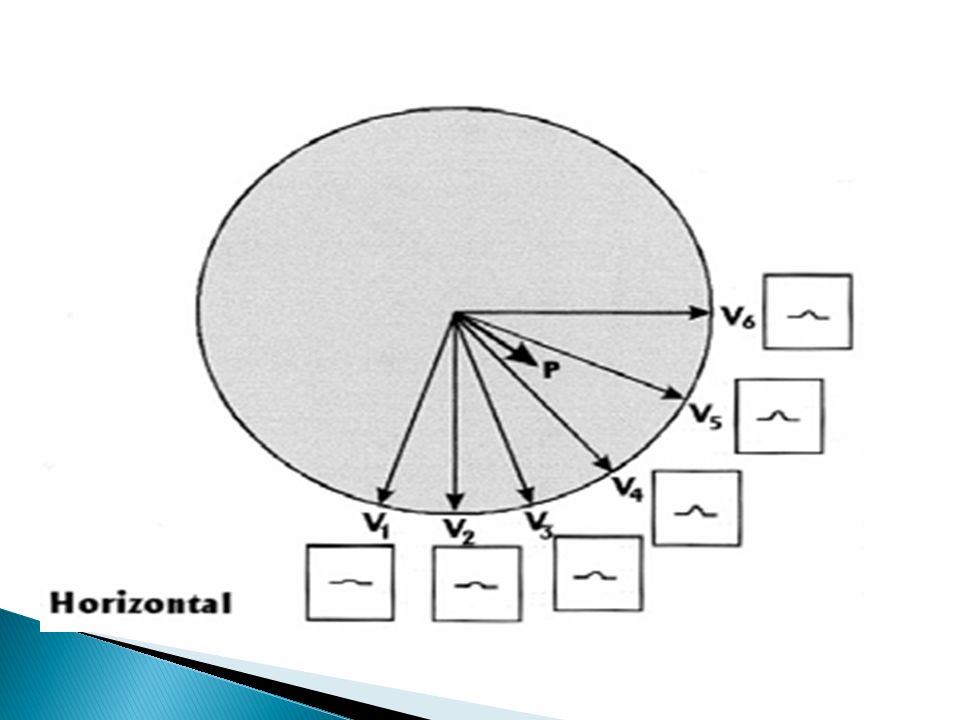
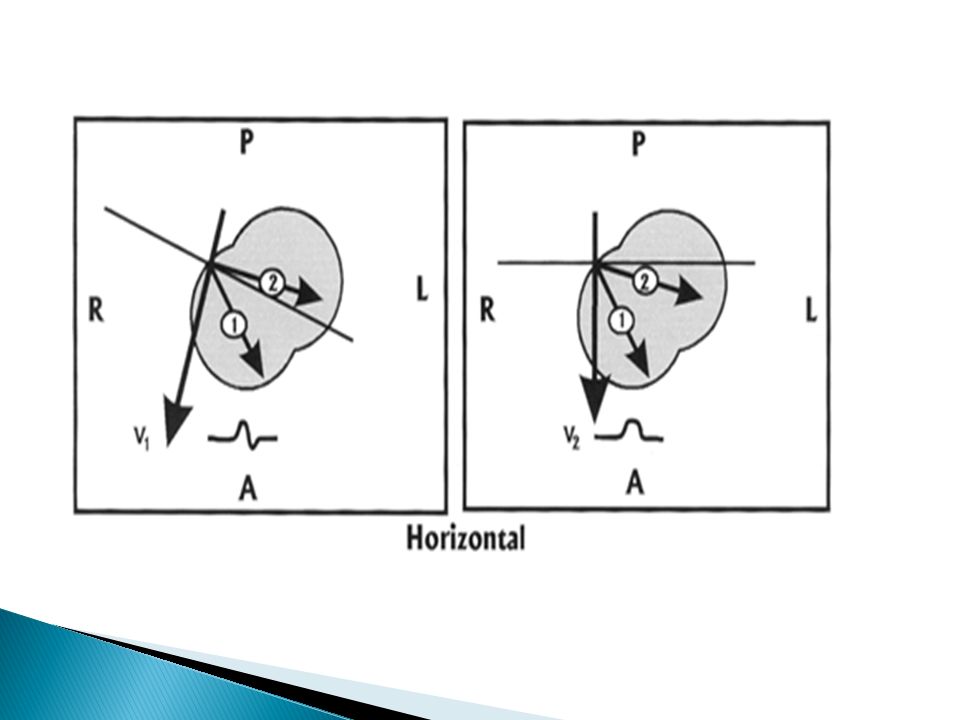
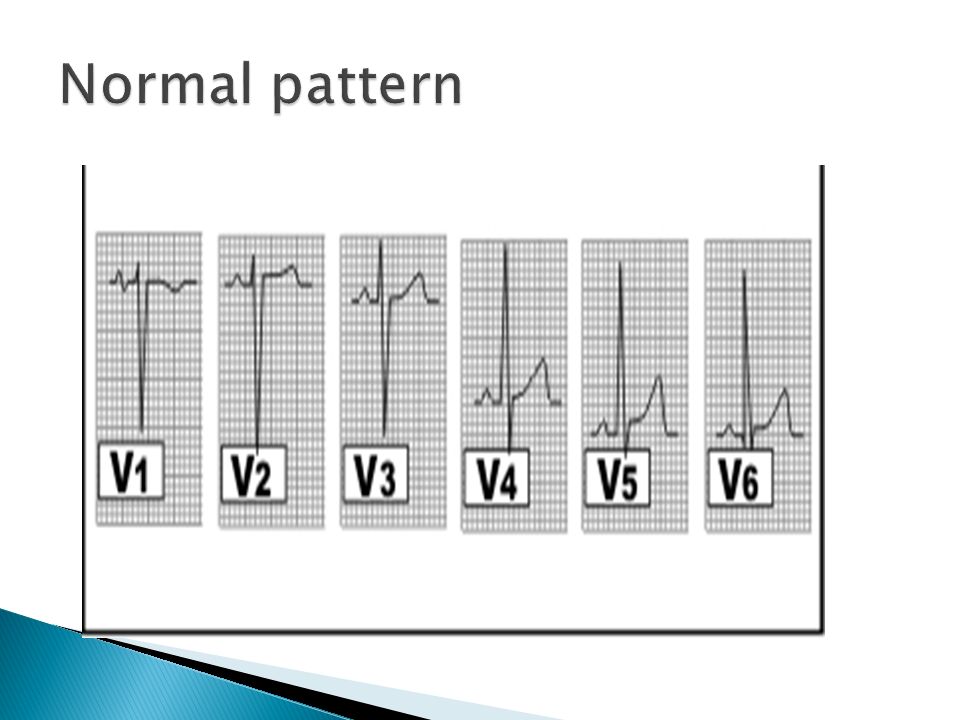
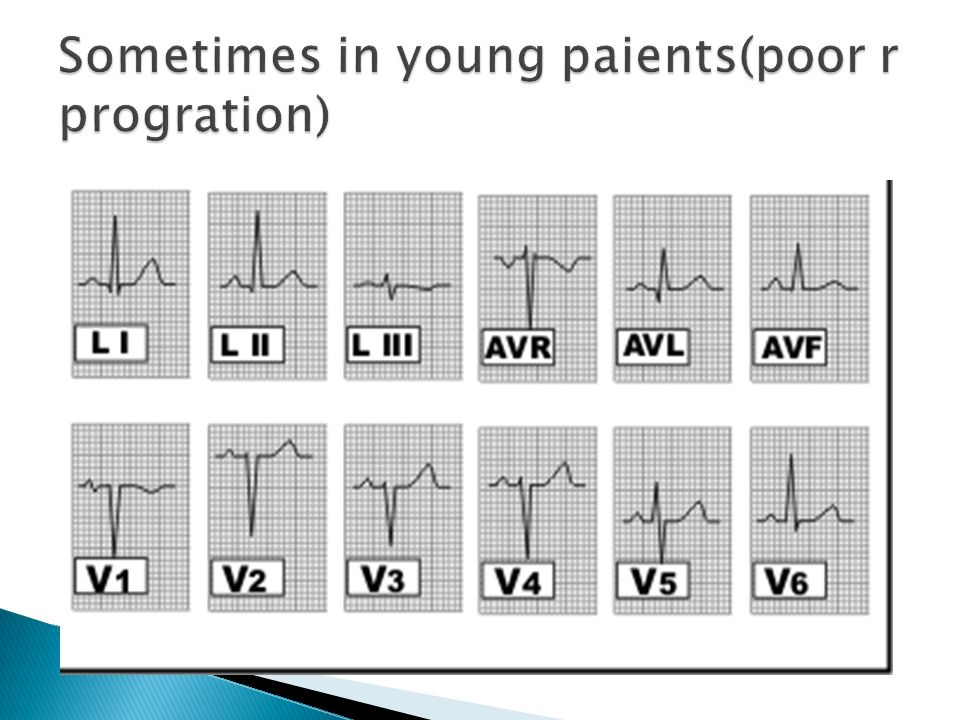
Neg electrode(indifferent electrode) is connected through equal electrical resistance to the rigth arm,left leg,left arm and positive electrode is connected to to anterior chest wall V1,V2 are mainly negative(direction of electronegativity) and V4,V5,V6 ARE mainly positive
 is connected through equal electrical resistance to the rigth arm,left leg,left arm and positive electrode is connected to to anterior chest wall V1,V2 are mainly negative(direction of electronegativity) and V4,V5,V6 ARE mainly positive")
27
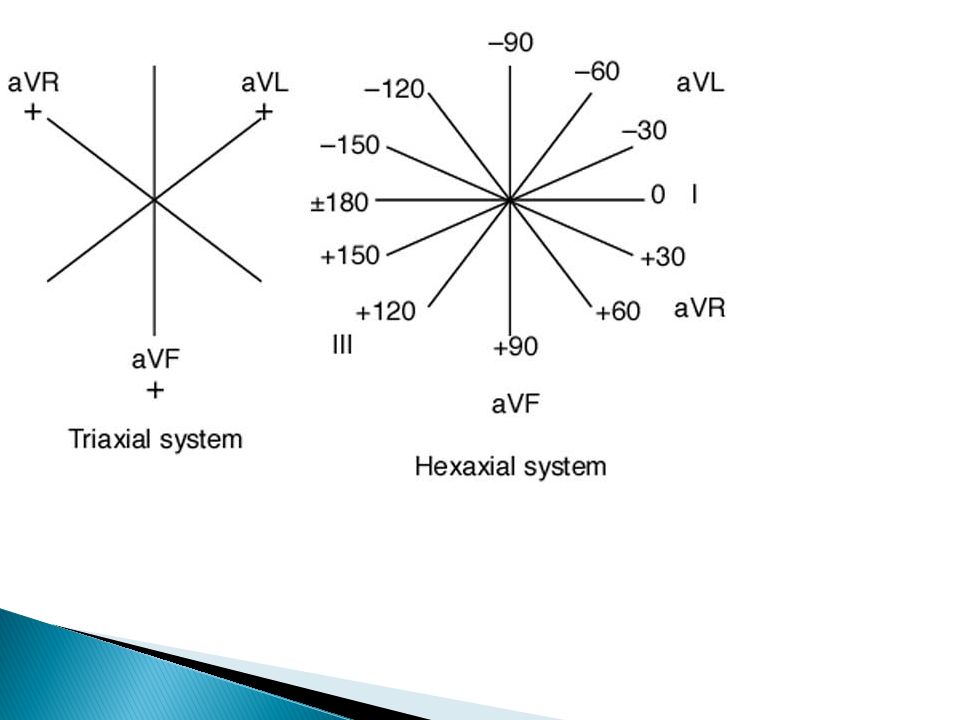
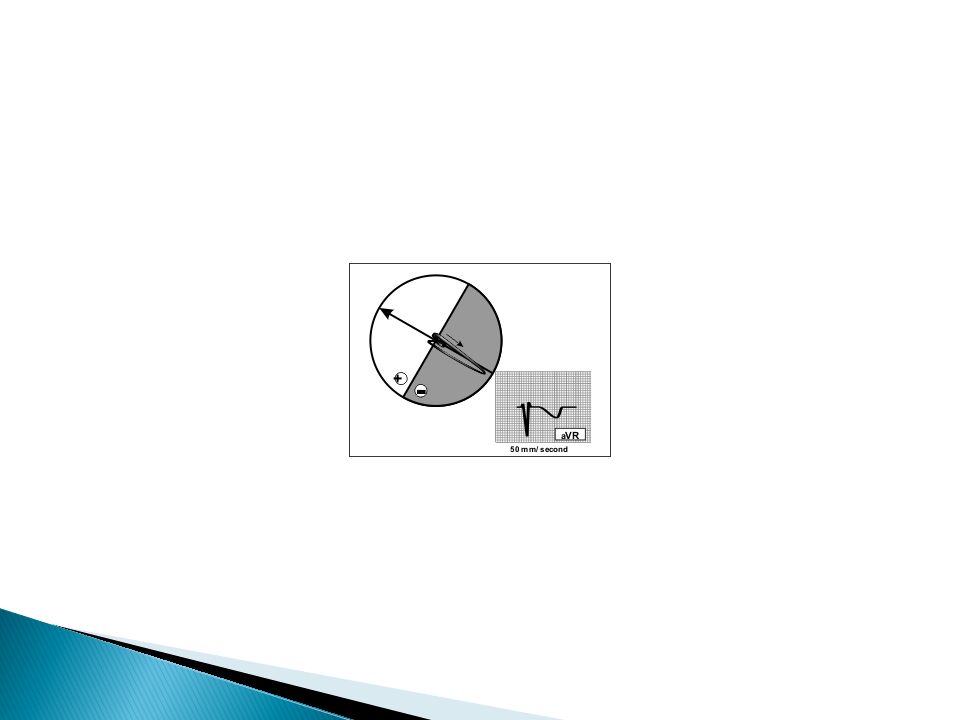
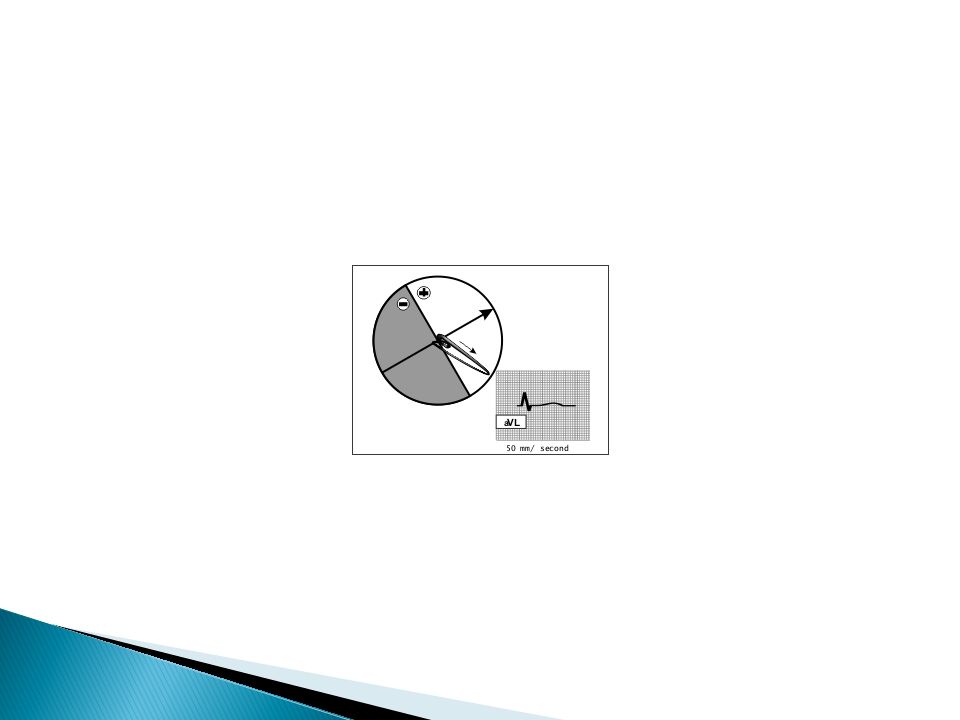
avR,avL,avF avR recording is inverted

32
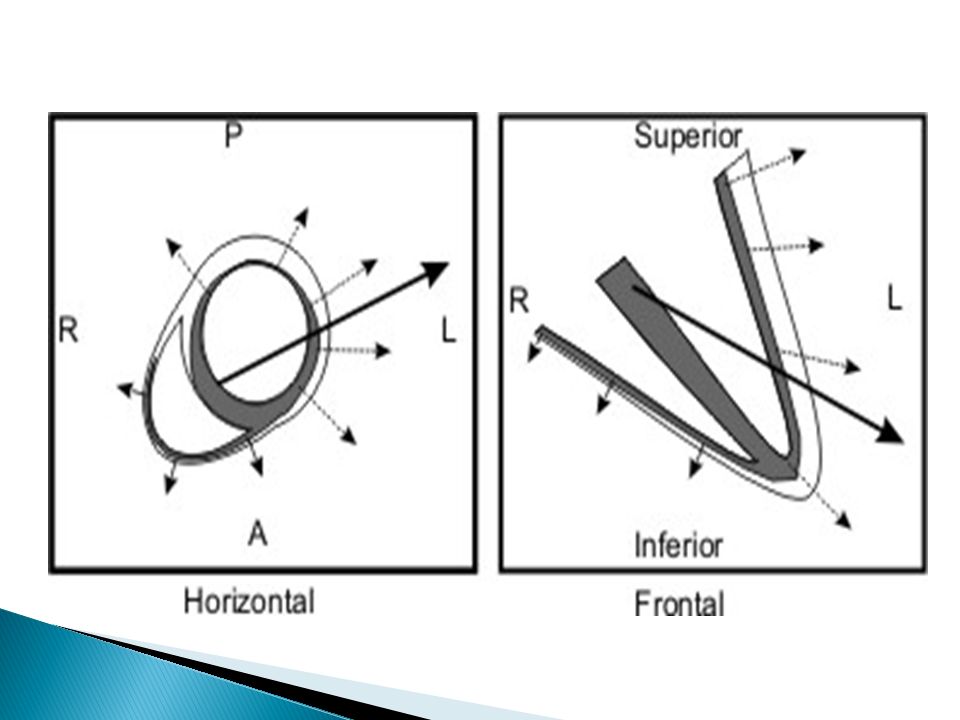
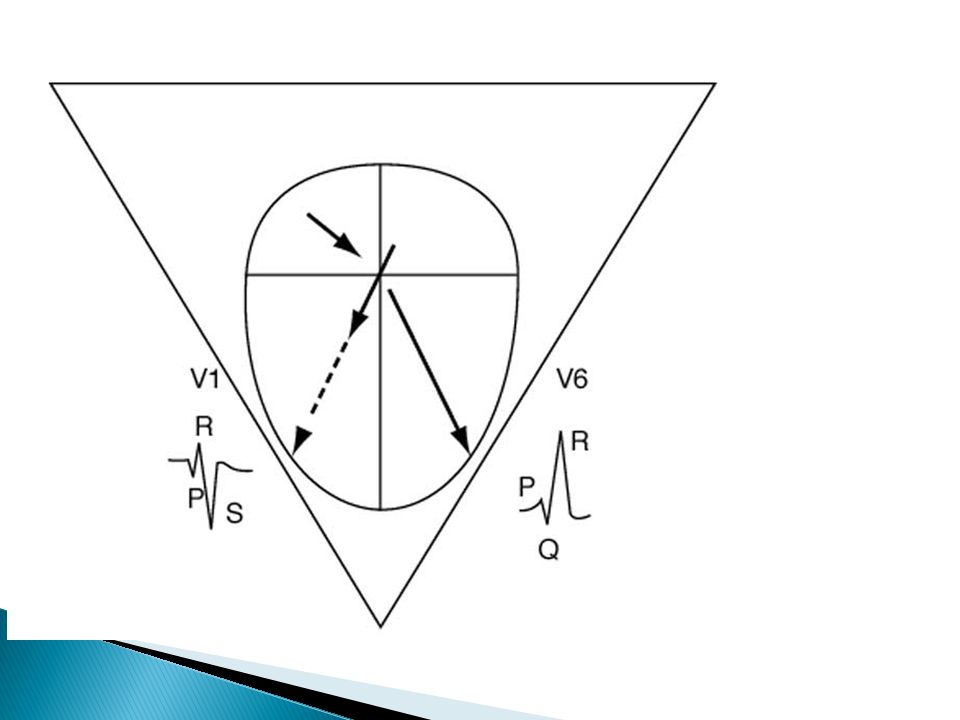
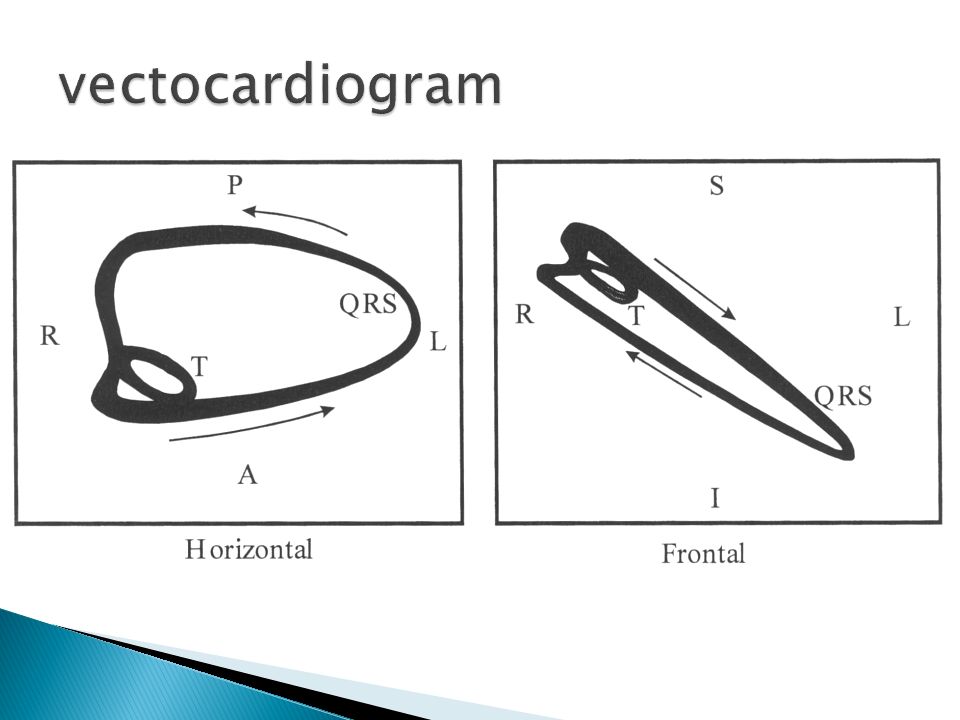
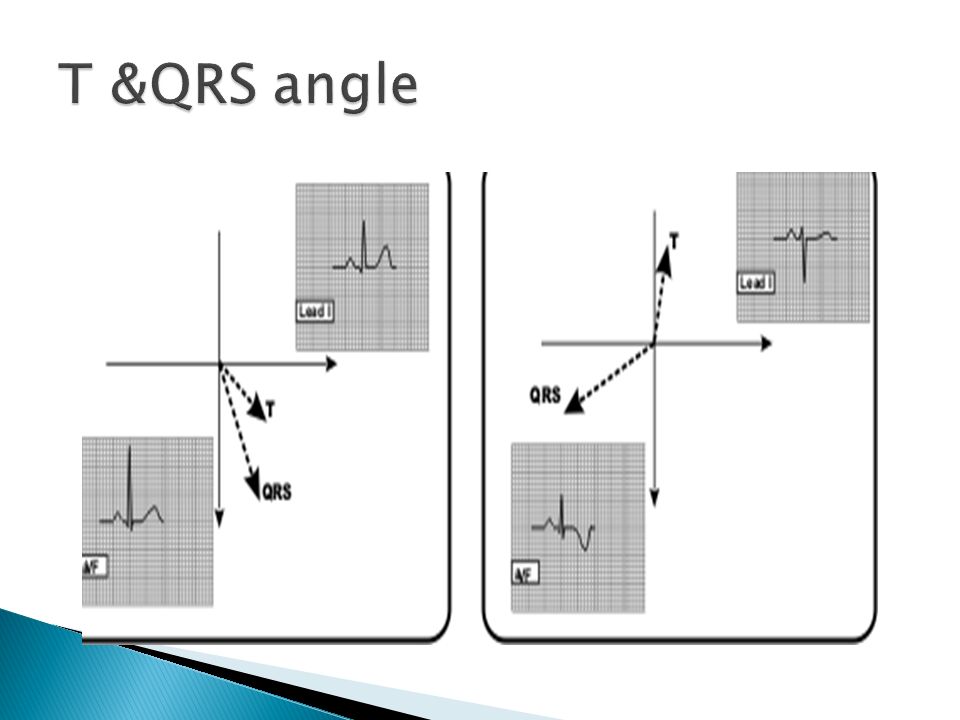
In a normal heart the average direction of the vector during spread of the depolarization wave through the ventricle,called the mean QRS vector,is about 59 degrees Septal vector Ventricular Depolarization Ventricular repolarization

33
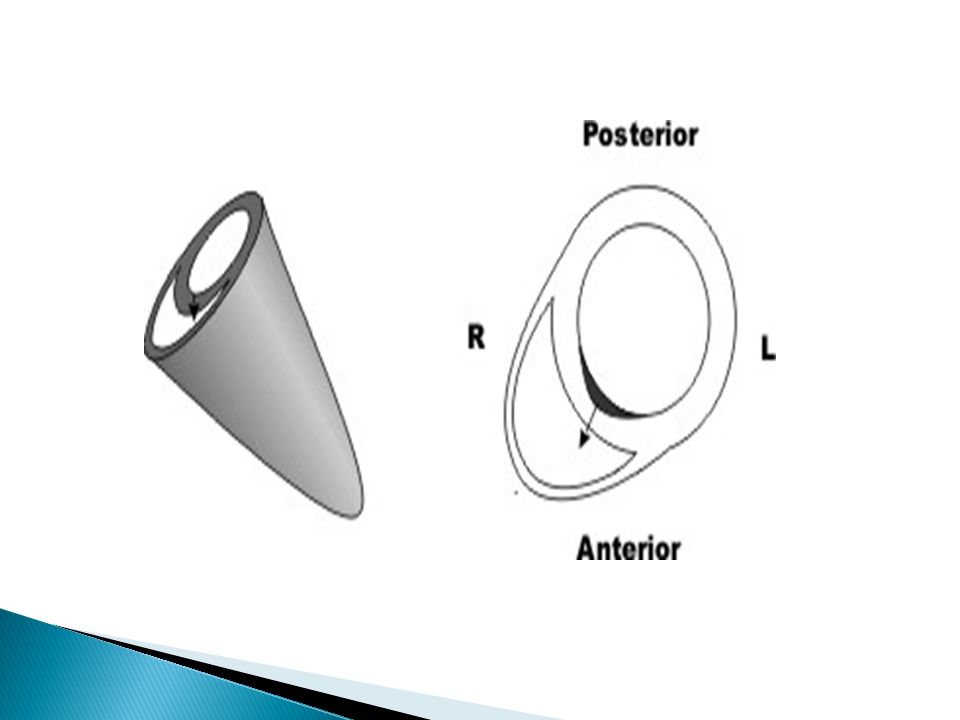
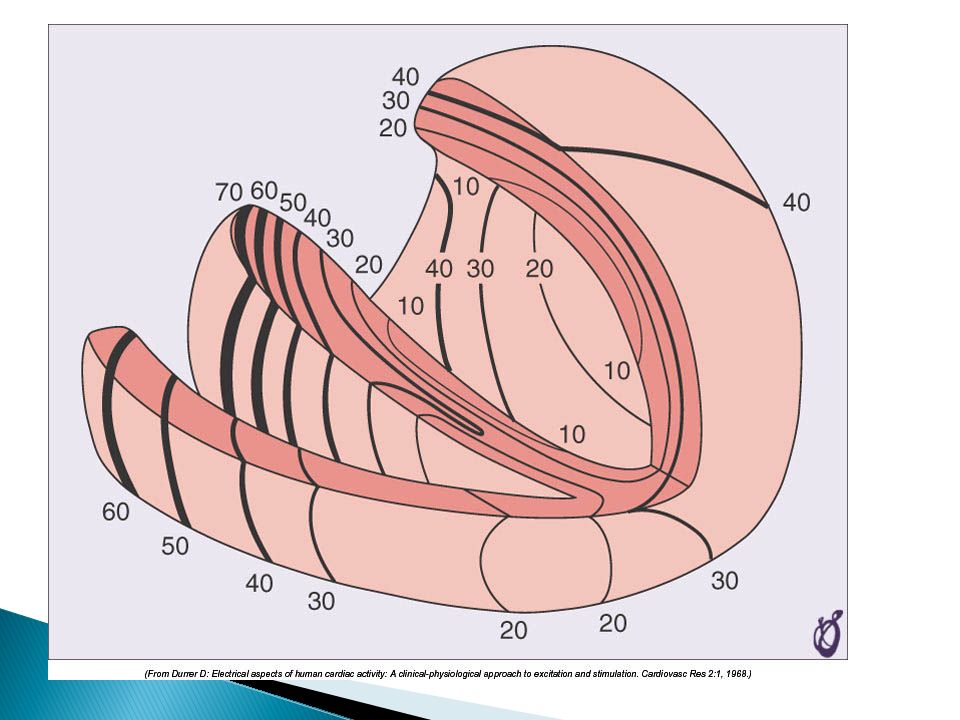
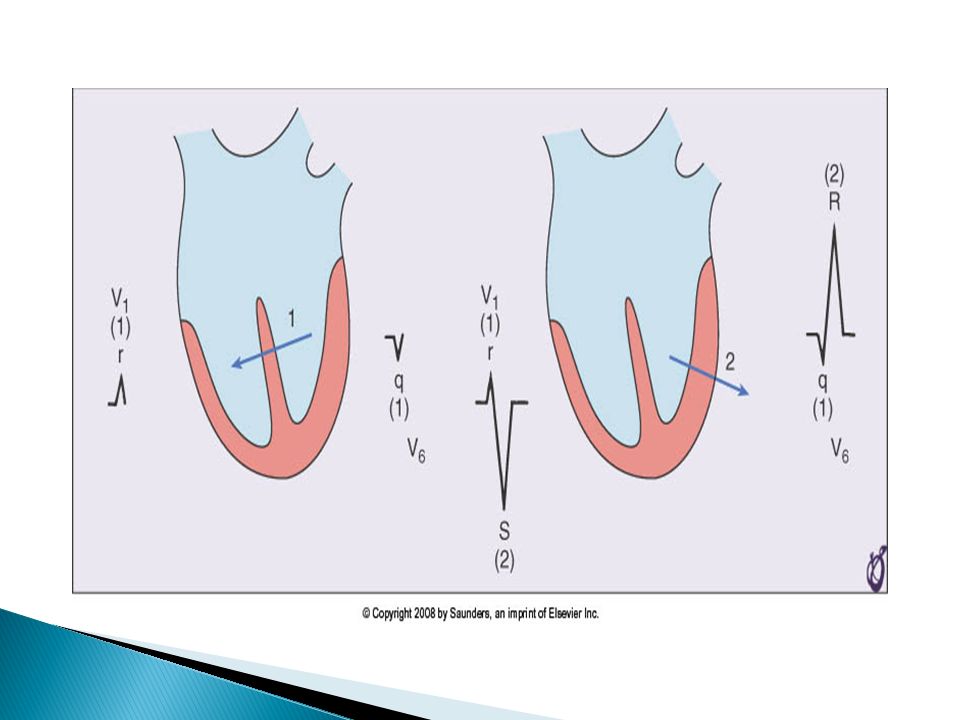
When the cardiac impulse enters the ventricular throuh the AV bundle the first part of ventricle to depolarized is left endocardial surface of the septum then depolarization spreads rapidly to involve both endocardial surfaces of the septum next spreads along the endocardial surface of 2 ventricles.finally spreads through the ventricle muscle to the outside of heart

34
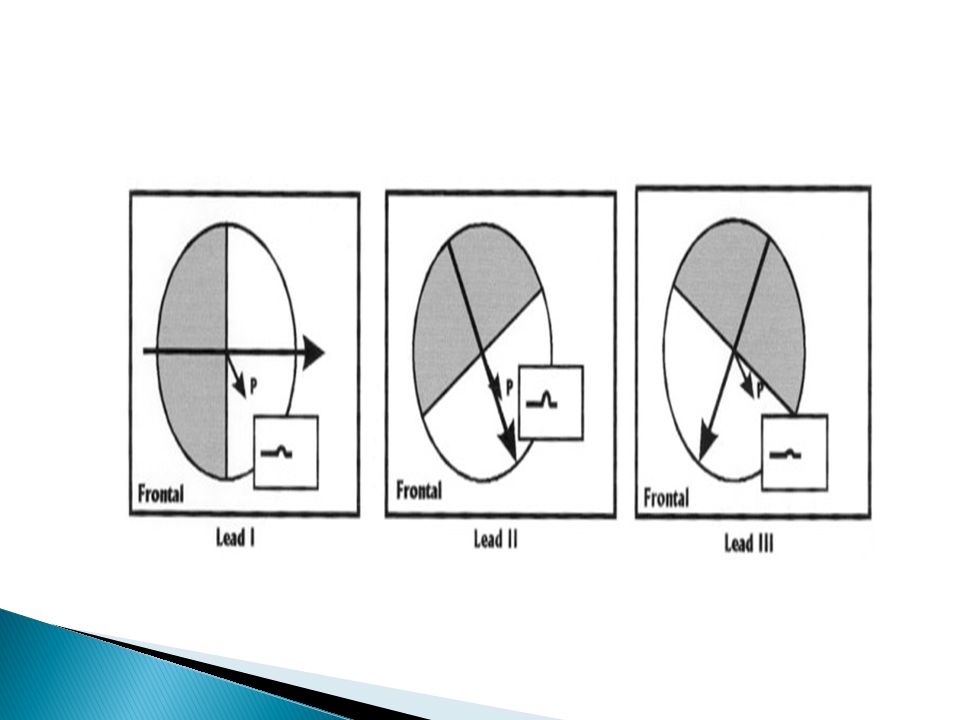
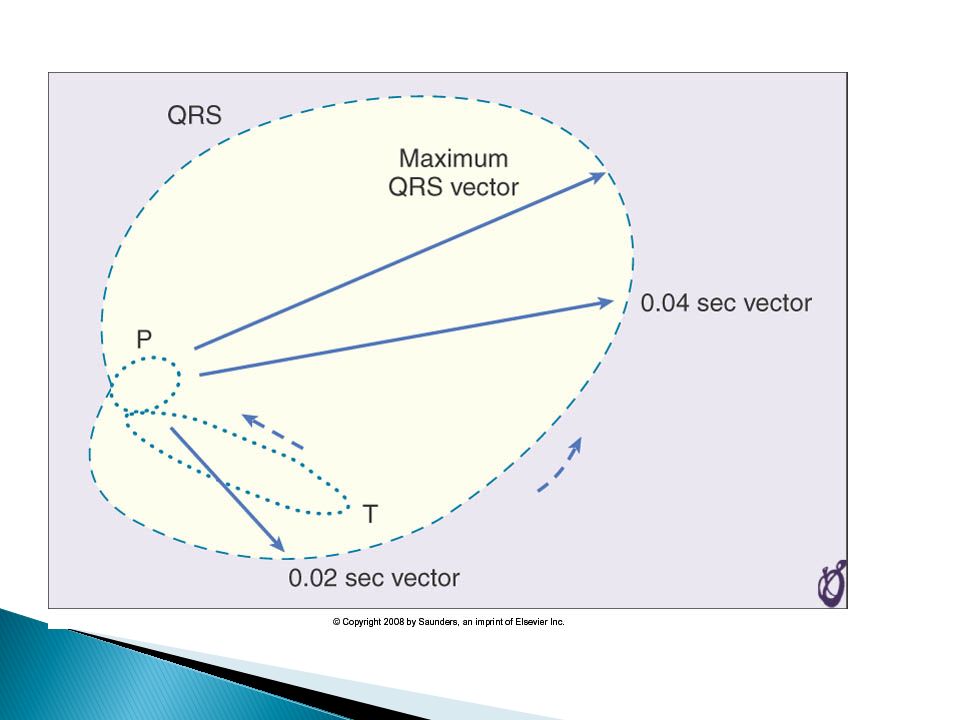
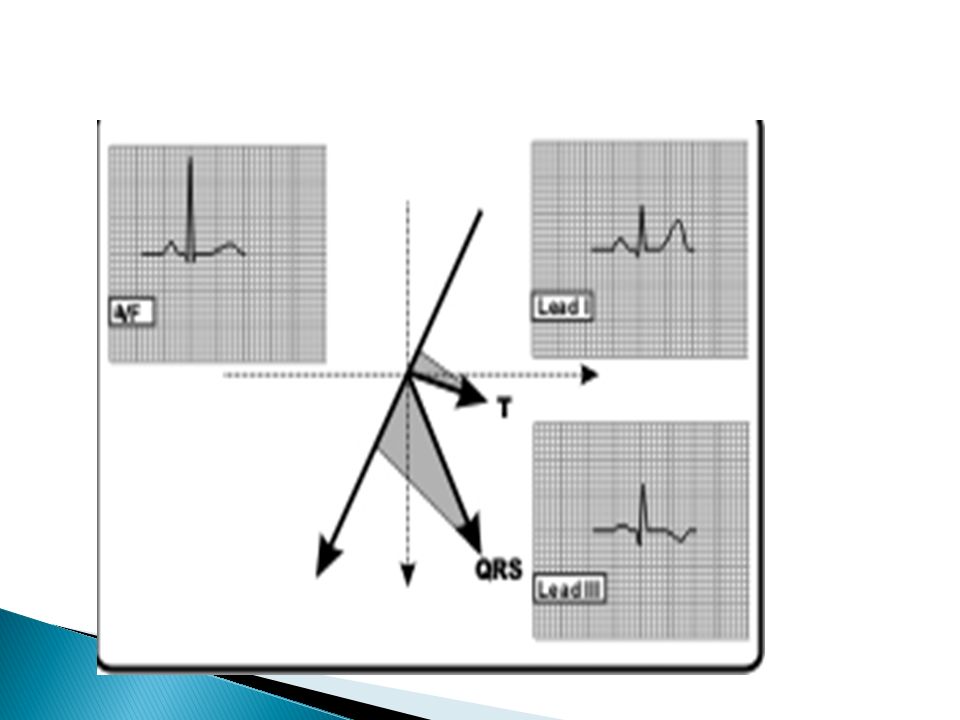
The ventricular muscle had just begun to be depolarized representing an instant about 0.01 s after the onset of depola.at this time the vector is short because only small portion of the ventricular –septum- is depola.so all electrocardiographic voltages are low,as recorded to the right of the ventricular muscle for each of the leads.the voltage in lead II is greater than the voltage in lead I and III because the heart vector extends mainly in the same direction as the axis of lead II.

46
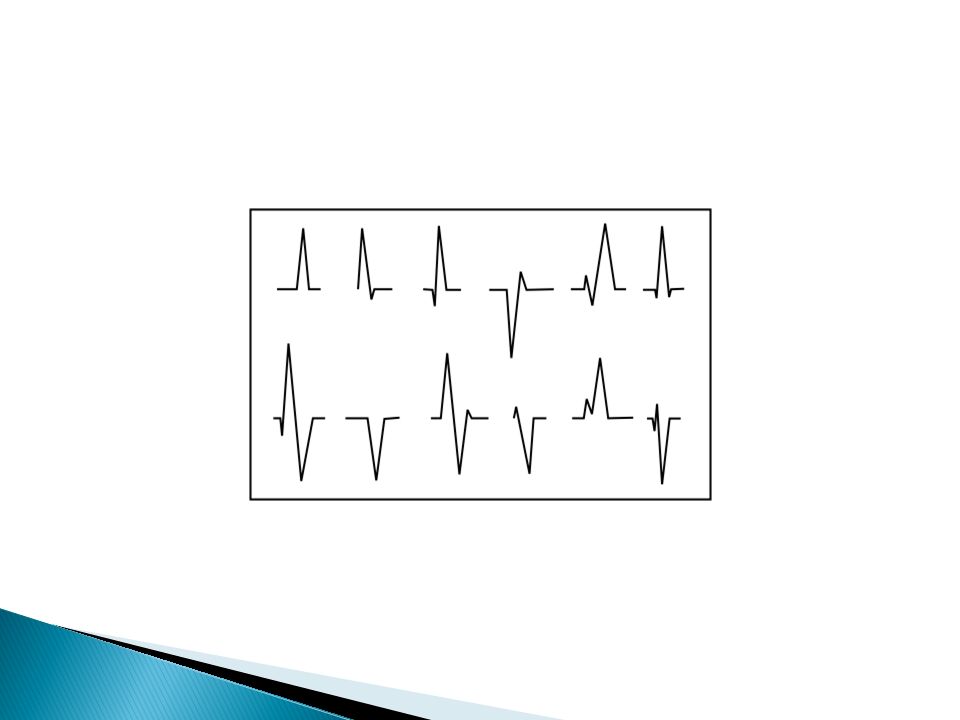
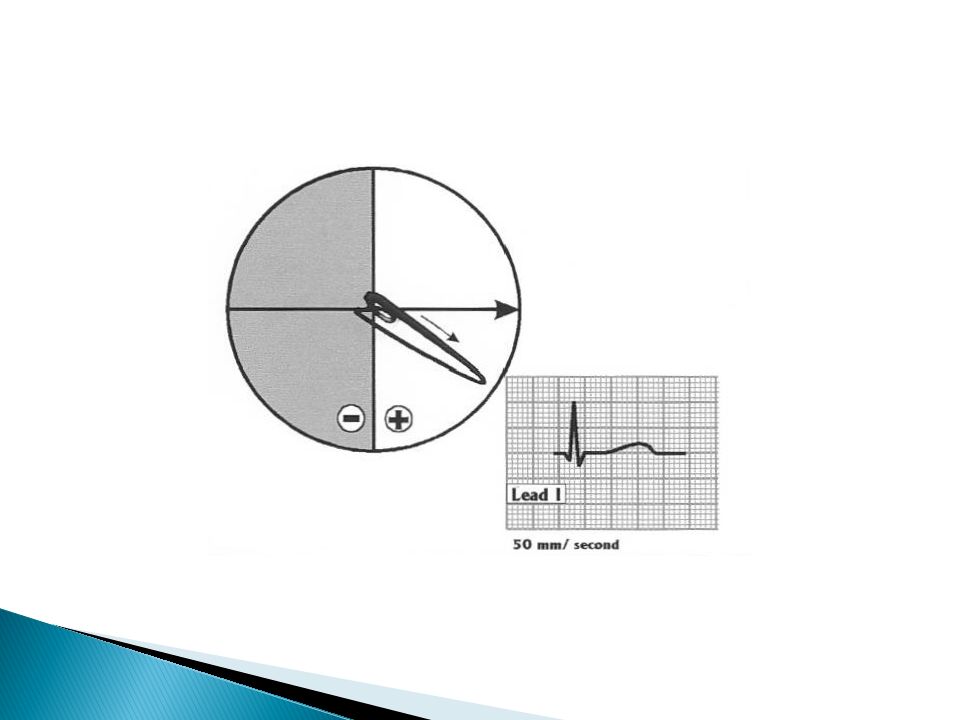
When the vector in the heart is in a direction almost prependicular to the axis of the lead,the voltage recorded in the ECG of this lead is very low,conversly when the heart vector has almost exactly the same axis as the lead axis,essentially the entire voltage of the vector will be recorded When the vector in the heart is in a direction almost prependicular to the axis of the lead,the voltage recorded in the ECG of this lead is very low,conversly when the heart vector has almost exactly the same axis as the lead axis,essentially the entire voltage of the vector will be recorded.

56
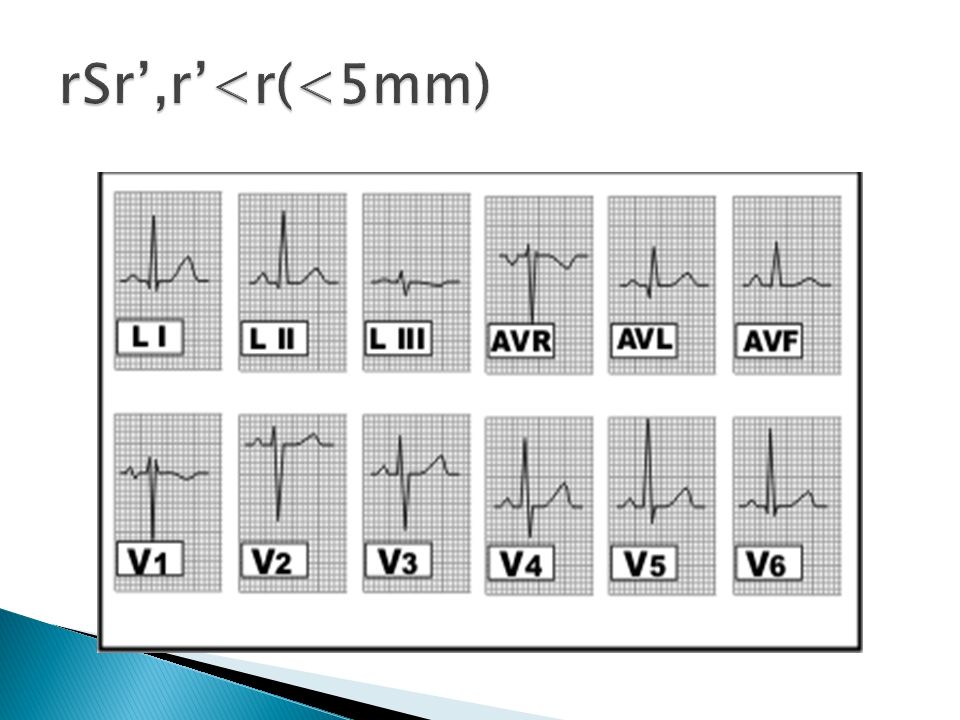
ABNORMAL Q wave=>40 msec or >1/4 R WAVE NORMAL Q WAVE IN LEAD III,aVR,V1,V2

59
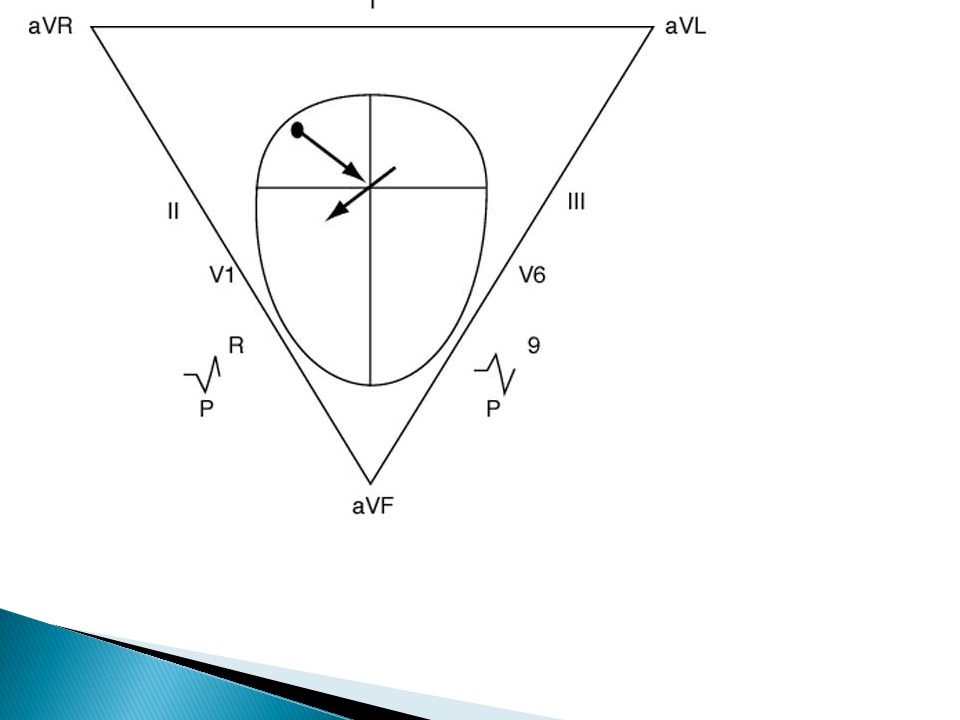
Depolarization is much slower than ventricles Due to no purkinje system Repolarization from the site of first depolarization(SA node )therefore repolarization vector is opposite of depolarization vector) Atrial axis=0-75 degrees
therefore repolarization vector is opposite of depolarization vector) Atrial axis=0-75 degrees")
65
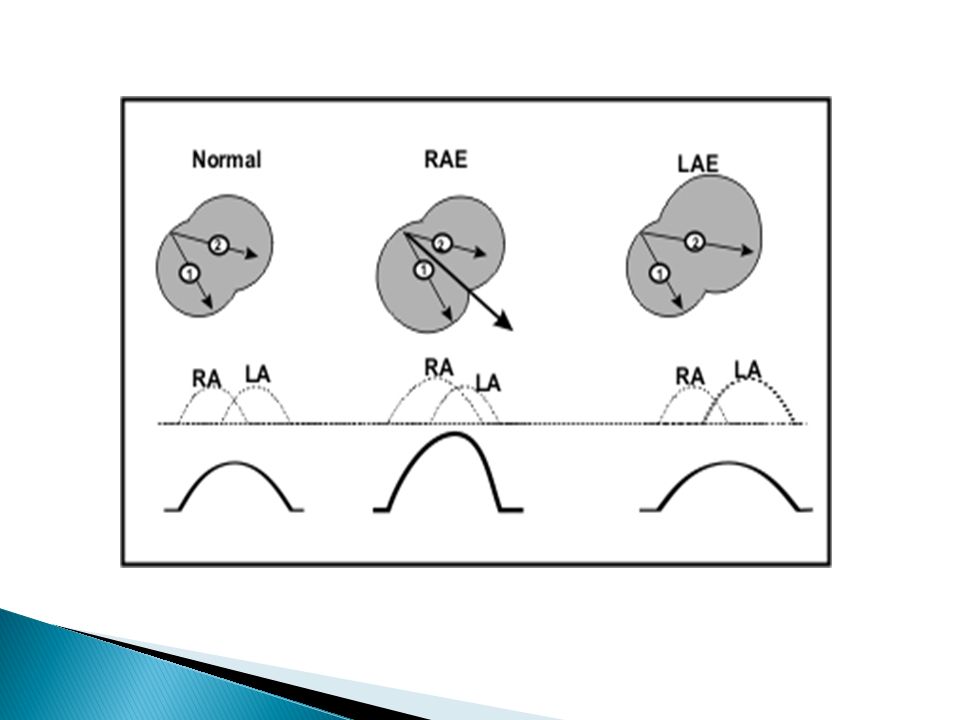
P duration=0.08-0.1 msec Voltage=0.1-0.2 mv RA enlargement-- >2.5 mm LA enlargement-- increased p duration

73
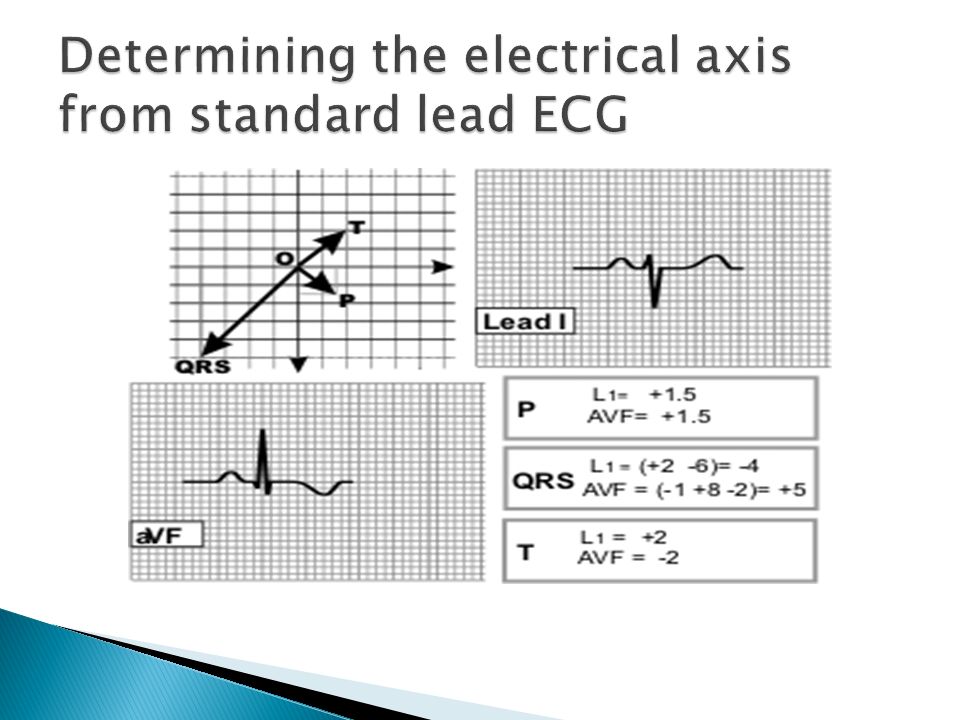
NORMAL AXIS=59 degrees(-30 to105) >40y -30->90 <40y 0-105 TO THE LEFT:obesity,lie down,end of deep expiration LVH,RVH LBBB,RBBB
 >40y -30->90 <40y TO THE LEFT:obesity,lie down,end of deep expiration LVH,RVH LBBB,RBBB")
87
For voltage measuring:from the peak of the R wave to the bottom of S wave When the sum of the voltages of all the QRS of complexs of three standard leads is greater than 4 millivolts,the patient is considered to have a high-voltage ECG RVH,LVH

89
Old MI(decreased voltage and prolongation of QRS) Pericardial effusion(short-circuits the electrical potentials) Pleural effusion Pulmonary emphysema(lungs act as an insulator)
 Pericardial effusion(short-circuits the electrical potentials) Pleural effusion Pulmonary emphysema(lungs act as an insulator)")
90
Normal QRS lasts 0.06-0.08 second Prolonged QRS(0.09 to 0.12) due to ventricular hyperthrophy or dilation In purkinje system block (more than 0.12) Bizarre QRS complex(in multiple scar tissue and block in muscles and purkinje system that leads to irregular impulse conduction and rapid shifts in voltages and axis deviationds
 due to ventricular hyperthrophy or dilation In purkinje system block (more than 0.12) Bizarre QRS complex(in multiple scar tissue and block in muscles and purkinje system that leads to irregular impulse conduction and rapid shifts in voltages and axis deviationds")
91
Damaged heart muscle remains partially or totally depolarized all the time that introduced currents flows between the pathologically depolarized and the normally polarized areas even between heart beats,this is called a current of injury The most common cause is ischemia caused by local coronary occlusion

92
At the end of the depolarization no current flow is seen but at the end of the repolarization injured area is depolaried and leads to current flow from this site to other parts and TP SEGMENT deviation is occurred j-point:the exact point on ECG which the wave of depolarization just completes its passage through the heart,which occurs at the end of the QRS complex

94
T wave is normally positive in all standard bipolar limb leads T wave becomes abnormal when the normal sequence of repolarization doesnot occur Etiology:mild ischemia(shortening of depolarization),delayed conduction of depolarization impulse (LBBB)
,delayed conduction of depolarization impulse (LBBB)")
95
Effect of digitalis on the T wave: In overdosage,depolarization duration in one part of the ventricles,may be increased out of proportion to that of other parts(biphasic T wave or T wave inversion)
")
Similar presentations


>")


>")
 node Atrioventricular (AV) node.>")
>")


