Download presentation
Presentation is loading. Please wait.

1
The Halo Model Structure formation: cosmic capitalism Halos: abundances, clustering and evolution Galaxies: a nonlinear biased view of dark matters Marked correlations: There’s more to the points Ravi K. Sheth (UPitt/UPenn)
.")
2
Galaxy Surveys

3
Galaxy clustering depends on type Large samples now available to quantify this

4
Light is a biased tracer To use galaxies as probes of underlying dark matter distribution, must understand ‘bias’

5
Center-satellite process requires knowledge of 1)halo abundance; 2) halo clustering; 3) halo profiles; 4) how number of galaxies per halo depends on halo mass. (Also a simple model of earthquakes and aftershocks!)
.")
6
Neyman & Scott Hypothesis testing ( J. Neyman ) Model of ozone Model of cancer Model of BCGs ( E. Scott) Clustering model ( Neyman & Scott )
 Clustering model ( Neyman & Scott ).")
7
The halo-model of clustering Two types of pairs: both particles in same halo, or particles in different halos ξ dm (r) = ξ 1h (r) + ξ 2h (r) All physics can be decomposed similarly: influences from within halo, versus from outside ( Sheth 1996 )
 = ξ 1h (r) + ξ 2h (r) All physics can be decomposed similarly: influences from within halo, versus from outside ( Sheth 1996 )")
8
Gaussian fluctuations as seeds of subsequent structure formation Gaussianity simplifies mathematics: logic which follows is general

9
N-body simulations of gravitational clustering in an expanding universe

10
Cold Dark Matter Simulations include gravity only (no gas) Late-time field retains memory of initial conditions Cosmic capitalism Co-moving volume ~ 100 Mpc/h
 Late-time field retains memory of initial conditions Cosmic capitalism Co-moving volume ~ 100 Mpc/h")
11
It’s a capitalist’s life… Most of the action is in the big cities Newcomers to the city are rapidly stripped of (almost!) all they have Encounters generally too high-speed to lead to long-lasting mergers Repeated ‘harassment’ can lead to change Real interactions take place in the outskirts A network exists to channel resources from the fields to feed the cities
 all they have Encounters generally too high-speed to lead to long-lasting mergers Repeated ‘harassment’ can lead to change Real interactions take place in the outskirts A network exists to channel resources from the fields to feed the cities")
12
Spherical evolution model ‘Collapse’ depends on initial over-density i ; same for all initial sizes Critical density depends on cosmology Final objects all have same density, whatever their initial sizes Collapsed objects called halos; ~ 200× denser than background, whatever their mass (Tormen 1998) (Figure shows particles at z~2 which, at z~0, are in a cluster)
 (Figure shows particles at z~2 which, at z~0, are in a cluster)")
13
Spherical evolution model Initially, E i = – GM/R i + (H i R i ) 2 /2 Shells remain concentric as object evolves; if denser than background, object pulls itself together as background expands around it At ‘turnaround’: E = – GM/r max = E i So – GM/r max = – GM/R i + (H i R i ) 2 /2 Hence (R i /r max ) = 1 – H i 2 R i 3 /2GM = 1 – (3H i 2 /8 G) (4 R i 3 /3)/M = 1 – 1/(1+ i ) = i /(1+ i ) ≈ i
 2 /2 Shells remain concentric as object evolves; if denser than background, object pulls itself together as background expands around it At ‘turnaround’: E = – GM/r max = E i So – GM/r max = – GM/R i + (H i R i ) 2 /2 Hence (R i /r max ) = 1 – H i 2 R i 3 /2GM = 1 – (3H i 2 /8 G) (4 R i 3 /3)/M = 1 – 1/(1+ i ) = i /(1+ i ) ≈ i")
14
Virialization Final object virializes: −W = 2K E vir = W+K = W/2 = −GM/2r vir = −GM/r max So r vir = r max /2: final size, density of object determined by initial overdensity To form an object at present time, must have had a critical overdensity initially To form objects at high redshift, must have been even more overdense initially At any given time, all objects have same density (high-z objects denser)
")
15
Virial Motions (R i /r vir ) ~ f( i ): ratio of initial and final sizes depends on initial overdensity Mass M ~ (1+ i )R i 3 ~ R i 3 (since initial overdensity « 1) So final virial density ~ M/r vir 3 ~ (R i /r vir ) 3 ~ function of critical density: hence, at any given time, all virialized objects have the same density, whatever their mass V 2 ~ GM/r vir ~ M 2/3 : massive objects have larger internal velocities/temperatures
 ~ f( i ): ratio of initial and final sizes depends on initial overdensity Mass M ~ (1+ i )R i 3 ~ R i 3 (since initial overdensity « 1) So final virial density ~ M/r vir 3 ~ (R i /r vir ) 3 ~ function of critical density: hence, at any given time, all virialized objects have the same density, whatever their mass V 2 ~ GM/r vir ~ M 2/3 : massive objects have larger internal velocities/temperatures")
16
Spherical evolution model ‘Collapse’ depends on initial over-density i ; same for all initial sizes Critical density depends on cosmology Final objects all have same density, whatever their initial sizes Collapsed objects called halos; ~ 200× denser than background, whatever their mass (Tormen 1998) (Figure shows particles at z~2 which, at z~0, are in a cluster)
 (Figure shows particles at z~2 which, at z~0, are in a cluster)")
17
Initial spatial distribution within patch (at z~1000)... …stochastic (initial conditions Gaussian random field); study `forest’ of merger history ‘trees’ …encodes information about subsequent ‘merger history’ of object (Mo & White 1996; Sheth 1996)
; study `forest’ of merger history ‘trees’ …encodes information about subsequent ‘merger history’ of object (Mo & White 1996; Sheth 1996).")
18
The Halo Mass Function Hierarchical; no massive halos at high-z Halo abundance evolves strongly Massive halos (exponentially) rare Observable → mass difficult (Reed et al. 2003) (current parameterizations by Sheth & Tormen 1999; Jenkins et al. 2001)
 (current parameterizations by Sheth & Tormen 1999; Jenkins et al. 2001).")
19
Non-Maxwellian Velocities? v = v vir + v halo Maxwellian/Gaussian velocity within halo (dispersion depends on parent halo mass) + Gaussian velocity of parent halo (from linear theory ≈ independent of m) Hence, at fixed m, distribution of v is convolution of two Gaussians, i.e., p(v|m) is Gaussian, with dispersion vir 2 (m) + Lin 2 = (m/m * ) 2/3 vir 2 (m * ) + Lin 2
 + Gaussian velocity of parent halo (from linear theory ≈ independent of m) Hence, at fixed m, distribution of v is convolution of two Gaussians, i.e., p(v|m) is Gaussian, with dispersion vir 2 (m) + Lin 2 = (m/m * ) 2/3 vir 2 (m * ) + Lin 2.")
20
Exponential tails are generic p(v) = ∫dm mn(m) G(v|m) F (t) = ∫dv e ivt p(v) = ∫dm n(m)m e -t 2 vir 2 (m)/2 e -t 2 Lin 2 /2 For P(k) ~ k −1, mass function n(m) ~ power-law times exp[−(m/m * ) 2/3 /2], so integral is: F (t) = e -t 2 Lin 2 /2 [1 + t 2 vir 2 (m * )] −1/2 Fourier transform is product of Gaussian and FT of K 0 Bessel function, so p(v) is convolution of G(v) with K 0 (v) Since vir (m * )~ Lin, p(v) ~ Gaussian at |v|< Lin but exponential-like tails extend to large v (Sheth 1996)
![Exponential tails are generic p(v) = ∫dm mn(m) G(v|m) F (t) = ∫dv e ivt p(v) = ∫dm n(m)m e -t 2 vir 2 (m)/2 e -t 2 Lin 2 /2 For P(k) ~ k −1, mass function n(m) ~ power-law times exp[−(m/m * ) 2/3 /2], so integral is: F (t) = e -t 2 Lin 2 /2 [1 + t 2 vir 2 (m * )] −1/2 Fourier transform is product of Gaussian and FT of K 0 Bessel function, so p(v) is convolution of G(v) with K 0 (v) Since vir (m * )~ Lin, p(v) ~ Gaussian at |v|< Lin but exponential-like tails extend to large v (Sheth 1996)](http://images.slideplayer.com/24/7463292/slides/slide_20.jpg "Exponential tails are generic p(v) = ∫dm mn(m) G(v|m) F (t) = ∫dv e ivt p(v) = ∫dm n(m)m e -t 2 vir 2 (m)/2 e -t 2 Lin 2 /2 For P(k) ~ k −1, mass function n(m) ~ power-law times exp[−(m/m * ) 2/3 /2], so integral is: F (t) = e -t 2 Lin 2 /2 [1 + t 2 vir 2 (m * )] −1/2 Fourier transform is product of Gaussian and FT of K 0 Bessel function, so p(v) is convolution of G(v) with K 0 (v) Since vir (m * )~ Lin, p(v) ~ Gaussian at |v|< Lin but exponential-like tails extend to large v (Sheth 1996)")
21
Comparison with simulations Gaussian core with exponential tails as expected! Sheth & Diaferio 2001

22
Universal form? Spherical evolution ( Press & Schechter 1974; Bond et al. 1991 ) Ellipsoidal evolution ( Sheth & Tormen 1999; Sheth, Mo & Tormen 2001 ) Simplifies analysis of cluster abundances (e.g. ACT) Jenkins et al. 2001
 Ellipsoidal evolution ( Sheth & Tormen 1999; Sheth, Mo & Tormen 2001 ) Simplifies analysis of cluster abundances (e.g. ACT) Jenkins et al")
23
Most massive halos populate densest regions over-dense under- dense Key to understand galaxy biasing (Mo & White 1996; Sheth & Tormen 2002) n(m| ) = [1 + b(m) ] n(m)
![Most massive halos populate densest regions over-dense under- dense Key to understand galaxy biasing (Mo & White 1996; Sheth & Tormen 2002) n(m| ) = [1 + b(m) ] n(m)](http://images.slideplayer.com/24/7463292/slides/slide_23.jpg "Most massive halos populate densest regions over-dense under- dense Key to understand galaxy biasing (Mo & White 1996; Sheth & Tormen 2002) n(m| ) = [1 + b(m) ] n(m)")
24
Halo clustering Massive halos more strongly clustered Clustering of halos different from clustering of mass Percival et al. 2003 massive halos dark matter linear theory non-

25
Halo clustering Halo abundances Clustering is ideal (only?) mass calibrator ( Sheth & Tormen 1999)
 mass calibrator ( Sheth & Tormen 1999)")
26
The halo-model of clustering Two types of pairs: both particles in same halo, or particles in different halos ξ dm (r) = ξ 1h (r) + ξ 2h (r) All physics can be decomposed similarly: influences from within halo, versus from outside
 = ξ 1h (r) + ξ 2h (r) All physics can be decomposed similarly: influences from within halo, versus from outside")
27
The dark-matter correlation function ξ dm (r) = ξ 1h (r) + ξ 2h (r) ξ 1h (r) ~ ∫dm n(m) m 2 ξ dm (m|r)/ 2 n(m): number density of halos m 2 : total number of pairs ξ dm (m|r): fraction of pairs which have separation r; depends on density profile within m-halos Need not know spatial distribution of halos! This term only matters on scales smaller than the virial radius of a typical M * halo (~ Mpc) ξ 2h (r) ~ larger scales, depends on halo clustering
 ξ 2h (r) ~ larger scales, depends on halo clustering.")
28
Clustering in simulations ξ dm (r) = ξ 1h (r) + ξ 2h (r) Expect (and see) feature on scale of transition from one- halo to two-halo Feature in data?
 = ξ 1h (r) + ξ 2h (r) Expect (and see) feature on scale of transition from one- halo to two-halo Feature in data")
30
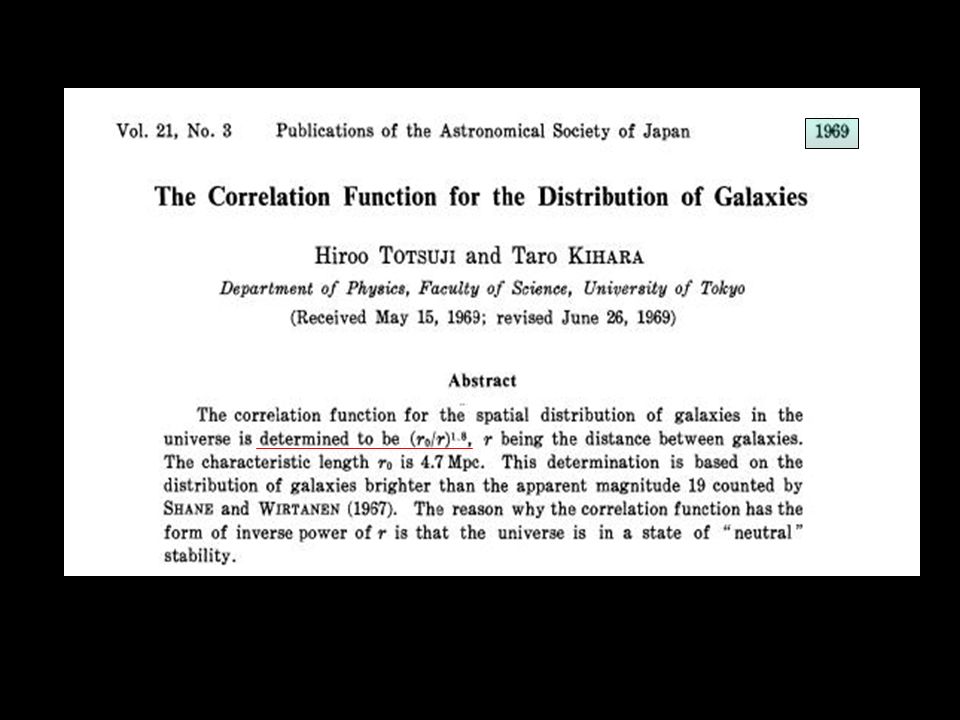
Power-law: (r) = (r 0 /r) slope = -1.8 slope = -1.8 Totsuji & Kihara 1969
 = (r 0 /r) slope = -1.8 slope = -1.8 Totsuji & Kihara 1969")
31
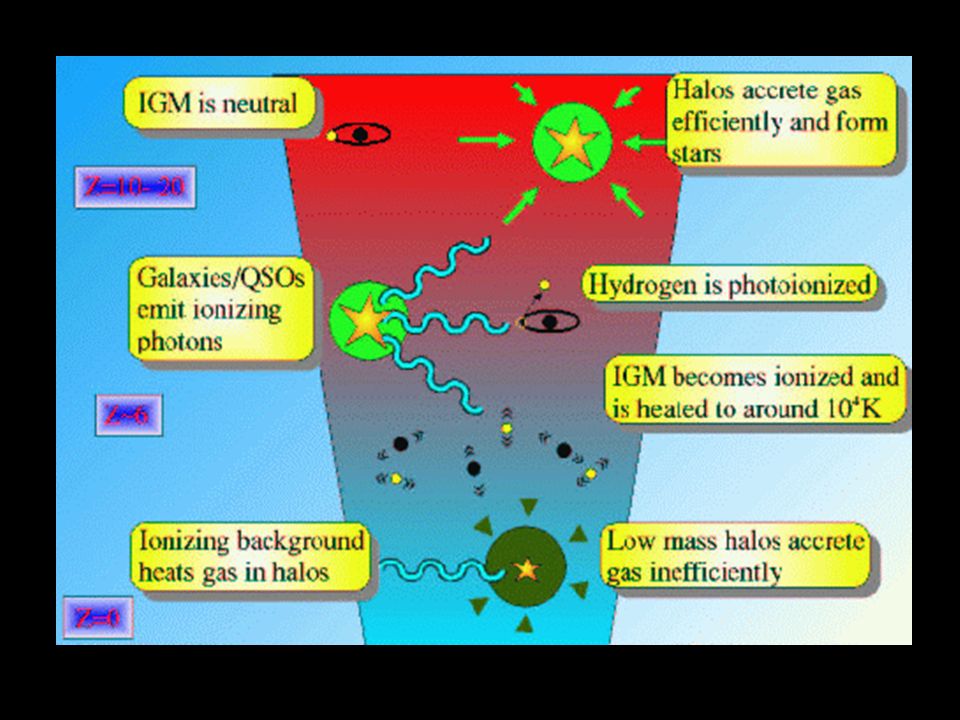
Galaxy formation Gas cools in virialized dark matter ‘halos’. Physics of halos is nonlinear, but primarily gravitational Complicated gastrophysics (star formation, supernovae enrichment, etc.) mainly determined by local environment (i.e., by parent halo), not by surrounding halos
 mainly determined by local environment (i.e., by parent halo), not by surrounding halos.")
34
(Cole et al. 2000)
")
35
Kauffmann, Diaferio, Colberg & White 1999 Also Cole et al., Benson et al., Somerville & Primack, Colin et al. Colors indicate age

36
Halo-model of galaxy clustering Two types of pairs: only difference from dark matter is that now, number of pairs in m-halo is not m 2 ξ dm (r) = ξ 1h (r) + ξ 2h (r) Spatial distribution within halos is small-scale detail
 = ξ 1h (r) + ξ 2h (r) Spatial distribution within halos is small-scale detail")
37
The galaxy correlation function ξ dm (r) = ξ 1h (r) + ξ 2h (r) ξ 1h (r) ~ ∫dm n(m) g 2 (m) ξ dm (m|r)/ 2 n(m): number density of halos g 2 (m): total number of galaxy pairs ξ dm (m|r): fraction of pairs which have separation r; depends on density profile within m-halos Need not know spatial distribution of halos! This term only matters on scales smaller than the virial radius of a typical M * halo (~ Mpc) ξ 2h (r) ~ larger scales, depends on halo clustering
 ξ 2h (r) ~ larger scales, depends on halo clustering.")
38
Type-dependent clustering: Why? populate massive halos populate lower mass halos Spatial distribution within halos second order effect (on >100 kpc)
.")
39
Comparison with simulations Halo model calculation of (r) Red galaxies Dark matter Blue galaxies Note inflection at scale of transition from 1-halo term to 2-halo term Bias constant at large r 1h › 2h 1h ‹ 2h → Sheth et al. 2001 steeper shallower

40
Color dependent clustering Reddest galaxies (oldest stars) in most massive halos? Form of g(m) required to match clustering data summarizes and constrains effects of complicated gastrophysics. Zehavi et al. (SDSS) steeper shallower
 required to match clustering data summarizes and constrains effects of complicated gastrophysics. Zehavi et al. (SDSS) steeper shallower.")
41
Galaxy formation models ~ correctly identify the halos in which galaxies form Galaxy ~ halo substructure is reasonable model

42
A Nonlinear and Biased View Observations of galaxy clustering on large scales provide information about cosmology (because clustering on large scales is still in the ‘linear’ regime) Observations of small scale galaxy clustering provide a nonlinear, biased view of the dark matter density field, but they do contain a wealth of information about galaxy formation g(m) characterizes this information and so can inform galaxy formation models
 Observations of small scale galaxy clustering provide a nonlinear, biased view of the dark matter density field, but they do contain a wealth of information about galaxy formation g(m) characterizes this information and so can inform galaxy formation models")
43
Successes and Failures Distribution of sizes ~ Lognormal: seen in SDSS Morphology-density relation (oldest stars in clusters/youngest in field) Type-dependent clustering: red galaxies have steep correlation function; clustering strength increases with luminosity Distribution of luminosities Correlations between observables (luminosity/color, luminosity/velocity dispersion)
 Type-dependent clustering: red galaxies have steep correlation function; clustering strength increases with luminosity Distribution of luminosities Correlations between observables (luminosity/color, luminosity/velocity dispersion)")
44
Sizes of disks and bulges Observed distribution ~ Lognormal Distribution of halo spins ~ Lognormal Distribution of halo concentrations ~ Lognormal (Bernardi et al. 2003; Kauffmann et al. 2003; Shen et al. 2003)
.")
45
The ISW effect Cross-correlate CMB and galaxy distributions Interpretation requires understanding of galaxy population

46
Cross-correlate LRGs with CMB Measured signal combination of ISW and SZ effects Estimate both using halo model (although signal dominated by linear theory); Signal predicted to depend on b(a) D(a) d/dt [D(a)/a]
![Cross-correlate LRGs with CMB Measured signal combination of ISW and SZ effects Estimate both using halo model (although signal dominated by linear theory); Signal predicted to depend on b(a) D(a) d/dt [D(a)/a]](http://images.slideplayer.com/24/7463292/slides/slide_46.jpg "Cross-correlate LRGs with CMB Measured signal combination of ISW and SZ effects Estimate both using halo model (although signal dominated by linear theory); Signal predicted to depend on b(a) D(a) d/dt [D(a)/a]")
47
Evolution and bias Work in progress to disentangle evolution of bias from z dependence of signal (Scranton et al. 2004)
.")
48
Halo clustering Halo abundances Clustering is ideal (only?) mass calibrator ( Sheth & Tormen 1999)
 mass calibrator ( Sheth & Tormen 1999)")
49
Environmental effects Fundamental assumption: all environmental trends come from fact that massive halos populate densest regions

50
Summary Hierarchical clustering = cosmic capitalism: Many models (percolation, coagulation, random walks) give equivalent descriptions All models separate cosmology/dynamics from statistics P(k) Gastrophysics determined by mass of parent halo All effects of density (environment) arise through halo bias (massive halos populate densest regions) Description quite detailed; language of halo model also useful for other ‘biased’ observables
 give equivalent descriptions All models separate cosmology/dynamics from statistics P(k) Gastrophysics determined by mass of parent halo All effects of density (environment) arise through halo bias (massive halos populate densest regions) Description quite detailed; language of halo model also useful for other ‘biased’ observables")
51
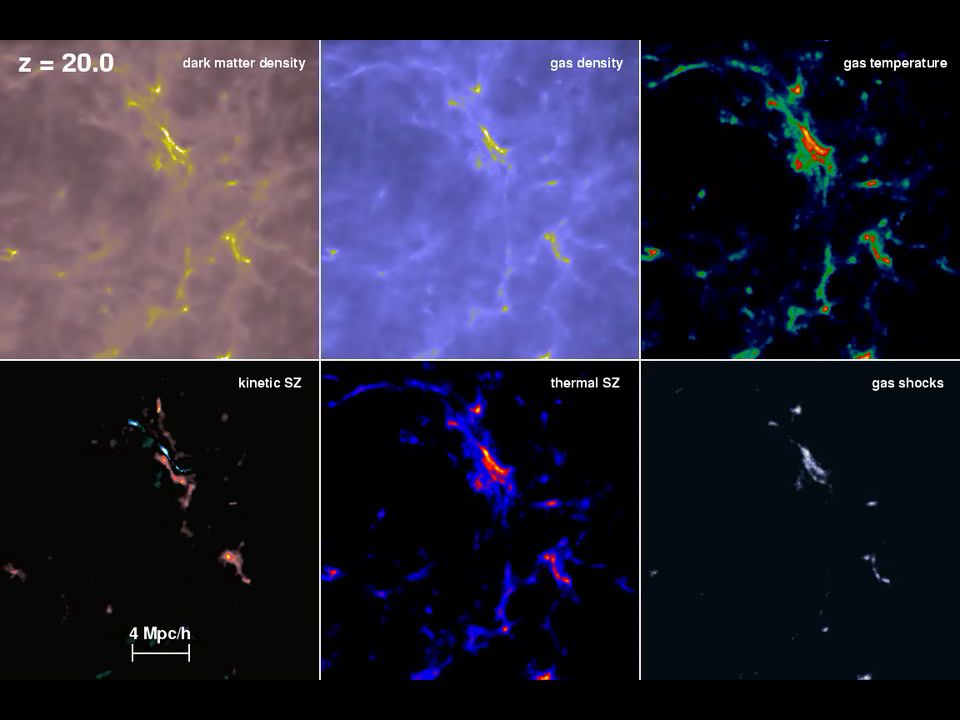
Halo Model Describes spatial statistics well Describes velocity statistics well Since Momentum ~ mv, Temp ~ v 2 ~ m 2/3, and Pressure ~ Density ×Temp Halo Model useful language for interpreting Kinematic and Thermal SZ effects, various secondary contributions to CMB, and gravitational lensing (see Cooray & Sheth 2002 review) Open problem: Describe Ly- forest
 Open problem: Describe Ly- forest")
53
Marked correlation functions Weight galaxies by some observable (e.g. luminosity, color, SFR) when computing clustering statistics (standard analysis weights by zero or one)
 when computing clustering statistics (standard analysis weights by zero or one).")
54
There’s more to the point(s) Multi-band photometry becoming the norm CCDs provide accurate photometry; possible to exploit more than just spatial information How to estimate clustering of observables, over and above correlations which are due to spatial clustering? Do galaxy properties depend on environment? Standard model says only dependence comes from parent halos…

55
Marked correlations (usual correlation function analysis sets m = 1 for all galaxies) W(r) is a ‘weighted’ correlation function, so … marked correlations are related to weighted (r)
 W(r) is a ‘weighted’ correlation function, so … marked correlations are related to weighted (r)")
56
Luminosity as a mark M r from SDSS BIK from semi-analytic model Little B-band light associated with close pairs; more B-band light in ‘field’ than ‘ clusters’ Vice-versa in K Feature at 3/h Mpc in all bands: Same physical process the cause? e.g. galaxies form in groups at the outskirts of clusters

57
Colors and star formation Close pairs tend to be redder Scale on which feature appears smaller at higher z: clusters smaller at high-z? Amplitude drops at lower z: close red pairs merged? Close pairs have small star formation rates; scale similar to that for color even though curves show opposite trends! Same physics drives both color and SFR?

58
Stellar mass Circles show M *, crosses show L K Similar bumps, wiggles in both: offset related to rms M *, L Evolution with time: M * grows more rapidly in dense regions

59
Halo-model of marked correlations Again, write in terms of two components: W 1gal (r) ~ ∫dm n(m) g 2 (m) ‹W|m› 2 ξ dm (m|r)/ gal 2 W 2gal (r) ≈ [∫dm n(m) g 1 (m) ‹W|m› b(m)/ gal ] 2 ξ dm (r) So, on large scales, expect M(r) = 1+W(r) 1+ξ(r) = 1 + B W ξ dm (r) 1 + b gal ξ dm (r)
![Halo-model of marked correlations Again, write in terms of two components: W 1gal (r) ~ ∫dm n(m) g 2 (m) ‹W|m› 2 ξ dm (m|r)/ gal 2 W 2gal (r) ≈ [∫dm n(m) g 1 (m) ‹W|m› b(m)/ gal ] 2 ξ dm (r) So, on large scales, expect M(r) = 1+W(r) 1+ξ(r) = 1 + B W ξ dm (r) 1 + b gal ξ dm (r)](http://images.slideplayer.com/24/7463292/slides/slide_59.jpg "Halo-model of marked correlations Again, write in terms of two components: W 1gal (r) ~ ∫dm n(m) g 2 (m) ‹W|m› 2 ξ dm (m|r)/ gal 2 W 2gal (r) ≈ [∫dm n(m) g 1 (m) ‹W|m› b(m)/ gal ] 2 ξ dm (r) So, on large scales, expect M(r) = 1+W(r) 1+ξ(r) = 1 + B W ξ dm (r) 1 + b gal ξ dm (r)")
60
Conclusions (mark these words!) Marked correlations represent efficient use of information in new high-quality multi-band datasets (there’s more to the points…) –No ad hoc division into cluster/field, bright/faint, etc. Comparison of SDSS/SAMs ongoing –test N galaxies (m); –then test if rank ordering OK; –finally test actual values Halo-model is natural language to interpret/model
; –then test if rank ordering OK; –finally test actual values Halo-model is natural language to interpret/model.")
61
Halo-model calculations Type-dependent (n-pt) clustering ISW and tracer population SZ effect and halo shapes/motions Weak gravitational lensing Absorption line systems Marked correlations } Review in Cooray & Sheth 2002 } Work in progress
 clustering ISW and tracer population SZ effect and halo shapes/motions Weak gravitational lensing Absorption line systems Marked correlations } Review in Cooray & Sheth 2002 } Work in progress")
62
The Holy Grail Halo model provides natural framework within which to discuss, interpret most measures of clustering; it is the natural language of galaxy ‘bias’ The Halo Grail

63
Grail = Bowl? Dish?

64
The Cup! India Cricket World Champions

Similar presentations


 25 th October 2007 ICC Photo: Malcolm Crowthers Collaborators: Geraint Harker John Helly.>")
 Steve Wilkins (Cambridge) Imperial College.>")

>")


 Joel R. Primack 2009, eprint arXiv:0909.2021 Presented by: Michael Solway.>")


