Download presentation
Presentation is loading. Please wait.

1
FINANCIAL PLAN Assoc. Prof. Dr. Ismail Ab.Wahab
Assoc. Prof. Hj. Wan Ismail Wan Mamat Assoc. Prof. Dr. Mohamed Dahlan Ibrahim

2
LEARNING OUTCOMES At the end of the session, students should be able to: Understand the importance of preparing a financial plan Understand the process of developing a financial plan Identify the components of a financial plan Analyse the financial position of the proposed business Prepare a financial plan for a small business

3
INTRODUCTION A financial plan incorporates all financial data derived from the operating budgets i.e. the marketing, production (or operations) and administration budgets. Financial information from the operating budgets is then translated or transformed into a financial budget. Based on the financial data, projections are prepared via the following pro forma statements: Cash flow Income (or profit and loss) statement Balance sheet.
 and administration budgets. Financial information from the operating budgets is then translated or transformed into a financial budget. Based on the financial data, projections are prepared via the following pro forma statements: Cash flow. Income (or profit and loss) statement. Balance sheet.")
4
THE IMPORTANCE OF A FINANCIAL PLAN
A financial plan is crucial to the overall business plan that is developed for a particular business or project. Its importance can be summarised as follows: To determine the size of investment To identify and propose the relevant sources of finance To ensure that the initial capital is sufficient To analyse the viability of the project before actual investment is committed To be used as a guideline for project implementation

5
THE PROCESS OF DEVELOPING A FINANCIAL PLAN
To develop a workable and meaningful financial plan, the entrepreneur has to follow these steps: Step 1: Gather all financial inputs Step 2: Determine the project implementation cost Step 3: Determine the sources of finance Step 4: Prepare the pro forma cash flow statement Step 5: Prepare the pro forma income statement Step 6: Prepare the pro forma balance sheets Step 7: Perform basic financial analysis

6
Step 1: Gather the Financial Input (contd.)
The process of developing a financial plan for a specific project begins with the accumulation of financial information from the marketing, operations and organizational plans. The financial requirements for each plan are presented in the form of budgets known as operating budgets (i.e. marketing, operations and organisation budgets)
")
7
Step 1: Gather the Financial Input (contd.)
In addition, the monthly or annual sales forecast derived earlier in the marketing plan is a very important input for the financial plan. After gathering all information the financial plan is prepared in terms of financial budget.

8
Marketing Plan Organizational Plan Financial Plan Operations Plan
Sales Forecast Marketing Budget Organizational Plan Administrative Budget Financial Plan Project implementation cost Sources of financing Pro forma cash flow statement Pro forma income statement Pro forma balance sheet Financial Analysis Operations Plan Operations Budget

9
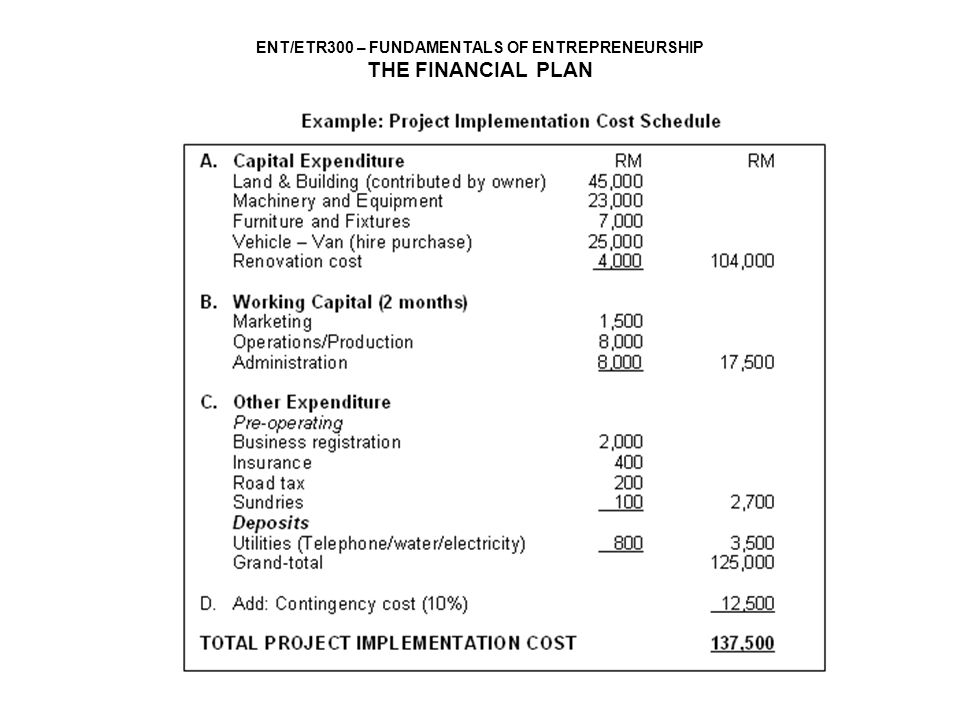
Step 2: Determine the Project Implementation Cost
A project implementation cost incorporates both long-term and short-term expenditure needed to start a project. Long-term expenditure refers to such expenditure as the procurement of plant, machinery, equipment, vehicles and other fixed assets needed by the new business.

10
Step 2: Determine the Project Implementation Cost (contd.)
Short-term expenditure, such as payments of utilities, salaries and wages, factory overheads, purchase of raw materials or inventories, represent the amount of initial working capital required to finance the daily operation until the business gets its first sale. Components of project implementation cost: Capital expenditure Working capital Other expenditure Contingency cost

12
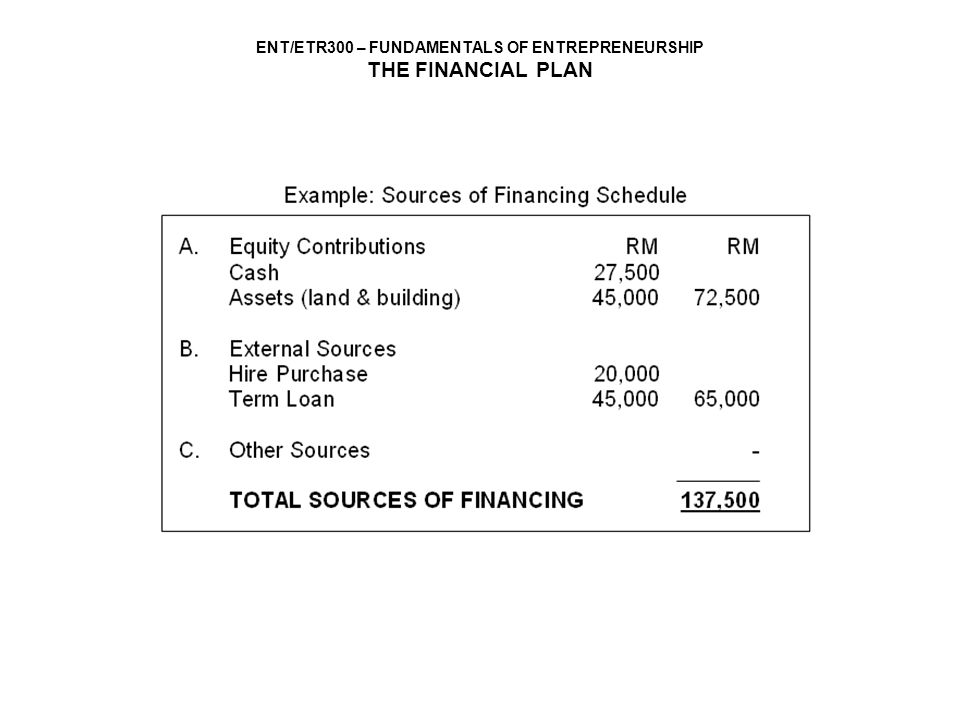
Step 3: Determine the Sources of Finance
Sources of finance refers to the sources where funds to finance a particular project’s implementation costs can be secured. These can be categorised into internal and external sources. The internal sources mainly come in the form of equity contributions from the entrepreneurs. These contributions can either be in the form of cash or other assets.

13
Step 3: Determine the Sources of Finance (contd.)
External sources of finance are mainly derived from commercial banks, finance companies and government agencies. It may come in the form of term loans, hire purchase or grants. The total amount of funds that has to be sourced should equal the total project implementation cost calculated earlier. This is to ensure that the project is fully funded and to avoid the risks of under-financing.

14
Step 3: Determine the Sources of Finance (contd.)
Components of sources of finance: Internal sources Equity contributions (cash and/or assets) External sources Term loan Hire purchase Others
 External sources. Term loan. Hire purchase. Others.")
16
Step 4: Prepare Pro Forma Cash Flow Statement
Pro forma cash flow statement refers to the projected statement of cash inflow and outflow throughout the planned period. Under normal circumstances, the pro forma cash flow statement is prepared for three consecutive years, detailed by month for the first year and by year for the second and third years. However, longer periods are sometimes needed depending upon the projects undertaken.

17
Step 4: Prepare Pro Forma Cash Flow Statement (contd.)
The total amount of funds that has to be sourced should equal the total project implementation cost calculated earlier. This is to ensure that the project is fully funded as well as to avoid the risks of under-financing.

18
Step 4: Prepare Pro Forma Cash Flow Statement (contd.)
The pro forma cash flow statement must be able to show the following information: Cash inflows – the projected amount of cash flowing into the business. Cash outflows – the projected amount of cash flowing out of the business. Cash deficit or surplus – the difference between cash inflows and outflows. Cash position – the beginning and ending cash balances for a particular period.

19
Step 4: Prepare Pro Forma Cash Flow Statement (contd.)
Elements of cash inflows: Equity contribution (cash) Term loan Cash sales Collection of receivables Others
 Term loan. Cash sales. Collection of receivables. Others.")
20
Step 4: Prepare Pro Forma Cash Flow Statement (contd.)
Elements of cash outflows: Marketing expenditure Operations expenditure Administrative expenditure Term loan repayment Hire purchase repayment Purchase of fixed assets Pre-operating expenditure Payments for deposits Miscellaneous expenditure

21
Example: Pro Forma Cash Flow Statement

22
Example: Pro Forma Cash Flow Statement (contd.)
")
23
Step 5: Prepare Pro Forma Income Statement
The next step in developing a financial plan is to prepare the pro forma income statement which shows the expected profit or loss for the planned period, usually for three consecutive years. The pro forma income statement consists of the following elements: Sales Gross Income Net Income Before Tax

24
Step 5: Prepare Pro Forma Income Statement (contd.)
Net income before tax is derived as follows: Sales - Cost of Sales = Gross Profit Gross Profit - Operating Expenses = Net Income before tax

25
Example: Pro Forma Income Statement
Year 1 Year 2 Year 3 Sales 240, , ,400 Cost of sales 94, , ,940 Gross profit 145, , ,460 Less: Operating Expenses Marketing expenses 18,000 18,900 19,845 Administrative expenses 96, , ,840 Depreciation charges 7,200 7,200 7,200 Miscellaneous 2, 123, , ,485 Operating income 21,500 44,600 74,975 Less: Financing expenses: Interest on term loan 4,500 3,600 2,700 Interest on hire-purchase 1,600 1,600 1,600 6, , ,300 Net profit before tax 15,400 39,400 70,675

26
Step 6: Prepare Pro Forma Balance Sheet
While the pro forma income statement shows the financial performance of the business for the planned period, the pro forma balance sheet shows the financial position of the business at a specific point in time in terms of assets owned and how those assets are financed. The pro forma balance sheet is normally prepared for a period of three years.

27
Step 6: Prepare Pro Forma Balance Sheet (contd.)
The pro forma balance sheet consists of the following elements: The balance sheet shows the following equation: Assets = Owners’ equity + Liabilities Assets Owners’ equity Liabilities

28
Step 6: Prepare Pro Forma Balance Sheet (contd.)
Assets are the economic resources of a business that are expected to be of benefit in the future. Assets reported in the balance sheet are generally categorised into two categories: non-current and current assets. Non-current assets include fixed assets and other assets that are owned and usually held to produce products or services. These assets are not intended for sale in the short term. Examples: property, plant, machinery, equipment, vehicles, major renovations and long-term investments. For fixed assets, the values shown in the balance sheet are the book value i.e. the original cost less the accumulated depreciation.

29
Step 6: Prepare Pro Forma Balance Sheet (contd.)
Current assets are short-term assets that can be converted into cash within a year. Examples: cash, inventories (raw materials, work-in-process and/or finished goods), receivables and other short-term investments. Owners’ equity refers to capital contributions from the owners or shareholders in terms of cash or assets plus the accumulated amount of net income. However, if the business suffers a loss, the amount of loss will be deducted from the capital contributions.
, receivables and other short-term investments. Owners’ equity refers to capital contributions from the owners or shareholders in terms of cash or assets plus the accumulated amount of net income. However, if the business suffers a loss, the amount of loss will be deducted from the capital contributions.")
30
Step 6: Prepare Pro Forma Balance Sheet (contd.)
Liabilities are the amounts owed by the business to outsiders. They are categorised as non-current (long-term) and current liabilities. Non-current or long-term liabilities refer to the long-term obligations of the business that mature in a period of more than one year. They usually include long-term loans as well as hire purchase. Current liabilities refer to the short-term obligations of the business that mature within a period of less than a year. The most common forms of current liabilities are accounts payable and accrued payments
 and current liabilities. Non-current or long-term liabilities refer to the long-term obligations of the business that mature in a period of more than one year. They usually include long-term loans as well as hire purchase. Current liabilities refer to the short-term obligations of the business that mature within a period of less than a year. The most common forms of current liabilities are accounts payable and accrued payments.")
31
Step 6: Prepare Pro Forma Balance Sheet (contd.)
Liabilities are the amounts owed by the business to outsiders. They are categorised as non-current (long-term) and current liabilities. Non-current or long-term liabilities refer to the long-term obligations of the business that mature in a period of more than one year. They usually include long-term loans as well as hire purchase.
 and current liabilities. Non-current or long-term liabilities refer to the long-term obligations of the business that mature in a period of more than one year. They usually include long-term loans as well as hire purchase.")
32
Example: Pro Forma Balance Sheet
Year 1 Year 2 Year3 Non-Current Assets (book value) Land & building 45,000 45,000 45,000 Machinery & equipment 18,400 13,800 9,200 Furniture & fixtures 5,600 4,200 2,800 Renovation 3,200 2,400 1,600 Vehicles 20,000 15,000 10,000 Deposit 93,000 81,200 69,400 Current Assets Inventory of raw materials 3,000 3,500 4,000 Inventory of finished goods 3,000 4,000 5,000 Cash 40,900 77, ,575 46,900 85, ,575 Total Assets 139, , ,975 Owners’ Equity Capital 72,500 72,500 72,500 Accumulated profit 15, , ,475 87, , ,975 Long-term Liabilities Term loan 36,000 27,000 18,000 Hire-purchase 16,000 12, ,000 52, , ,000 Total Owners’ Equity & Liabilities , ,975
 Land & building 45,000 45,000 45,000. Machinery & equipment 18,400 13,800 9,200. Furniture & fixtures 5,600 4,200 2,800. Renovation 3,200 2,400 1,600. Vehicles 20,000 15,000 10,000. Deposit ,000 81,200 69,400. Current Assets. Inventory of raw materials 3,000 3,500 4,000. Inventory of finished goods 3,000 4,000 5,000. Cash 40,900 77, , ,900 85, ,575. Total Assets 139, , ,975. Owners’ Equity. Capital 72,500 72,500 72,500. Accumulated profit 15,400 54, , , , ,975. Long-term Liabilities. Term loan 36,000 27,000 18,000. Hire-purchase 16,000 12,000 8, ,000 39,000 26,000. Total Owners’ Equity & Liabilities , ,975.")
33
Step 7: Perform Basic Financial Analysis
Financial analysis is a technique of examining financial statements to help the entrepreneur analyse the financial position and performance of the business. Financial analysis involves two basic steps: generating the information from the financial statements and interpreting the results. The most common form of financial analysis is “ratio analysis”.

34
Step 7: Perform Basic Financial Analysis (contd.)
Financial ratios are normally used to compare figures from the financial statement with other figures, so that the true meaning of financial pictures can be obtained. There are various financial ratios that the entrepreneur can look at. However, the most commonly considered ratios in small business decision-making fall into four categories: liquidity, efficiency, profitability and solvency. For illustrative purposes, financial data presented in pro forma financial statements in the next slides will be used.

35
Pro Forma Income Statement
Year 1 Year 2 Year 3 Sales 576, , ,880 Cost of sales 227, , ,460 Gross profit 349, , ,420 Less: Operating Expenses Marketing expenses 56,500 62,150 68,365 Administrative expenses 226, , ,460 Depreciation charges 21,000 21,000 21,000 Other operating expenses , , ,000 308, , ,825 Operating income 40, , ,595 Less: Financing expenses: Interest on term loan 16,500 13, ,900 Net income before tax 24,000 58, ,695

36
Pro Forma Balance Sheet
Year 1 Year 2 Year3 Non-Current Assets (book value) Land & building 100, , ,000 Motor vehicles 64,000 48,000 32,000 Office equipment 5,600 3,000 2,000 Renovation 16,000 12,000 8,000 Machinery 32,000 24,000 16,000 Other assets (deposits) 1, , ,000 217, , ,000 Current Assets Inventory of raw materials 2,000 3,000 4,000 Inventory of finished goods 5,000 6,000 8,000 Cash , , ,645 53, , ,645 Total Assets 270, , ,645 Owners’ Equity Capital 105, , ,500 Accumulated profit 24, , ,545 129, , ,045 Long-term Liabilities Term loan 132,000 99,000 66,000 Current Liabilities Accounts payable 9, , ,600 Total Owners’ Equity & Liabilities , ,645
 Land & building 100, , ,000. Motor vehicles 64,000 48,000 32,000. Office equipment 5,600 3,000 2,000. Renovation 16,000 12,000 8,000. Machinery 32,000 24,000 16,000. Other assets (deposits) 1,000 1,000 1, , , ,000. Current Assets. Inventory of raw materials 2,000 3,000 4,000. Inventory of finished goods 5,000 6,000 8,000. Cash 46, , , , , ,645. Total Assets 270, , ,645. Owners’ Equity. Capital 105, , ,500. Accumulated profit 24,000 82, , , , ,045. Long-term Liabilities. Term loan 132,000 99,000 66,000. Current Liabilities. Accounts payable 9,000 15,000 21,600. Total Owners’ Equity & Liabilities , ,645.")
37
Step 7: Perform Basic Financial Analysis (contd.)
Liquidity Ratios The term liquidity refers to the availability of liquid assets to meet short-term obligations. Thus, liquidity ratios measure the ability of the business to pay its monthly bills. The most widely used liquidity ratios are current ratio and quick ratio.

38
Step 7: Perform Basic Financial Analysis (contd.)
Current ratio can be determined by dividing total current assets by total current liabilities. Generally, this ratio shows the business’ ability to generate cash to meet its short-term obligations. Current ratio = Total current assets Total current liabilities Year 1 Year 2 Year 3 Current assets RM53,500 RM114,350 RM256,645 Curent liabilities RM 9,000 RM15,000 RM 21,600 Current Ratio 5.94 7.62 11.88

39
Step 7: Perform Basic Financial Analysis (contd.)
If the business’ current ratio falls below 1, it means that the business is in a serious liquidity situation. In most cases, the comfortable current ratio for most businesses is ‘2’. Quick ratio, also known as the acid test ratio, measures the extent to which current liabilities are covered by liquid assets. To determine quick ratio, the calculation of liquid assets does not take into account inventrories since it is sometimes difficult to convert them into cash quickly.

40
Step 7: Perform Basic Financial Analysis (contd.)
Quick ratio = Total current assets-inventories Total current liabilities Year 1 Year 2 Year 3 Current assets RM53,500 RM114,350 RM256,645 Inventories RM 7,000 RM 9,000 RM 12,000 Current liabilities RM 9,000 RM15,000 RM 21,600 Quick Ratio 5.17 7.02 11.33 In most cases, the comfortable quick ratio is ‘1’.

41
Step 7: Perform Basic Financial Analysis (contd.)
Efficiency Ratios The efficiency ratios measure how efficient the business uses its assets to generate sales. The most widely used efficiency ratio for planning purposes is inventory turnover ratio.

42
Step 7: Perform Basic Financial Analysis (contd.)
Inventory turnover (or stock turnover) measures the number of times inventories have been converted into sales and indicates how liquid the inventory is. All other things being equal, the higher the turnover figure, the more liquid the business is. This ratio divides the cost of sales (or cost of goods sold) by the average value of inventory. The average value of inventory is derived by adding the opening and closing balance of and dividing the total by two. Inventory turnover = Cost of sales Average inventory
 measures the number of times inventories have been converted into sales and indicates how liquid the inventory is. All other things being equal, the higher the turnover figure, the more liquid the business is. This ratio divides the cost of sales (or cost of goods sold) by the average value of inventory. The average value of inventory is derived by adding the opening and closing balance of and dividing the total by two. Inventory turnover = Cost of sales Average inventory.")
43
Step 7: Perform Basic Financial Analysis (contd.)
Year 1 Year 2 Year 3 Cost of sales RM227,000 RM254,600 RM278,460 Average inventory RM 7,000 RM8,000 RM 10,500 Inventory turnover 32.42 times 31.83 times 26.5 times

44
Step 7: Perform Basic Financial Analysis (contd.)
Profitability Ratios Profitability ratios are important indicators of the business’ financial performance. Investors will particularly be interested in these ratios since they measure the performance and growth potential of the business. Some of the commonly used profitability ratios are gross profit margin, net profit margin, return on assets and return on equity.

45
Step 7: Perform Basic Financial Analysis (contd.)
Gross profit margin give a good indication of financial health of the business. Without an adequate gross margin, the business will be unable to pay its operating and other expenses. Gross profit margin is calculated by dividing the business gross income by sales. Gross profit margin = Gross profit Sales

46
Step 7: Perform Basic Financial Analysis (contd.)
Year 1 Year 2 Year 3 Gross profit RM349,000 RM407,800 RM516,420 Sales RM576,000 RM662,400 RM794,880 Gross profit margin 60.59% 61.56% 64.97% Net profit margin is an indication of how effective the business is at cost control. The higher the net profit margin, the more effective the business is at converting sales into actual profit.

47
Step 7: Perform Basic Financial Analysis (contd.)
Net profit margin is calculated by dividing the business net income by sales. Net profit margin = Net profit Sales Year 1 Year 2 Year 3 Net profit RM 24,000 RM 58,850 RM139,695 Sales RM576,000 RM662,400 RM794,880 Net profit margin 4.16% 8.88% 17.57%

48
Step 7: Perform Basic Financial Analysis (contd.)
Return of assets measures the overall return that the business is able to make on its assets. This ratio is derived by dividing the business net profit by total assets. Return on assets = Net profit Total assets Year 1 Year 2 Year 3 Net profit RM 24,000 RM 58,850 RM139,695 Total assets RM270,000 RM302,350 RM415,645 Return on assets 8.89% 19.46% 33.61%

49
Step 7: Perform Basic Financial Analysis (contd.)
Return of equity shows what the business has earned on its owners’ investment in the business. This ratio is derived by dividing the business net profit by total equity. Return on equity = Net profit Total equity Year 1 Year 2 Year 3 Net profit RM 24,000 RM 58,850 RM139,695 Total equity RM129,500 RM188,350 RM328,045 Return on equity 18.53% 31.25% 42.58%

50
Step 7: Perform Basic Financial Analysis (contd.)
Solvency Ratios This final category of ratios is designed to help the entrepreneur measure the degree of financial risk that his business faces. By referring to this ratio, the entrepreneur can assess his level of debt and decide whether it is appropriate for the business. The most commonly used solvency ratios are total debt (liabilities) to equity (also known as leverage or gearing), total debt to total assets, and times interest earned (also known as interest coverage).
 to equity (also known as leverage or gearing), total debt to total assets, and times interest earned (also known as interest coverage).")
51
Step 7: Perform Basic Financial Analysis (contd.)
The total debt to equity ratio indicates what proportion of equity and debt that the company is using to finance its assets. This ratio is calculated by dividing the the total debt by total equity. Debt to equity ratio = Total debt Total equity Year 1 Year 2 Year 3 Total debt RM141,000 RM114,000 RM 87,600 Total equity RM129,500 RM188,350 RM328,045 Debt to equity ratio 1.09 : 1 0.61 : 1 0.27 : 1

52
Step 7: Perform Basic Financial Analysis (contd.)
The debt to asset ratio measures the percentage of the business’ assets financed by creditors relative to the percentage financed by the entrepreneur. This ratio is calculated by dividing the total debts by total assets. Debt to equity ratio = Total debts Total assets Year 1 Year 2 Year 3 Total debts RM141,000 RM114,000 RM87,600 Total assets RM270,500 RM302,350 RM415,645 Debt to total assets ratio 52.13% 37.70% 21.08%

53
Step 7: Perform Basic Financial Analysis (contd.)
Times interest earned ratio measures the number of times interest expense can be covered by profit before interest and tax. This ratio is calculated by dividing total interest expense by profit before interest and tax. Time interest earned = Profit before interest & tax Interest expense Year 1 Year 2 Year 3 Profit before interest RM40,500 RM72,050 RM149,595 Interest expense RM16,500 RM13,200 RM9,900 Time interest earned 2.45 times 5.46 times 15.11 times

54
SUMMARY The financial plan is an important part of the business plan. It incorporates all financial data derived from the operating budgets, i.e. marketing, operations and administrative budgets. Based on this financial data, several financial projection tools are prepared to provide the entrepreneur with a clear picture of the amount of money needed to start a business, sources of finance, the amount of cash available and the financial performance and position of the business.

55
SUMMARY (contd.) The output of a financial plan covers project implementation cost schedule, sources of financing schedule, pro forma cash flow statement, pro forma income statement , and pro forma balance sheet. The business financial data gathered in the financial statements are analysed in order to obtain an overall financial picture of the business. The financial ratios are used to analyse the financial performance of the business.

56
END OF MODULE 11

Similar presentations


 – Concepts, philosophies and procedures.>")


