Download presentation
Presentation is loading. Please wait.

1
Mechanical Properties
Lec-3-2

2
Mechanical Properties
Stress and strain: What are they and why are they used instead of load and deformation? 2. Elastic behavior: when loads are small, how much deformation occurs? What materials deform least? 3. Plastic behavior: At what point to dislocations cause permanent deformation? What materials are most resistant to permanent deformation? 4. Toughness and ductility: What are they and how do we measure them?

4
Tension test Tension test is the most common test for determining the strength-deformation characteristics of materials. There are 3 types of strain: (a) tensile, (b) compressive and (c) shear.
 tensile, (b) compressive and (c) shear.")
5
Tensile-Test Specimen and Machine
(b)
")
8
Tension The engineering stress, or nominal stress, is defined as the ratio of applied load to original area of the specimen,

9
Tension The modulus of elasticity, or Young’s modulus, E, is defined as This linear relationship between stress and strain is known as Hooke’s law. Poisson’s ratio, v is the absolute value of the ratio of the lateral strain to longitudinal strain.

10
Tension Area under stress–strain curve up to the yield point, Y, of the material is known as the modulus of resilience, Area has the units of energy per unit volume. When specimen is unloaded from a stress level higher than Y, the curve follows a straight line downward and parallel to the original elastic slope.

11
Tension When a specimen is loaded beyond Ultimate Tensile Strength (UTS), it begins to neck and elongation between the gage marks is no longer uniform. As the test progresses, the engineering stress drops further and cause fracture, known as breaking or fracture stress.
, it begins to neck and elongation between the gage marks is no longer uniform. As the test progresses, the engineering stress drops further and cause fracture, known as breaking or fracture stress.")
13
Ductility 2 quantities commonly used to define ductility in a tension test are known as elongation and reduction of area. Elongation is defined as A second measure of ductility is known as a reduction of area, defined as

14
True stress and true strain
Similar to stress definition, true stress is defined as where A is the actual area supporting the load True strain is defined as

15
True stress and true strain
Since volume remains constant in the plastic region of the test, true strain can be expressed as From above, the largest strain is at the narrowest region of the neck.

16
True stress–true strain curves
A typical true stress–true strain curve is typically approximated by the equation Note that is always positive and that the slope decreases with increasing strain. Y Yield Stress Yf flow stress K strength coefficient

17
Construction of True Stress-True Strain Curve
Engineering log-log True

18
True stress–true strain curves
The area under the true stress–true strain curve is known as toughness, where εf is the true strain at fracture. Toughness is the energy per unit volume (specific energy) dissipated up to the point of fracture.
 dissipated up to the point of fracture.")
20
Instability in Tension
We have the following relationship: Because dP = 0 at the UTS where necking begins, However since , we have

21
Stress-Strain Curve

22
Example 2.1 Calculation of ultimate tensile strength
A material has a true stress–true strain curve given by Calculate the true ultimate tensile strength and the engineering UTS of this material. Solution Since the necking strain corresponds to the maximum load and the necking strain for this material is given as

23
Example 2.1 Solution We have as the true ultimate tensile strength,
The cross-sectional area at the onset of necking is obtained from Consequently,

24
Example 2.1 Solution (cont.)
The maximum load P is where δ is the true ultimate tensile strength. Hence, Since

25
Types of stress–strain curves
Curves with associated stress–strain equations have the following characteristics: Perfectly elastic Rigid and perfectly plastic Elastic and perfectly plastic Rid and linearly strain-hardening Elastic and linearly strain-hardening

26
Failures of Materials and Fractures in Tension

27
Bending

29
Hardness Tests Figure General characteristics of hardness-testing methods and formulas for calculating hardness. The quantity P is the load applied. Source: H. W. Hayden, et al., The Structure and Properties of Materials, Vol. III (John Wiley & Sons, 1965).
.")
30
Brinell Testing (c)
")
31
Hardness Conversion Chart
Figure Chart for converting various hardness scales. Note the limited range of most scales. Because of the many factors involved, these conversions are approximate.

38
Maximum-Shear-Stress Theory (Tresca Criterion)
Postulate: Yielding begins whenever the maximum shear stress in a part becomes equal to the maximum shear stress in a tension test specimen that begins to yield.

49
Distortion-Energy Theory
Postulate: Yielding will occur when the distortion energy per unit volume equals the distortion energy per unit volume in a uniaxial tension specimen stressed to its yield strength.

50
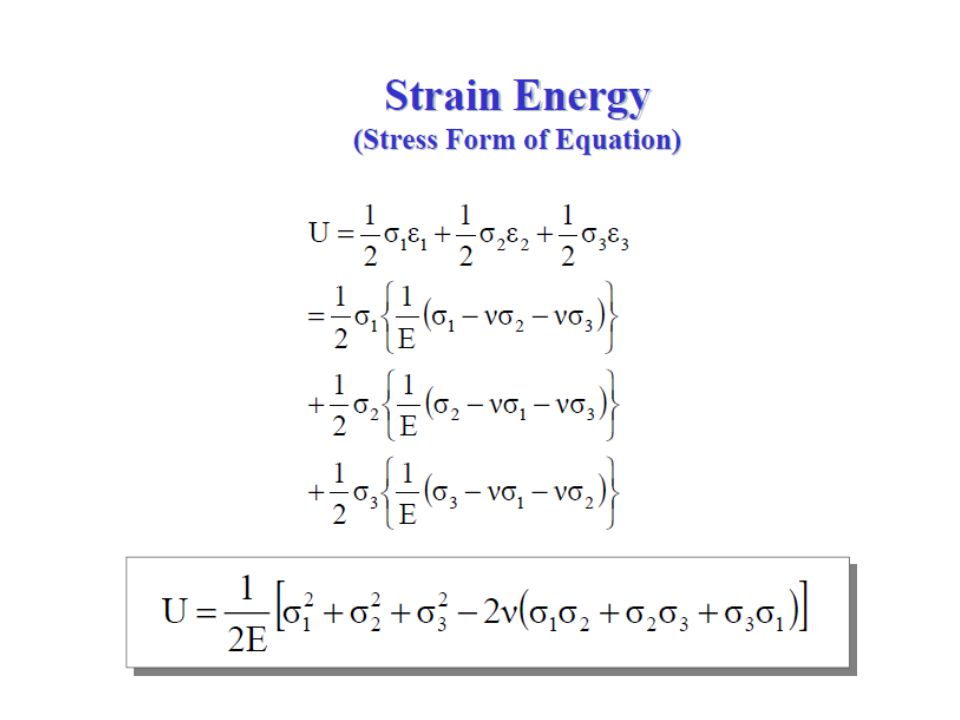
Strain Energy The strain energy per unit volume is given by the equation:

69
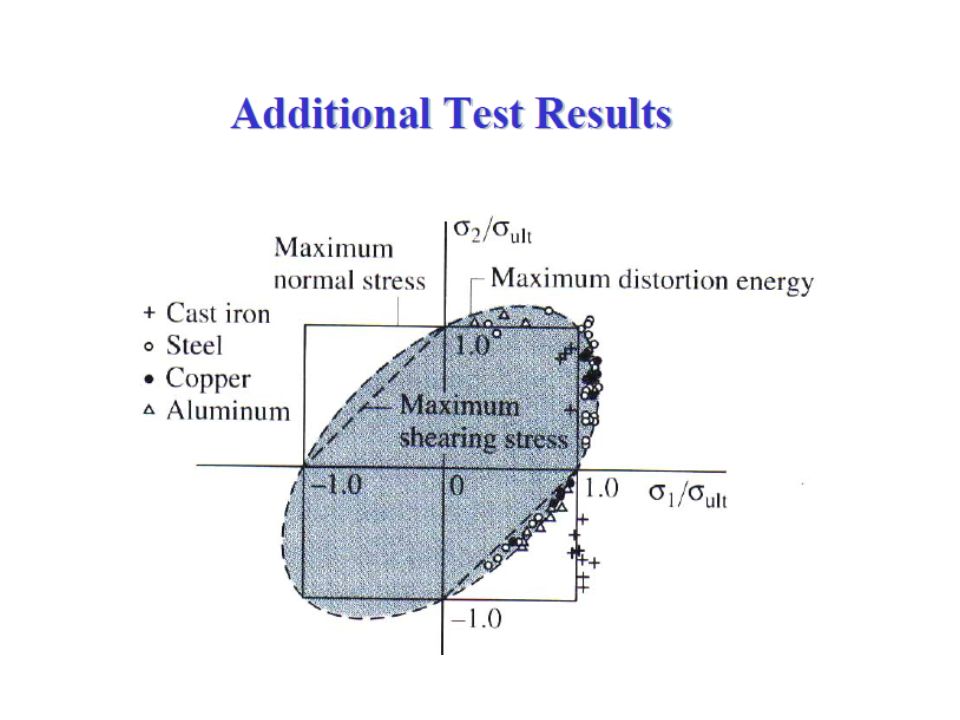
Conclusions Both the Distortion Energy Theory and the Maximum Shear Stress Theory provide reasonable estimates for the onset of yielding in the case of static loading of ductile, homogeneous, isotropic materials whose compressive and tensile strengths are approximately the same. Both the Distortion Energy Theory and the Maximum Shear Stress Theory predict that the onset of yield is independent of the hydrostatic stress. This agrees reasonably well with experimental data for moderate hydrostatic pressures.

70
Conclusions (Continued)
Both the Distortion Energy Theory and the Maximum Shear Stress Theory under predict the strength of brittle materials loaded in compression. Brittle materials often have much higher compressive strengths than tensile strengths. The Distortion Energy Theory is slightly more accurate than the Maximum Shear Stress Theory. The Distortion Energy Theory is the yield criteria most often used in the study of classical plasticity. Its continuous nature makes it more mathematically amenable.

Similar presentations


 Spring 2008 Dr. Konstantinos A. Sierros.>")


