Download presentation
Presentation is loading. Please wait.

1
Safety, Health, Environment & Risk Management Risk Finance Summary for Work Force & Property Exposures: FY08 Experience and FY09 Projections

3
UTHSC-H Employee Injury Reports and Workers’ Compensation Insurance Premium Trends, FY01 to 09 Note: insurance premium influenced predominantly by market conditions, employee census, employee payroll, and injury frequency and severity Oversight by SHERM $1,893,572 in total premium savings since FY03 188 fewer reported injury events compared to FY 03 105 fewer injuries requiring medical compared to FY 03 - $123,753 - $293,331 - $568,998 - $348,718 - $558,772

4
$227,000 in RAP reduction in FY09 as compared to peak of $436,100 in FY07

5
UTHSC-H Residents’ Injury Reports and Workers’ Compensation Insurance Premium Trends, FY03 to 10 Note: insurance premium influenced predominantly by market conditions, employee census, employee payroll, and injury frequency and severity Annual policy premium reduction from FY09 to FY10 of $6,000 Oversight by SHERM $80,000 in total premium savings since peak in FY06 Increase due predominantly to needlesticks. Targeted investigation and interventions underway

6
Total of $124,581 in dividend payments since SHERM oversight

7
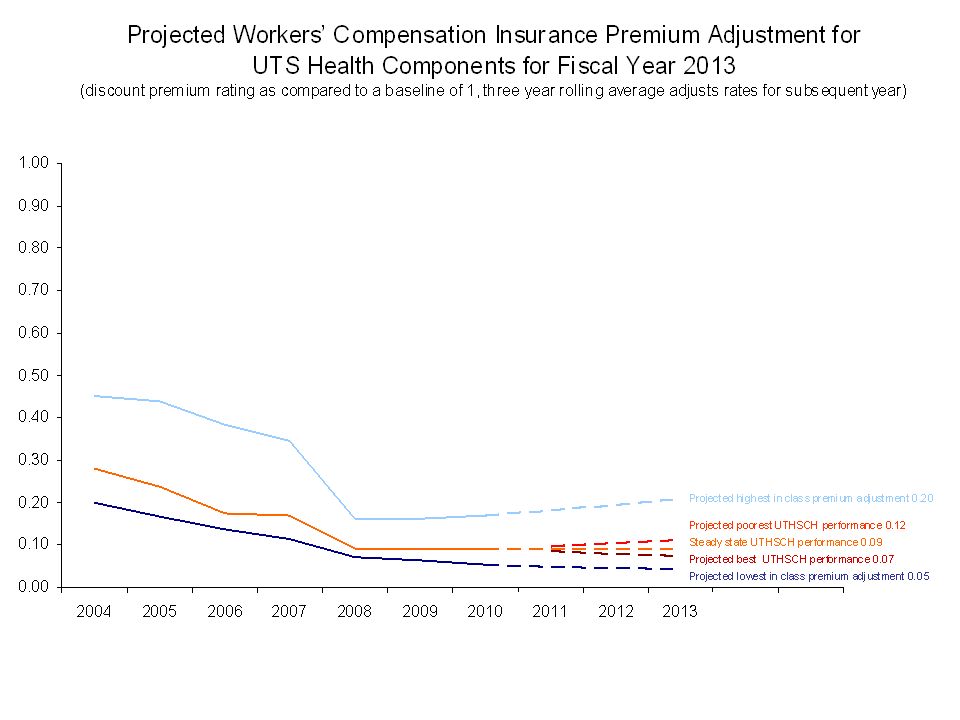
Workers’ Compensation Insurance Premium Adjustment for UTS Health Components Fiscal Years 2003 to 2009 (discount premium rating as compared to a baseline of 1, three year rolling average adjusts rates for subsequent year) UT HSC Tyler (0.09) UT Medical Branch Galveston (0.16) UT HSC San Antonio (0.12) UT Southwestern Dallas (0.17) UT HSC Houston (0.09) UT MD Anderson Cancer Center (0.05) Oversight by SHERM
 UT HSC Tyler (0.09) UT Medical Branch Galveston (0.16) UT HSC San Antonio (0.12) UT Southwestern Dallas (0.17) UT HSC Houston (0.09) UT MD Anderson Cancer Center (0.05) Oversight by SHERM")
9
Possible Range of Annual WCI Premium (Assuming no change in population, payroll, or other influencing factors) Estimated Premium2010201120122013 Upper bound similar to UTMB/UT Southwestern $363,000 (+$25,000) $388,000 (+$50,000) $413,000 (+$75,000) No Change$338,000 Lower bound similar to UTMDACC $313,000 (-$25,000) $288,000 (-$50,000) $263,00 (-$75,000)
 Estimated Premium Upper bound similar to UTMB/UT Southwestern $363,000 (+$25,000) $388,000 (+$50,000) $413,000 (+$75,000) No Change$338,000 Lower bound similar to UTMDACC $313,000 (-$25,000) $288,000 (-$50,000) $263,00 (-$75,000)")
10
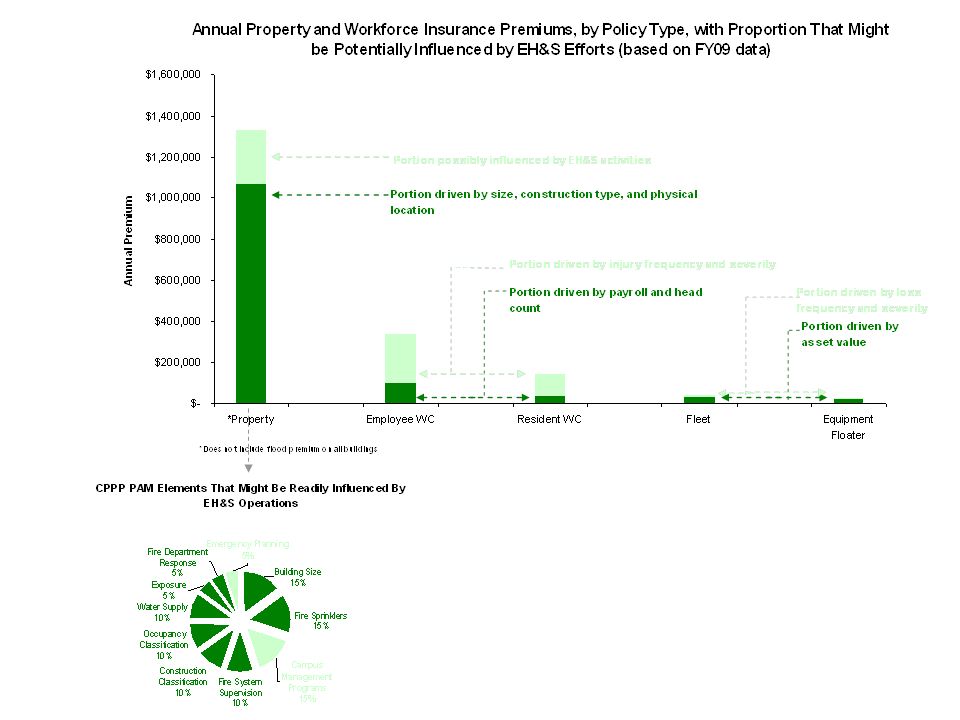
*MHH Increase in BI coverage from FY08-FY09, $49MM to $75MM FY09 Premium reduced by $290K, due to scheduled risk control measures (robust EMP, flood doors, training, etc.) and risk based loss estimates.
 and risk based loss estimates.")
11
- Losses Incurred but covered by UTS Comprehensive Property Protection Program The CPPP did not experience any losses from UTHSC-H - Losses incurred but covered by third party Metro Bus damage to the Ross Sterling Breezeway at MSB, $25,000 - Retained Losses Hurricane Dolly estimated loss to UTHSC-H Brownsville, RAHC $125,000 Eight of twelve retained losses were water related losses at an average cost of $1900 per loss *Not inclusive of any recorded capital assets inventory irregularities. For additional information contact UTHSC-H Capital Assets Management **Estimate based on replacement cost of damaged property

12
*Not inclusive of any recorded capital assets inventory irregularities. For additional information contact UTHSC-H Capital Assets Management **Estimate based on replacement cost of damaged property

13
Help Avoid the 3 Main Causes of Property Loss at UTHSC-H The three main causes of property loss at UTHSC-H in FY06 were water leaks, theft, and electrical power interruption. These three perils resulted in over $331,000 in direct loss and untold disruption to teaching, research, and service activities. The deductible for the UTS Comprehensive Property Protection Program is $250,000 per occurrence, in FY06 none of the losses exceeded the per occurrence deductible, however the sum of retained losses exceeded the deductible by $140,000. In special cases additional insurance can be purchased*. Summarized below are simple steps that can be taken to avoid such losses. Potential For LossSimple Prevention MeasuresFor more information and assistance Water Damage Water damage accounted for $221,000 of loss in FY06. Water can enter a lab or office from the same floor or from the floor above. Move equipment off of the floor and cover when not in use. Evaluate possible purchase of supplemental insurance for certain types of equipment* Contact Facilities Planning and Engineering for more information, (713)500-3498. Theft Theft accounted for $90,114 of loss in FY06, the majority of which were theft of laptops, PDAs and cell phones. Secure laptops, PDA’s, or cellular phones. Always backup data and keep it in a physically separate location. For more information about how to lock a PC or laptop: http://www.uth.tmc.edu/med http://www.uth.tmc.edu/med /msit/howdoi/physical_security.htm Evaluate possible purchase of supplemental insurance for certain types of equipment* Contact University of Texas Police Department for more information, (713)794-4357. Electrical Power Interruption Electrical power disruption accounted for $20,000 worth direct losses in FY06. However this is not reflective of the loss of priceless research specimens. Ensure that all critical equipment has backup power or has the ability to alert local personnel when power or temperature is disrupted. The production of duplicate or split samples is encouraged. Finally, some buildings are equipped with the necessary infrastructure to provide monitoring of temperature. Contact Facilities Planning and Engineering for more information, (713)500-3498. *Information about the purchase of additional insurance can be obtained by contacting Risk Management; 713-500-8100.
 Theft Theft accounted for $90,114 of loss in FY06, the majority of which were theft of laptops, PDAs and cell phones. Secure laptops, PDA’s, or cellular phones. Always backup data and keep it in a physically separate location. For more information about how to lock a PC or laptop: /msit/howdoi/physical_security.htm Evaluate possible purchase of supplemental insurance for certain types of equipment* Contact University of Texas Police Department for more information, (713) Electrical Power Interruption Electrical power disruption accounted for $20,000 worth direct losses in FY06. However this is not reflective of the loss of priceless research specimens. Ensure that all critical equipment has backup power or has the ability to alert local personnel when power or temperature is disrupted. The production of duplicate or split samples is encouraged. Finally, some buildings are equipped with the necessary infrastructure to provide monitoring of temperature. Contact Facilities Planning and Engineering for more information, (713) *Information about the purchase of additional insurance can be obtained by contacting Risk Management;")
14
Enhanced Risk Assessment & Control Services Services Provided –Institutional exposures objectively ranked by value exposed to loss; revenue, expenses, and total assets –Targeted analysis on specific risk exposures and the development of risk control techniques to mitigate loss, provide assistance with installation, and implementation –Assess and analyze existing and potential risk financing options –Assist in development of customized Business Continuity Plan for unit –Inventory and document assets to facilitate recovery in event of loss Units Served to Date –Gulf Coast Hemophilia, Neurobiology and Anatomy, Microbiology and Molecular Genetics, and The Biotechnology Center

15
Other Policies Equipment Floater Rate (per $100 of insured value)Total Insured ValueAnnual Premium FY03$0.42*$4,600,788$19,390 FY04$0.49*$3,083,582$15,204 FY05$0.42*$4,017,404$16,870 FY06$0.46*$3,581,709$16,476 FY07$0.54*$3,983,875$23,414 FY08$0.54*$3,487,380$19,782 Fleet Insurance LiabilityComp/CollLossesPremium FY03$189$334$96,052$43,322 FY04$169$349$2,610$37,508 FY05$234$434$20,074$40,443 FY06$230$412$905$38,202 FY07$230$418$846$42,234 FY08$252$459$6,518$37,181 *Not Inclusive of current SHERM administrative processing fee of $0.46 SHERM
Total Insured ValueAnnual Premium FY03$0.42*$4,600,788$19,390 FY04$0.49*$3,083,582$15,204 FY05$0.42*$4,017,404$16,870 FY06$0.46*$3,581,709$16,476 FY07$0.54*$3,983,875$23,414 FY08$0.54*$3,487,380$19,782 Fleet Insurance LiabilityComp/CollLossesPremium FY03$189$334$96,052$43,322 FY04$169$349$2,610$37,508 FY05$234$434$20,074$40,443 FY06$230$412$905$38,202 FY07$230$418$846$42,234 FY08$252$459$6,518$37,181 *Not Inclusive of current SHERM administrative processing fee of $0.46 SHERM")
16
Other Policies Fine Arts Limit based PremiumLossesAnnual Premium FY05$500,000$0$2,689 FY06$500,000$0$200 FY07$500,000$0$215 FY08$500,000$0$906 Endowment Policy (Property and Liability) Total Insured ValueLosesAnnual Premium FY05*$5,462$0$3,177 FY06$0 FY07**$53,254$0$2,746 FY08**$53,254$0$7,129 *For Liability only at 1246 FM Hwy 102, Eagle Lake, TX -$5,735 - $2,558 for property deletion 8/31/2004 **For Liability only at 1133 John Freeman Boulevard - The property was added 06/01/2006 premium pro-rata
 Total Insured ValueLosesAnnual Premium FY05*$5,462$0$3,177 FY06$0 FY07**$53,254$0$2,746 FY08**$53,254$0$7,129 *For Liability only at 1246 FM Hwy 102, Eagle Lake, TX -$5,735 - $2,558 for property deletion 8/31/2004 **For Liability only at 1133 John Freeman Boulevard - The property was added 06/01/2006 premium pro-rata")
17
Cost of Risk Transfer *NFIP places policies on individual locations, such as UT Apts *Paid out of the Named Windstorm & 100-Yr Flood PolicyFY08 PaidFY09 Estimated or PaidChangeNet Change Employee WC $ 324,477 $ 335,7103% $ 11,233 Resident WC $ 167,761 $ 161,927-3% $ (5,834) Fine Arts - Multiple Locations $ 1,000 0% $ - Mobile Diagnostic Equipment $ 5,301 $ 5,5665% $ 265 Auto $ 37,181 $ 38,1783% $ 997 CPPP Fire & AOP Premium $ 229,612 $ 256,23412% $ 26,622 CPPP Named Windstorm & 100-Yr Flood* $ 474,502 $ 268,375-43% $ (206,127) Commercial Named Windstorm & 100-Yr Flood $ 398,277 $ 810,064103% $ 411,787 Equipment Policy $ 19,782 $ 26,95036% $ 7,168 Policy Premium Total $ 1,657,893 $ 1,904,00415% $ 246,111
 Fine Arts - Multiple Locations $ 1,000 0% $ - Mobile Diagnostic Equipment $ 5,301 $ 5,5665% $ 265 Auto $ 37,181 $ 38,1783% $ 997 CPPP Fire & AOP Premium $ 229,612 $ 256,23412% $ 26,622 CPPP Named Windstorm & 100-Yr Flood* $ 474,502 $ 268,375-43% $ (206,127) Commercial Named Windstorm & 100-Yr Flood $ 398,277 $ 810,064103% $ 411,787 Equipment Policy $ 19,782 $ 26,95036% $ 7,168 Policy Premium Total $ 1,657,893 $ 1,904,00415% $ 246,111")
18
Discussion Items 1.Despite best management efforts, market conditions and UT System loss experience have increased wind and flood premiums by 56% 2.Due to these changes, RMI suggests consideration of removal of all NFIP and TWIA coverage that is not required by the CPPP and resides outside the 500yr floodplain. Projected savings of $75,000 3.Current status of retained loss pool? 4.Despite continual reductions in WCI losses, rebate amounts continue to diminish. The Employee Health program will likely require an additional $70,000/yr to meet UTHSC-H’s employee health obligations to make up for the shortfall.

19
Appendix A

20
*MHH Increase in BI coverage from FY08-FY09, $49MM to $75MM FY09 Premium reduced by $290K, due to scheduled risk control measures (robust EMP, flood doors, training, etc.) and risk based loss estimates.
 and risk based loss estimates.")
21
- Losses Incurred but covered by UTS Comprehensive Property Protection Program The CPPP did not experience any losses from UTHSC-H - Losses incurred but covered by third party Metro Bus damage to the Ross Sterling Breezeway at MSB, $25,000 - Retained Losses Hurricane Dolly estimated loss to UTHSC-H Brownsville, RAHC $125,000 Eight of twelve retained losses were water related losses at an average cost of $1900 per loss *Not inclusive of any recorded capital assets inventory irregularities. For additional information contact UTHSC-H Capital Assets Management **Estimate based on replacement cost of damaged property

22
*Not inclusive of any recorded capital assets inventory irregularities. For additional information contact UTHSC-H Capital Assets Management **Estimate based on replacement cost of damaged property

Similar presentations