Download presentation
Presentation is loading. Please wait.

2
National Weather Service To Give Hurricanes Full Names May4, 2006 | the ONION: Issue 4209SILVER SPRING, MD—Issue 4209 The National Weather Service announced Friday that, in response to the increasing number of hurricanes, it is revising its naming system. "The hundreds of hurricanes we expect in the North Atlantic in 2006 will receive both proper and surnames," Max Mayfield of the weather service said. "In fact, tropical storms Alberto Fergus, Beverly Stenwick-Brown, and Chris Stubbs Jr. have already received names under the new system." After all possible first and last names are exhausted, storms will be given titles, beginning with Hurricane Assistant Accounts Manager Alexander Epps, CPA. NOAA Press Release: Immediate Distribution 2006 hurricane season

3
Surface Temperature Variability Volcano Ozone Sulfate Solar There is no known natural forcing mechanism that can explain the surface temperature increases since 1960 (Meehl et al 2004, 2006) Notice the warm 1940-50 period in the “natural cycle”
 Notice the warm period in the natural cycle")
4
Changes in hurricane statistics in the North Atlantic Ocean

5
Strong apparent relationship between Atlantic storms and sea-surface temperature (1910-2005)
")
6
Hurricane season SST in tropical ocean basins North Atlantic Ocean (ATL) East Pacific Ocean (EPAC) West Pacific Ocean (WPAC) North Indian Ocean (NIO) Southwest Pacific (SPAC) South Indian Ocean (SIO) All tropical ocean basins show monotonic increase of SST
 East Pacific Ocean (EPAC) West Pacific Ocean (WPAC) North Indian Ocean (NIO) Southwest Pacific (SPAC) South Indian Ocean (SIO) All tropical ocean basins show monotonic increase of SST")
7
Global number of storms and storm days No statistically significant change in number of storms.

8
Number of hurricanes in tropical basins Largest decreases occur in WPAC and southern hemisphere. North Atlantic shows monotonic increase

9
Change in storm intensity globally Between 1970-1985 and 1985-2005, the number of category 4 and 5 storms has doubled

10
Change in intensity occurs in severe (3+4+5) as well as in categories (4+5)
 as well as in categories (4+5)")
11
Increase in intensity is global

12
Time that a hurricane remains as a category 3, 4 or 5 has increases by 1/2 day across last three decades

13
Gulledge et al., Science, submitted N. Atlantic tropical storm season length has increased 4.8 days/decade for past 100 years

14
What do these global changes in hurricane intensity mean for the Gulf and Southeastern states of the US? oHigh probability that the last decade characteristics will become the base of a new hurricane distribution o1995-2005 will not the “100-year” decade oGulf storms such as Dennis, Emily, Katrina, Rita and Wilma may become more the norm

15
Katrina/Rita/Dennis/ Emily/Rita/Wilma 2005 Dennis, Emily, Katrina, Rita, Wilma 5 category 4-5 hurricanes in the Gulf

16
Why should wind speed be important? Damage by winds goes as: Cat 3 does 170% more damage than Cat 2 Cat 4 does 270% more damage than Cat 2 Cat 5 does 400% more damage than Cat 2

17
http://weatherunderground.com/tropical 2005 season Five Gulf Category 4-5 storms

18
Consequences of the formation of more storms in the 10-20N region (Cape Verde storms)
")
19
During the last decade, an increasing number of storms have developed from atmospheric waves from Africa Increasing sea-surface temperature and long-term changes in their patterns in the equatorial North Atlantic mean that more hurricanes form in the 8-20N latitude band

20
These are important for the Gulf and the SE US for the following reasons Equatorial 90% 92% 81% 55% 36% 42% (Data 1945-2004) o>85% of all Major hurricanes develop from African waves!!! oHurricanes developing close to in the equatorial Atlantic impact the Caribbean, Central America, the Gulf and the Gulf states o> 50% of all major hurricanes develop south of 20N

21
Where and how much the SST increases explains shift in characteristics SST variations explain 69% of the variance in equatorial (easterly wave) developments. 9-y Mean

22
Consequences of more Gulf of Mexico storms

23
Impacts of more Gulf storms Demographic changes towards south and the coast have increased vulnerability of larger percentage of population Energy industry increasingly vulnerable Coastal bathymetry conducive to large storm surge More storm landfalling and moving into southern states

24
EXAMPLES OF KATRINA’S WATER DAMAGE

25
Hurricane Wilma Visible Infrared

26
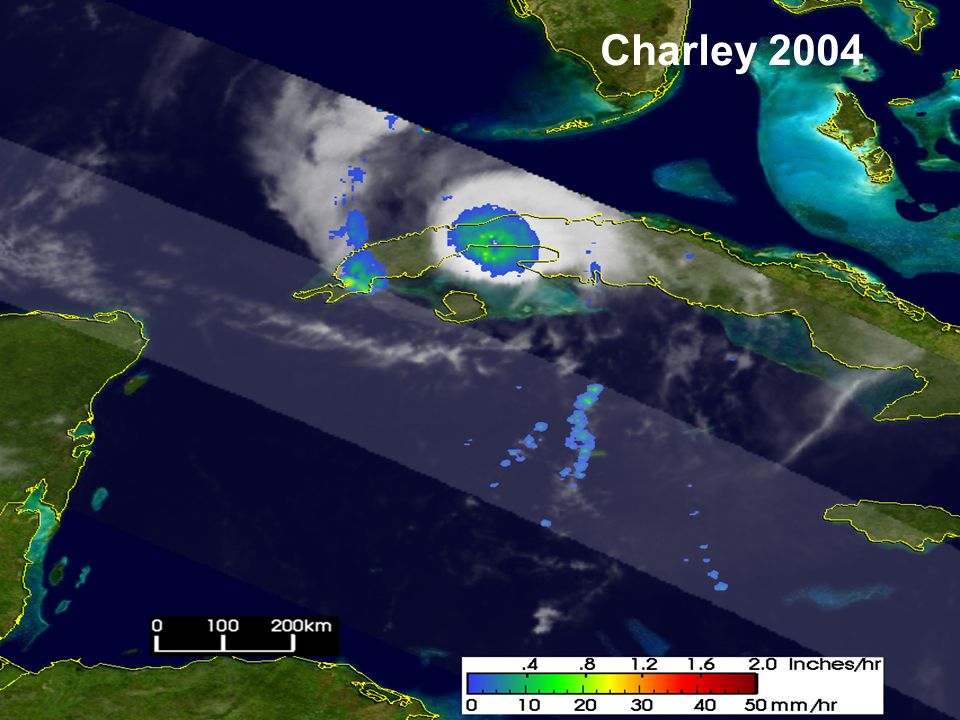
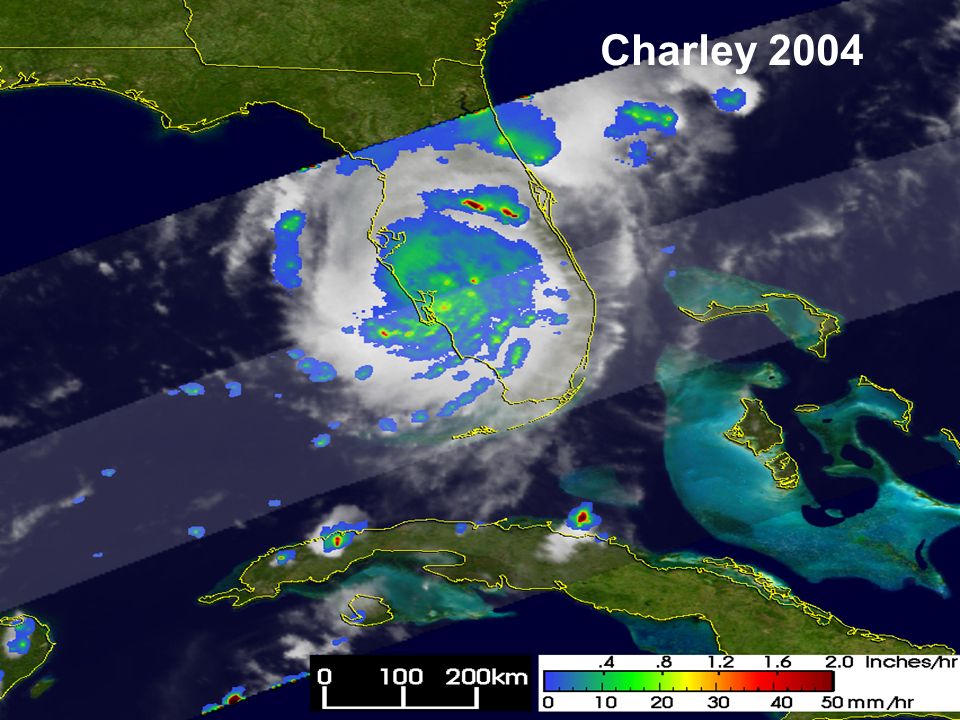
Charley 2004

29
Nov. 17, 1970: Tropical cyclone crossed coast of Bangladesh. High tide and 4-5 m (12-15 ft) storm surge at high tide drowned 300,000 people, 280,000 cattle and destroyed 90,000 boats But not all tropical cyclones are benign
 storm surge at high tide drowned 300,000 people, 280,000 cattle and destroyed 90,000 boats But not all tropical cyclones are benign.")
30
Consequences of more Gulf of Mexico land-falling hurricanes for the SE, mid-west and Eastern USA

31
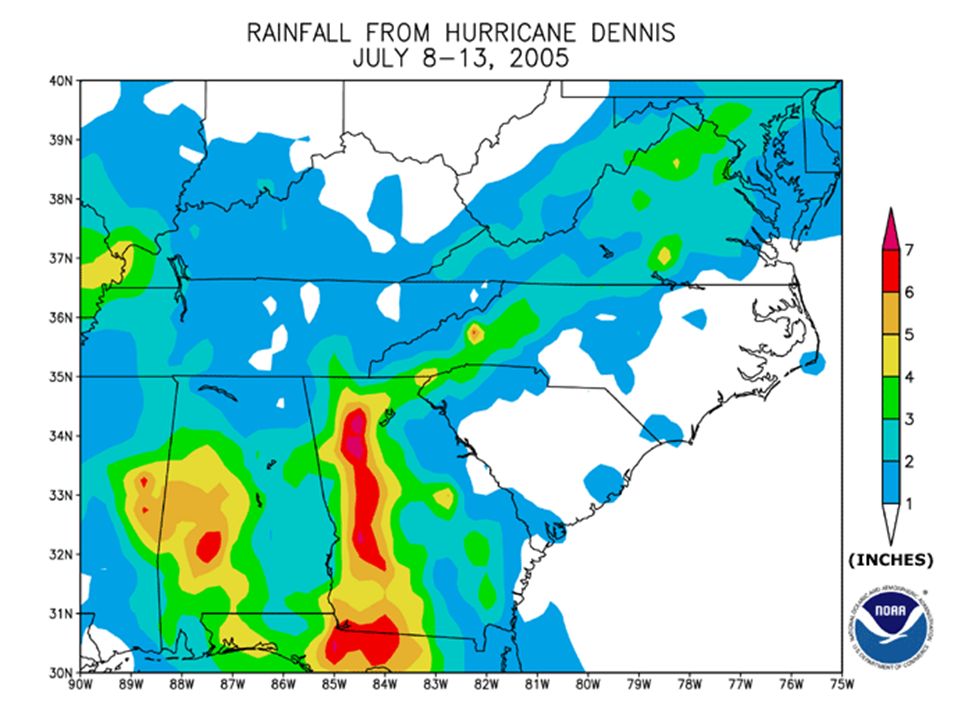
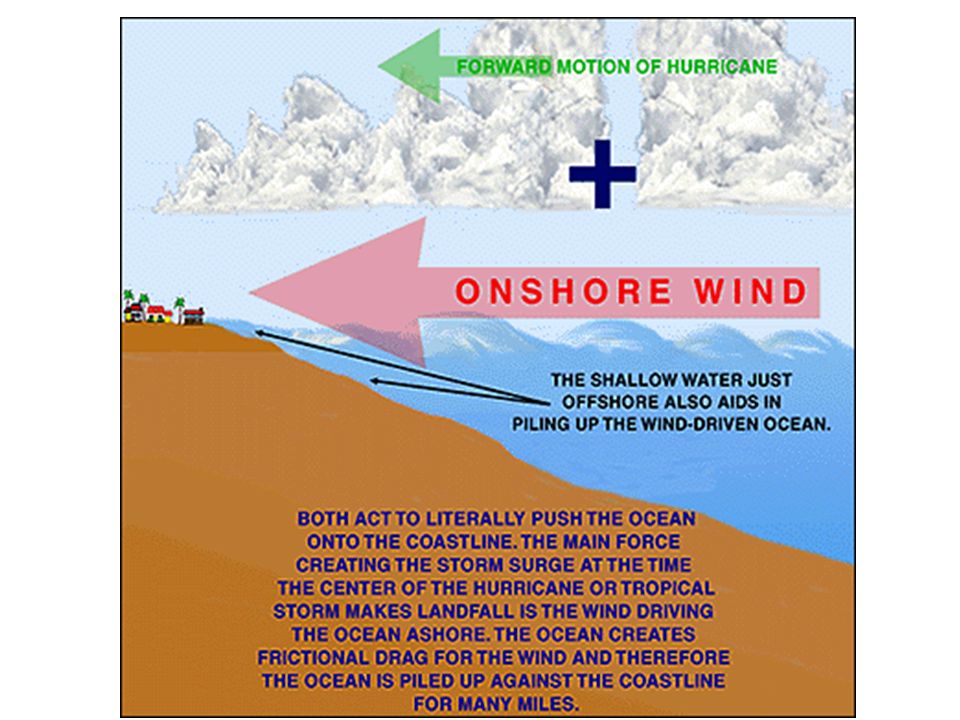
Impacts of Gulf land-falling hurricanes oGulf coastal storm surges oWind damage in coastal regions oLarge-scale and intensity precipitation over land often causing severe flooding oConsequences for agriculture (crop damage, water pollution from overflow of feed lot lagoons) oTornadoes that may be remote to landfalling location
 oTornadoes that may be remote to landfalling location")
33
Six-Hour Accumulated Rainfall: Hurricane Katrina

34
Katrina

39
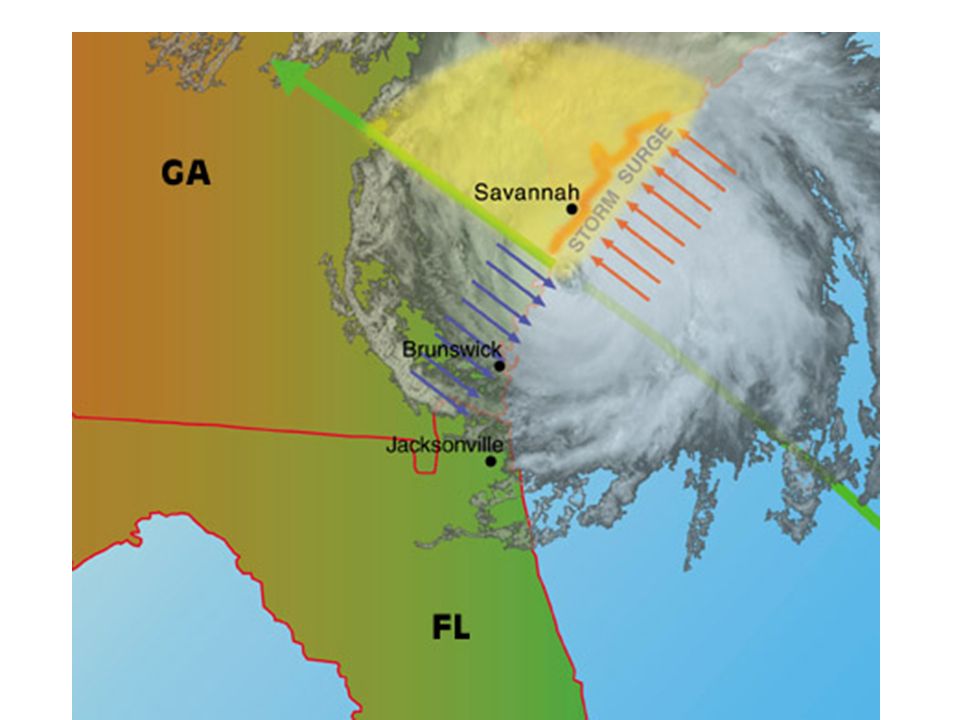
The possibility and consequences of a major land-falling hurricane in coastal Georgia

41
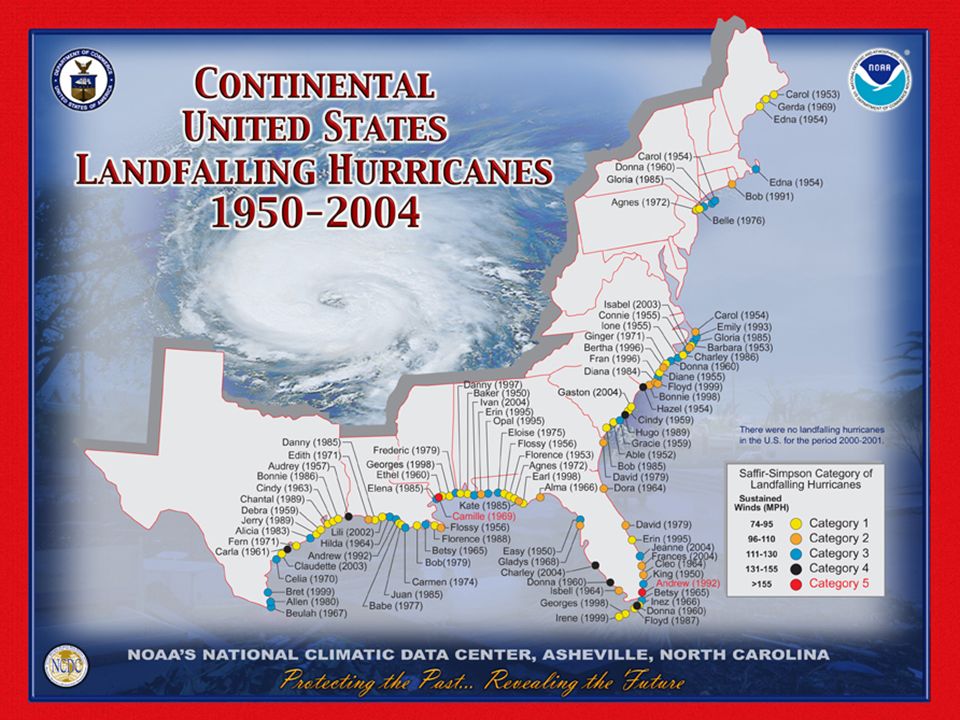
Legend: Cat 5 - Cat 4 - Cat 3 - Cat 2 - Cat 1 - 1995-2005 U.S. Landfalling Hurricanes The Gulf Estimated Impacted Area for Cats 4 through 1 44% of U.S. landfalling hurricanes hit FL

42
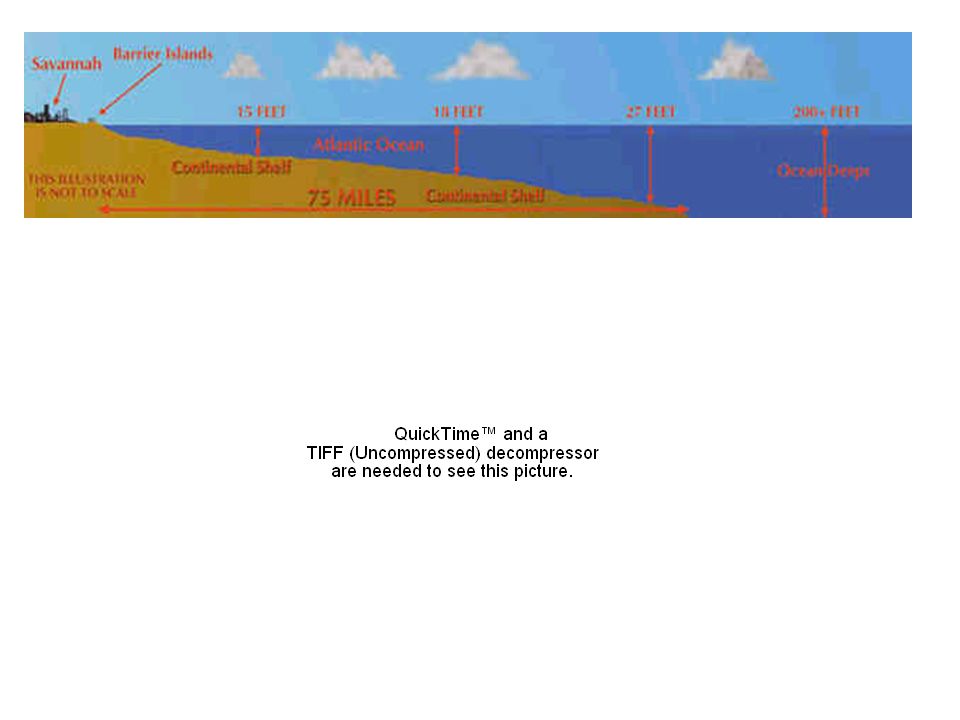
Land-falling hurricanes on Georgia coast extremely rare oNo hurricane for over 100 years but a series of devastating landfalling hurricanes created storm surges drowning 1000’s of residents. oHurricanes were not of high category but extensive shoaling continental shelf allows extensive storm surges. oGeorgia coast is considered by FEMA as especially vulnerable to storm surges

45
100 mph 120 mph 140 mph 160 mph

47
100 mph

48
140 mph

50
What can be done? oPlan for at least a continuation of the active period of 1995-2005 oIn risk analysis, take into account high probability of considerable greater activity in coming decades oConsider long-term spending (including relocation) to mitigate problems in vulnerable areas. Better to spend $10B/year and lose no lives than $200B every year or so with many deaths cleaning up after future Katrinas. oBetter seasonal forecasts and learn how to use them (there is hope!)
 to mitigate problems in vulnerable areas. Better to spend $10B/year and lose no lives than $200B every year or so with many deaths cleaning up after future Katrinas. oBetter seasonal forecasts and learn how to use them (there is hope!).")
51
Tropical Storms Forecasts starting on 1 st June 2005: JASON ECMWF Met Office Meteo-France Obs 1 st May-mid Nov. W-PacE-Pac ATL Multimodel Courtesy Frederic Vitart (ECMWF)
.")
52
Tropical Storms Seasonal Forecasts: Meteo-France Forecast starting 1 st April: MJJAS Forecast starting 1st May: JJASO Forecast starting 1 st June: JASON Forecast starting 1 st July: ASOND Courtesy Frederic Vitart (ECMWF)
")
Similar presentations


 fuel (latent.>")


 Physical Oceanography>")


 for hurricanes: Required reading:>")
