Download presentation
Presentation is loading. Please wait.

1
10/5/2015 An Introduction to Chemistry Chapter 1 Eugene Passer Chemistry Department Bronx Community College © John Wiley and Sons, Inc Eugene Passer Chemistry Department Bronx Community College © John Wiley and Sons, Inc Version 1.0

2
10/5/2015 1.1 What is a Science? The observation, identification, description, experimental investigation, and theoretical explanation of natural phenomena. “the study in which humans attempt to organize and explain, in a sytematic and logical manner, knowledge about themselves and their surroundings”

3
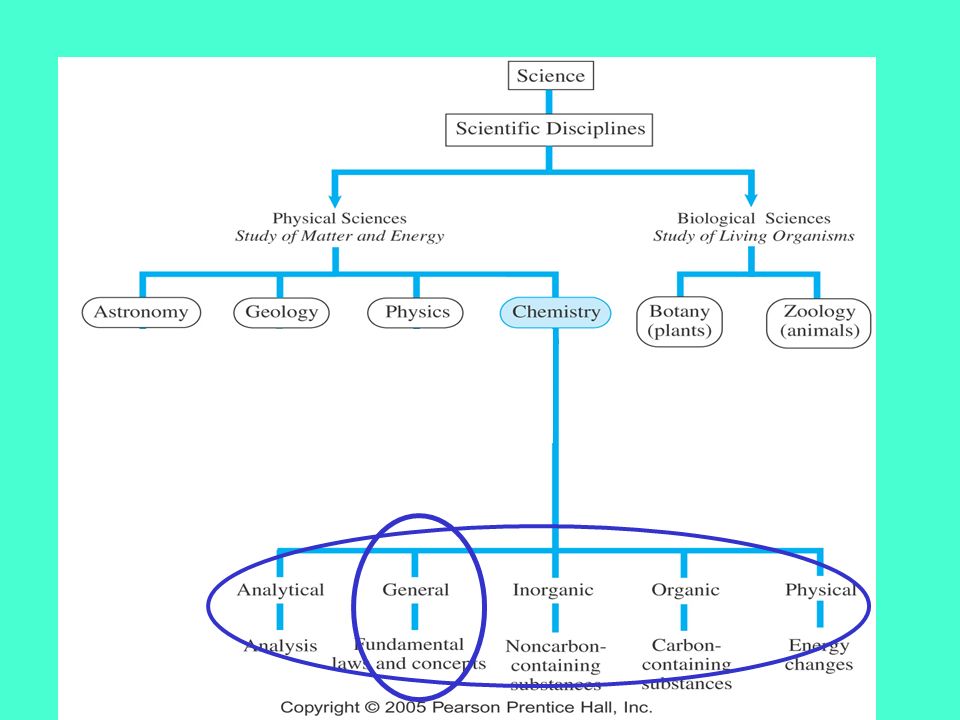
10/5/2015 PHYSICAL SCIENCES: Astronomy, Geology, Physics, Chemistry SCIENTIFIC DISCIPLINES BIOLOGICAL SCIENCES: Botany, Zoology TODAY: Biochemistry, Molecular Biology

4
10/5/2015

5
Chemistry is sometimes describes as the study of the structure and behavior of matter. 10/5/2015

7
CHEMISTRY DISCIPLINES Analytical – what and how much (analysis) General – fundamental laws and concepts Inorganic – substances that are not organic Organic – carbon and hydrogen containing compounds Physical – energy changes in chemical reactions, theoretical
 General – fundamental laws and concepts Inorganic – substances that are not organic Organic – carbon and hydrogen containing compounds Physical – energy changes in chemical reactions, theoretical")
8
10/5/2015 1.3 How chemists discover things - The Scientic Method The observation, identification, description, experimental investigation, and theoretical explanation of natural phenomena.

9
10/5/2015 Natural Phenomena experimentally investigate theoretically explain observe describeidentify research

10
10/5/2015 SCIENTIFIC METHOD 1.Observation 2.Literature research 3.Hypothesis 4.Experiment 5.Theory

11
10/5/2015Definitions

12
Hypothesis: A tentative explanation of certain facts (observation) that can be tested through experimentation.
 that can be tested through experimentation.")
13
10/5/2015 Experiment: is conducting a controlled test to collect data to support or negate a hypothesis. Data from experiments are called FACTS Experiments must be conducted under carefully controlled conditions so that they can be reproduced over and over. This separates science from pseudo science.

14
10/5/2015 Law: Statement of natural phenomena to which no exceptions are known under the given conditions. A law is not an explanation. Theory: a statement which explains what is observed that is supported with experimental evidence and is used to make predictions. (Mathematical models are frequently derived from a theory. At any time, a new experiment may be done that invalidates the theory.)
.")
15
10/5/2015 (tentative explanation) (explanation based on fact)
 (explanation based on fact)")
16
Measurements are the data obtained from an experiment CH. 1.4 –MEASUREMENT and UNITS

17
What’s wrong with this measurement? 55.5 MEASUREMENT (cont) Always include a numerical value and a unit 55.5 km makes more sense!
 Always include a numerical value and a unit 55.5 km makes more sense!.")
18
Measurements used in chemistry length, volume, mass, time, temperature, pressure, concentration

19
The Metric System of Units Used in scientific work, even in the US

20
Table 1.1 SI Units (standard metric units) QuantityBase UnitAbbrev. Length Mass Time Temp meter kilogram second kelvin m kg s K Amountmolemol Symbol l m t T n

21
SI Unit Prefixes mega-M10 6 deci-d10 -1 centi-c10 -2 milli-m10 -3 PrefixSymbolFactor micro- 10 -6 nano-n10 -9 pico-p10 -12 kilo-k10 3 BASE UNIT---10 0 giga-G10 9 GREATER THAN ONE LESS THAN ONE

22
LENGTH (m) Meter is both the standard and base metric unit Other common length measurement: 1 mm 1 cm 1 km 10 -2 m 10 -3 m 10 3 m 0.001 m (1000 mm / 1 m) 0.01 m (100 cm / 1 m) 1000 m (0.001 km / 1 m)
 Meter is both the standard and base metric unit Other common length measurement: 1 mm 1 cm 1 km m m 10 3 m m (1000 mm / 1 m) 0.01 m (100 cm / 1 m) 1000 m (0.001 km / 1 m)")
23
Combination of base units. (e.g., length length length) Standard unit is m 3 Base unit is L Other common units: cm 3, dL, mL, μL Other facts: 1 cm 3 = 1 mL 1 dm 3 = 1 L Volume 1000 L = 1 m 3
 Standard unit is m 3 Base unit is L Other common units: cm 3, dL, mL, μL Other facts: 1 cm 3 = 1 mL 1 dm 3 = 1 L Volume 1000 L = 1 m 3.")
24
Mass Mass is the total quantity of matter in something. Determined by weight what is weight???? Standard unit is kg Base unit is g Other common units μg, mg, kg

25
Temperature A measure of the intensity of heat. It does not depend on the size of the system.

26
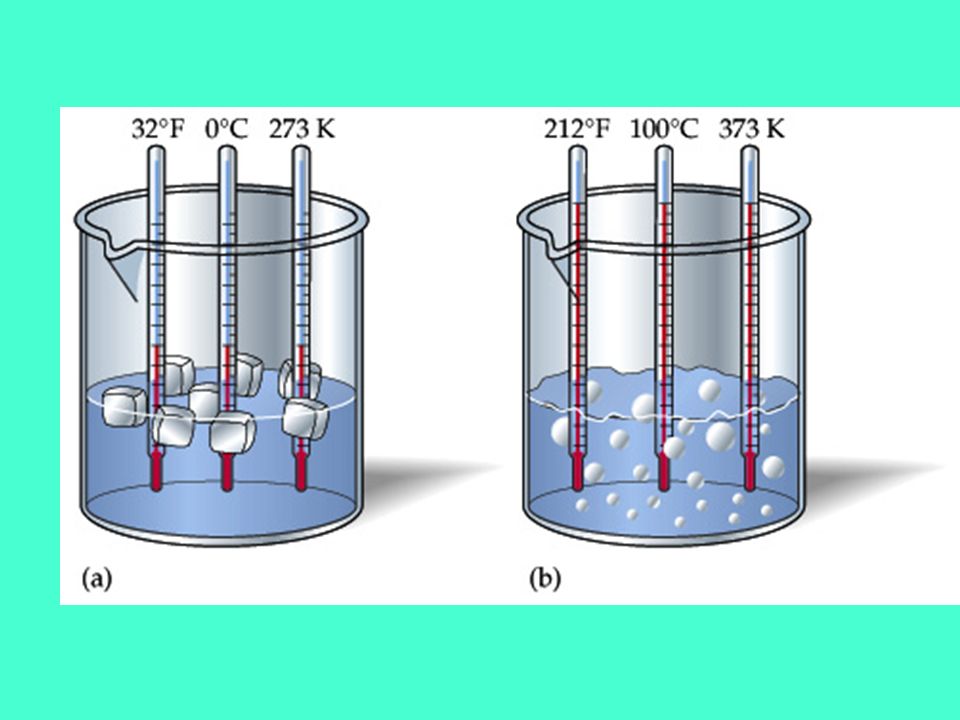
Temperature Measurement There are three temperature scales: Kelvin, Celsius and Fahrenheit. The SI unit of temperature is the Kelvin. In the laboratory, temperature is commonly measured with a thermometer in Celsius.

27
Degree Symbols degrees Celsius = o C Kelvin (absolute) = K degrees Fahrenheit = o F
 = K degrees Fahrenheit = o F")
29
Exact and inexact numbers Exact numbers are “counting” numbers 7 days per week 12 equals one dozen “there are 32 students in this room” Measurements are always inexact 1.5 Reporting Values from Measurements

30
Inexact Numbers (measurements) contain ERROR Systematic – controllable (faulty equipment) Random - uncontrollable (noise)
 contain ERROR Systematic – controllable (faulty equipment) Random - uncontrollable (noise)")
31
Accuracy - how close a measurement is to the accepted value Precision - how close a series of measurements are to each other ACCURATE = CORRECT PRECISE = CONSISTENT Accuracy and Precision

32
Choose an answer 1.Accurate/precise 2.Accurate/imprecise 3.Inaccurate/precise 4.Inaccurate/imprecise A) B) C) D)
 B) C) D)")
33
Choose an answer 1.Accurate/precise 2.Accurate/imprecise 3.Inaccurate/precise 4.Inaccurate/imprecise A) 55.3 kg 55.4 kg 55.5 kg B) 54.9 kg 54.8 kg 55.0 kg C) 54.7 kg 55.6 kg 55.9 kg D) 54.2 kg 54.7 kg 55.5 kg AVG = 55.4 kg AVG = 54.9 kg AVG = 54.8 kg
 55.3 kg 55.4 kg 55.5 kg B) 54.9 kg 54.8 kg 55.0 kg C) 54.7 kg 55.6 kg 55.9 kg D) 54.2 kg 54.7 kg 55.5 kg AVG = 55.4 kg AVG = 54.9 kg AVG = 54.8 kg")
34
Uncertainty in measurement Every measurement has error associated with it. The more precise the measurement the less error. Error in a measurement is indicated by the number of significant figures in the number

35
Which measurement has less error? Which measurement is more precise? Which measurement has more significant figures? 29.2 o C or 29.25 o C

37
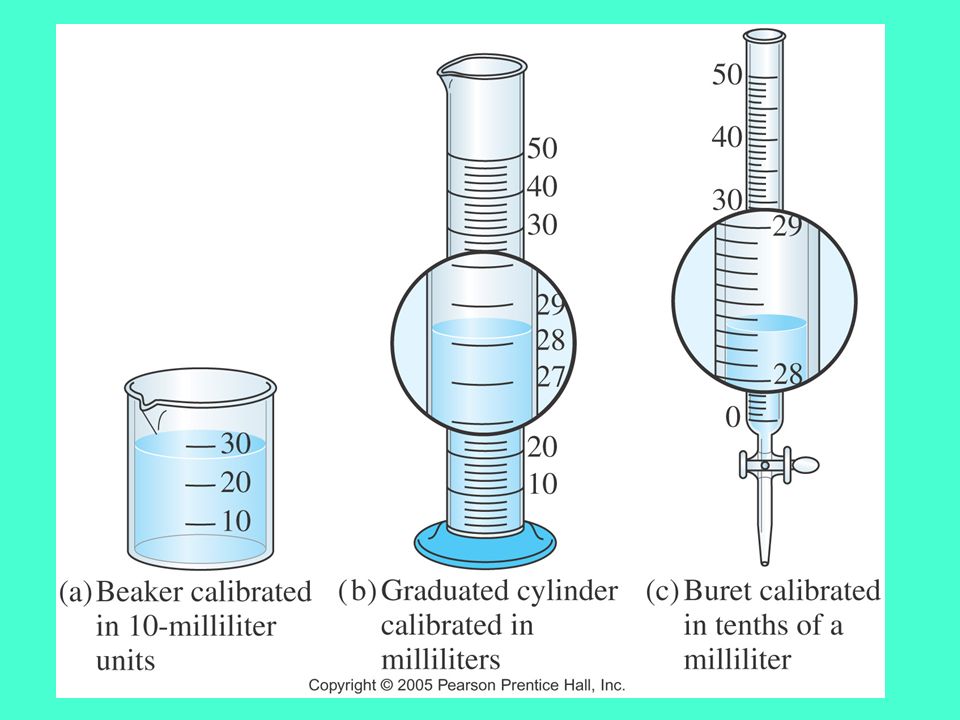
Significant Figures Indicate precision of a measurement. Sig. figs. do not apply to exact numbers Recording Sig Figs Sig figs in a measurement include the known digits plus a final estimated digit

38
?.?? cm

39
Uncertainty in measurements Unless otherwise stated the last digit. Determined from the smallest division. Stated on the device. E.g.: ± 1, ± 0.2, etc. The last digit in a digital display. Determined from the data set. 10/5/2015

40
Counting Sig Figs Count all numbers EXCEPT: Leading zeros -- 0.0025 Trailing zeros without a decimal point -- 2,500

41
4. 0.080 3. 5,280 2. 402 1. 23.50 Counting Sig Fig Examples 4 sig figs 3 sig figs 2 sig figs

Similar presentations


>")


 will not be explicitly covered but used throughout this entire class…>")


 Prediction Experiment Theory Modified As needed.>")
: A theory can be proven correct or incorrec.>")