Download presentation
Presentation is loading. Please wait.

1
Tracing The Signal Ron Maddalena July 2009

3
Typical Components Amplifiers Mixers Attenuators Power Detectors Synthesizers Splitters Couplers Filters Switches Multipliers

4
Types of Filters Edges are smoother than illustrated

5
Types of Mixers f f IF f LO n and m are positive or negative integers, usually 1 or -1 Up Conversion : f IF > f Down Conversion : f IF < f Lower Side Band : f LO > f - Sense of frequency flips Upper Side Band : f LO < f See pp. 94-95, Fig 5 on p. 96 f IF = n*f LO + m*f

6
Example Switches

7
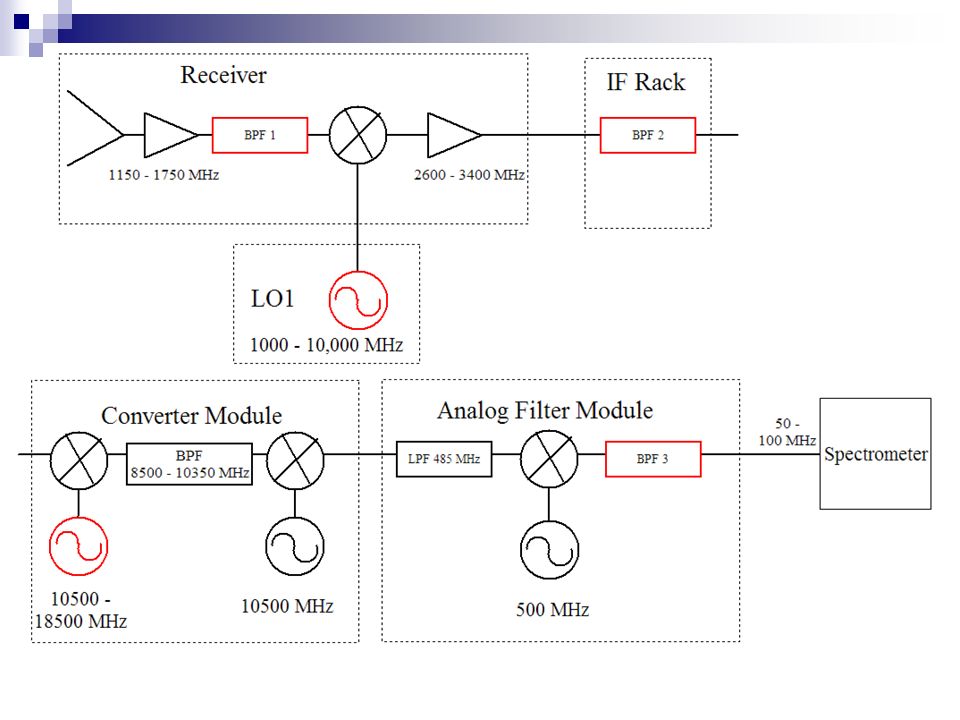
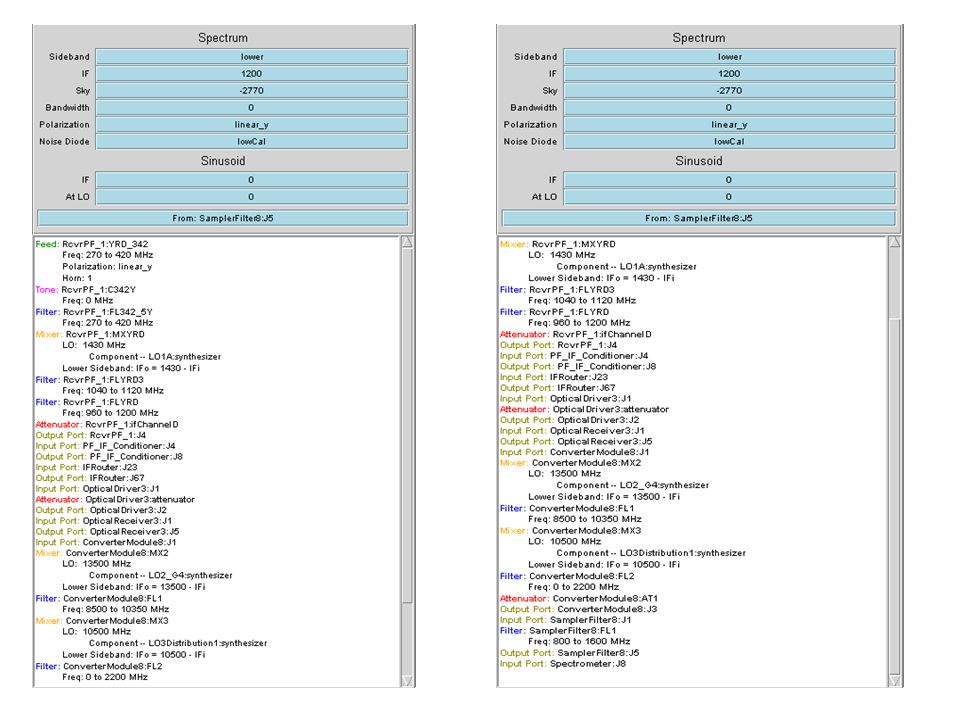
Quiz 1: Determine values for red components

8
Goal : Observe 1420 MHz with the 50 MHz mode of the Spectrometer Parameters: BPF1 can be: 1100–1800, 1600-1750, 1300-1450, or 1100-1450 MHz All mixers are Lower Side Band. Hint: first two mixers up convert, the last two down convert. BPF2 can be : 2990-3010, 2960-3040, 2840-3160, 2360-3640, 5960-6040, 5840-6160, or 5360-6640 MHz BPF3 can be : 50-100 or 25-37.5 MHz See block diagram for other parameters Hint: Work from the receiver down the chain until you get stuck, then from Spectrometer up Record values for LO1 and LO2; settings for BPF1, 2, and 3; and values for all Intermediate Frequencies.

10
Typical Receiver

11
Multi-beam Receiver

12
Receiver Room

14
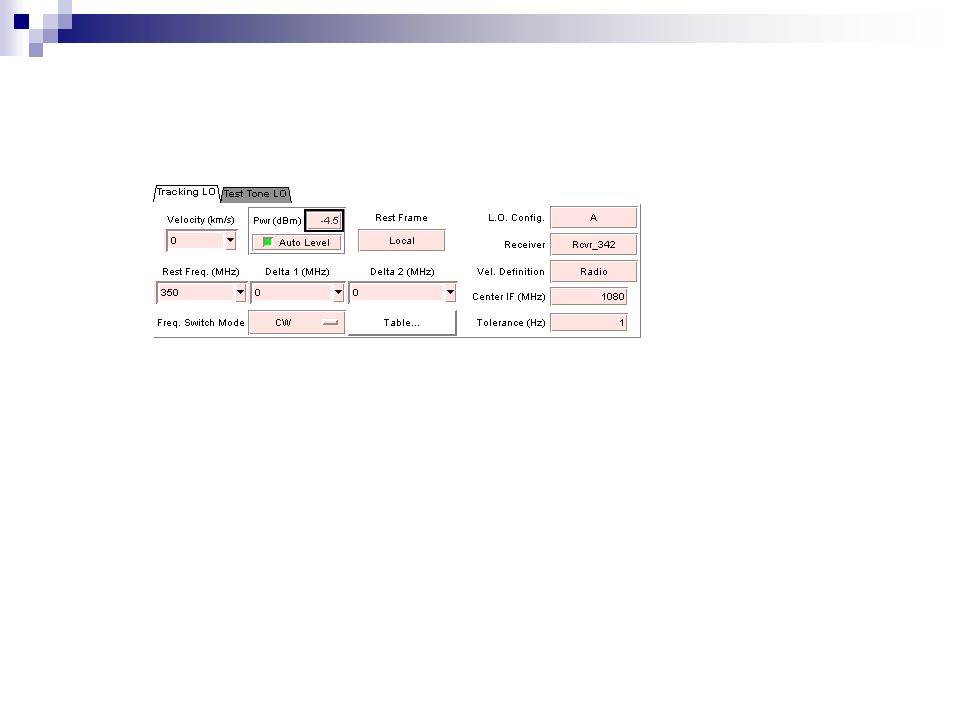
Local Oscillator and Switching Matrix

16
Typical Receiver

19
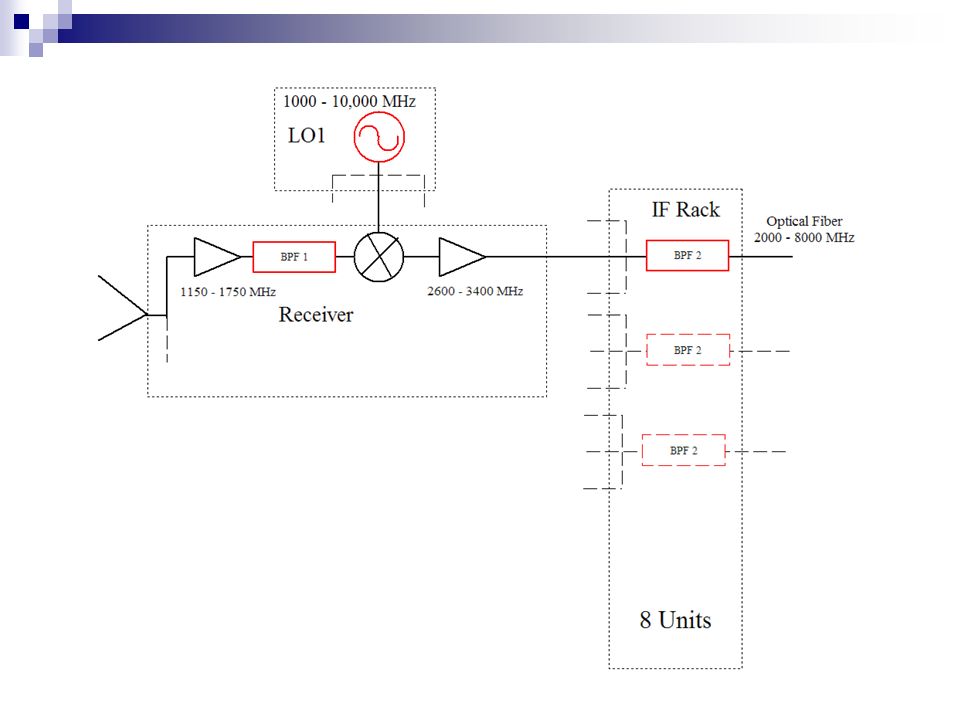
IF Rack – Input switching Matrix, IF Filters, Power Balancing Attenuators, and Drivers for 8 Optical Fibers

20
Power Balancing/Leveling and Non-Linearity

23
Converter and Analog Filter Racks, Spectrometer

25
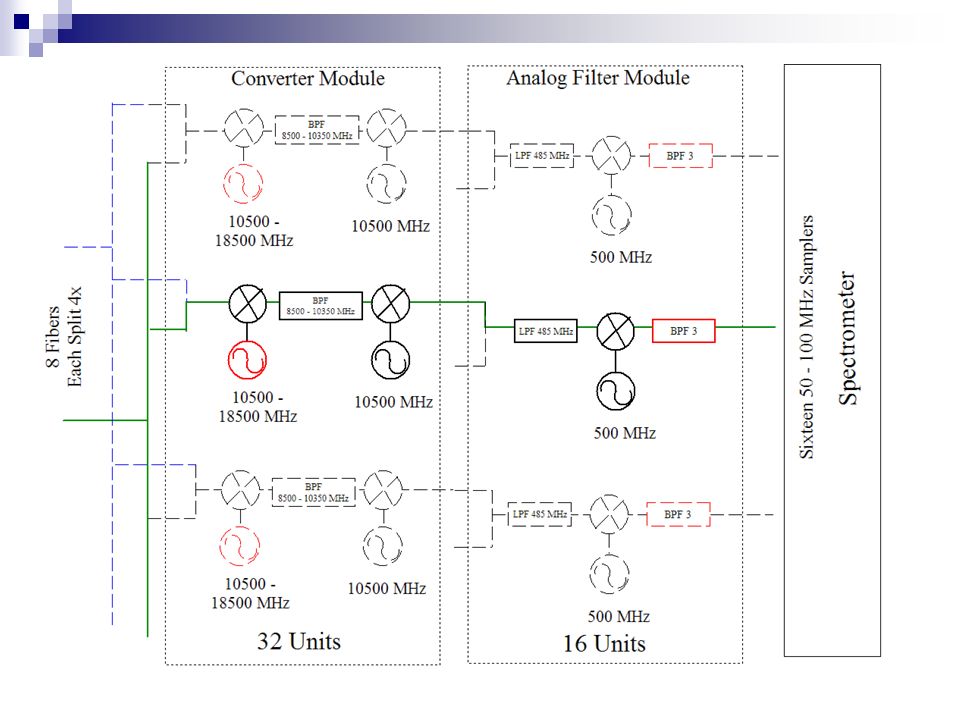
Converter Rack – Receivers for Optical Fibers, LO2 and LO3, Power Balancing Attenuators, Output Switches to Backends and AFR

27
Analog Filter Rack For 12.5 and 50 MHz Slow-Speed Spectrometer Samplers : LO4 and Filters For 200 and 800 MHz High-Speed Spectrometer Samplers : Input Switches and Filters.

32
GBT – Astrid program does all the hard work for you….. configLine = """ receiver = "Rcvr1_2" beam = “B1" obstype = "Spectroscopy" backend = "Spectrometer" nwin = 1 restfreq = 1420.4058 deltafreq = 0 bandwidth = 12.5 swmode = "tp" swtype = "none" swper = 1.0 swfreq = 0.0, 0.0 tint = 30 vlow = 0 vhigh = 0 vframe = "lsrk" vdef = "Radio" noisecal = "lo" pol = "Linear" nchan = "low" spect.levels = 3 """

33
Quiz 2: Determine values for red components

34
Goal : Observe simultaneously 1420 MHz and 1665 MHz with the 50 MHz mode of the Spectrometer Parameters: BPF1 can be: 1100–1800, 1600-1750, 1300-1450, or 1100-1450 MHz All mixers are LSB. Hint: first two mixers up convert, the last two down convert. BPF2 can be : 2990-3010, 2960-3040, 2840-3160, 2360-3640, 5960-6040, 5840-6160, or 5360-6640 MHz BPF3 can be : 50-100 or 25-37.5 MHz See block diagram for other parameters Hint: Work from the receiver down the chain until you get stuck, then from Spectrometer up. Start with the results from Quiz 1. Record values for LO1 and both LO2’s; settings for BPF1, 2, and 3; and values for all Intermediate Frequencies.

Similar presentations


 by the antenna before feeding to the television receiver.>")


 AMPLITUDE MODULATION>")
, March, 2011 2007144078 Min, Kyungsik.>")


+mEc/2Cos(Wc-Wm)t-mEc/2Cos(Wc+Wm)t Carrier LSB USB.>")

 Local Oscillator Mixer IF Strip (Amps, Filters) Channel SelectivityService Band Detector (Demodulation)>")