Download presentation
Presentation is loading. Please wait.

1
RTI in Middle Schools: Going from Concept to Reality Matthew Burns, Ph.D.

3
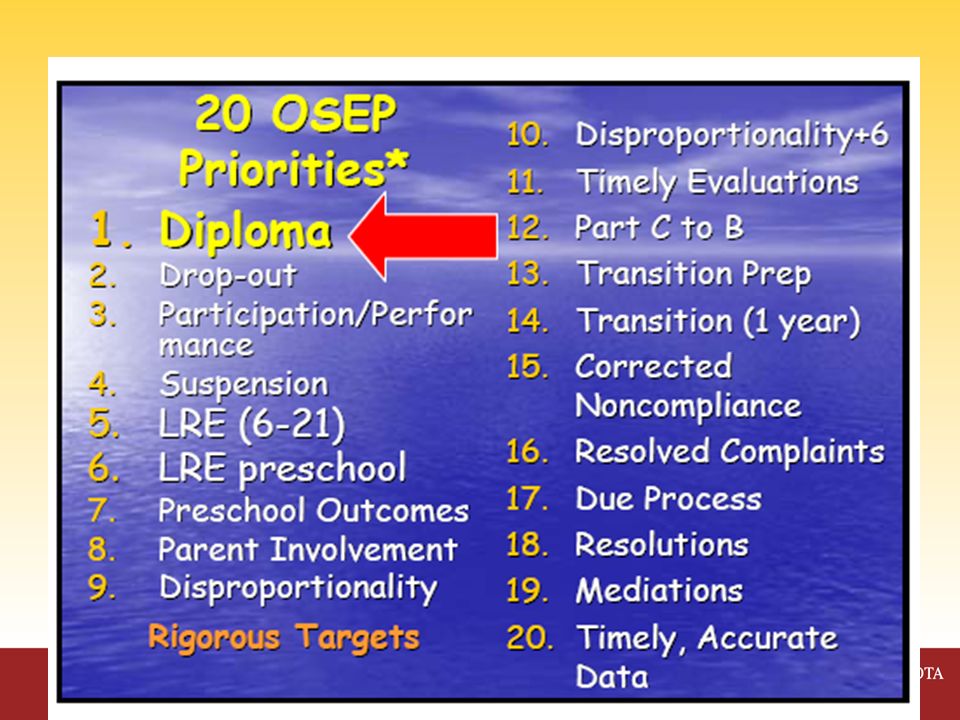
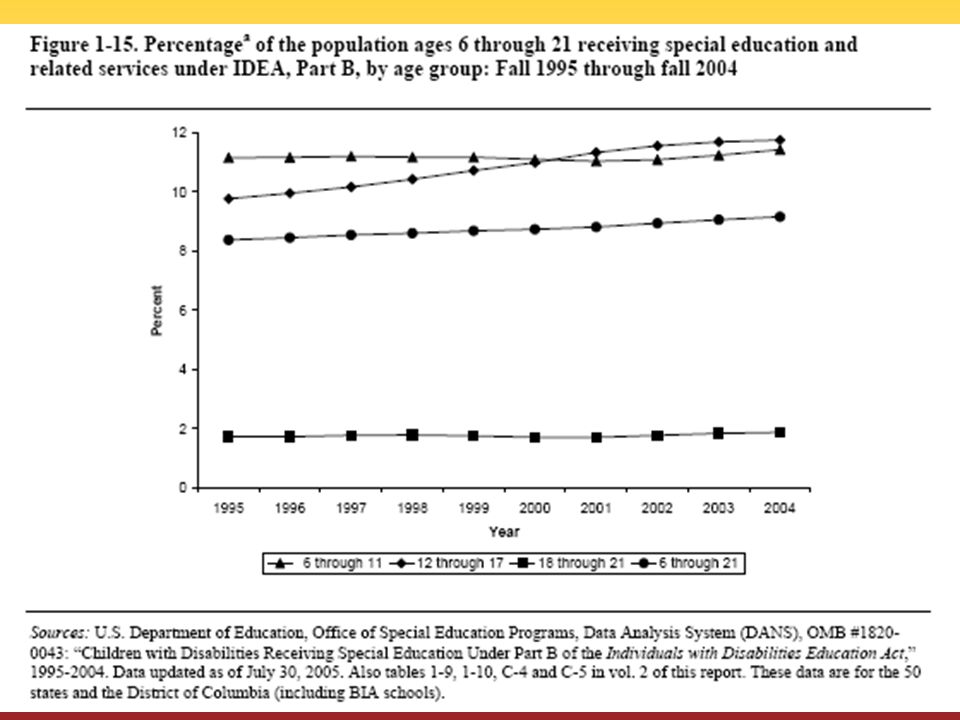
Prevalence of Disabilities Disability1991 2001% Change LD2,247,004 2,887,217 28.5 MR 553,262 612,978 10.8 EBD 400,211 473,663 18.4 Deaf-Blind 1,427 1,320 -7.5 OHI 58,749 291,850 396.8 Autism 5,415 78,749 1,354.3

5
Multi-Tiered Academic Interventions (Burns, Jimerson, & Deno, 2007) Tier I: Universal screening and progress monitoring with quality core curriculum: All students, Tier II: Standardized interventions with small groups in general education: 15% to 20% of students at any time Tier III: Individualized interventions with in-depth problem analysis in general education : 5% of students at any time
 Tier I: Universal screening and progress monitoring with quality core curriculum: All students, Tier II: Standardized interventions with small groups in general education: 15% to 20% of students at any time Tier III: Individualized interventions with in-depth problem analysis in general education : 5% of students at any time")
6
RTI and Problem-Solving Measurement Precision Measurement Frequency Problem-Analysis TIER I TIER I I TIER III

7
Problem Solving Tier I – Identify discrepancy between expectation and performance for class or individual Tier II – Identify discrepancy for individual. Identify category of problem. Assign small group solution. Tier III – Identify discrepancy for individual. Identify causal variable. Implement individual intervention.

8
TIER I Classwide problem?

9
Grade Levels Number of Empirical Journal Articles Including Grade Level in Their Sample

10
Other grades Second through sixth grade –Reading fluency at grade level Seventh grade + –Maze –NWEA

13
You’ve Got the Data – Now What? Data Management Team –Usually school psychologist and one other –Know data! PLC or Discipline Teams Get data to teachers within 2 to 3 days Lead data meeting

14
student names 15-Sep A 11 B 16 C 12 D 29 E 23 F 34 G 14 H 13 I J 30 K 31 L 13 M 10 N 37 O 31 P 9 Q 33 R 20 S 40 T 19 Median 19.5

17
http://www.fcrr.org/assessmentMiddleHighSchool.htm

18
student names 15-Sep A 11 B 16 C 12 D 29 E 23 F 34 G 14 H 13 I J 30 K 31 L 13 M 10 N 37 O 31 P 9 Q 33 R 20 S 40 T 19 Median 19.5

19
Literacy in MS/HS http://www.fcrr.org/Interventions/pdf/Principals%20Guide-Secondary.pdf

20
Adolescent Literacy Create a literacy plan Adopt coherent and rigorous standards Assess student needs Deliver interventions to struggling readers Help teachers learn literacy instruction Make a long term commitment Biancarosa, G. & Snow, C.E. (2004). Reading Next—A Vision for Action and Research in Middle and High School Literacy: A Report to Carnegie Corporation of New York. Washington, DC: Alliance for Excellent Education.
. Reading Next—A Vision for Action and Research in Middle and High School Literacy: A Report to Carnegie Corporation of New York. Washington, DC: Alliance for Excellent Education..")
21
Classwide Intervention http://kc.vanderbilt.edu/pals/

22
student names 15-Sep 29-Sep A 1112 B 1633 C 1228 D 2945 E 2346 F 3452 G 1427 H 13 I 26 J 3059 K 3159 L 1329 M 1012 N 3750 O 3156 P 913 Q 3354 R 2046 S 4062 T 1947 Median 19.5 45.5

23
TIER II INTERVENTIONS Category of the Deficit

24
Assess 4 NRP Areas Phonemic Awareness –NA at secondary setting Phonics –Word attack - WJ Fluency –Oral reading fluency or Test of Silent Contextual Reading Fluency Vocabulary/Comprehension –MAP

25
Category of Problem MN HS 9-12 with approximately 1600 students 69.2% pass reading 9 th -10 th grade 28% low on MAP (~225) 45% Low on TOSCRF (~100) –64% low on phonics (~65) –36% acceptable phonics (~36)
 45% Low on TOSCRF (~100) –64% low on phonics (~65) –36% acceptable phonics (~36)")
26
Florida Center for Reading Research www.fcrr.org Click – For Teachers Click – Interventions for Struggling Readers Click – Supplemental and Intervention Programs http://www.fcrr.org/FCRRReports/CReportsCS.aspx?rep=supp

27
Interventions Phonics – Rewards Fluency – Read Naturally Vocabulary/Comprehension –Read On! –Reading Advantage –Thinking Readers

28
RAND Reading Research Group (2002) Described a critical state of reading comprehension skills among middle- and high-school students. Described six effective strategies –Monitoring comprehension was #1 –Others were using graphic organizers, generating and answering questions, examining story structure and summarizing

29
Tier II Effective – at least moderate ES Costs – Low as possible, cost/ES, cost effective (comes with a lot), dedicated teacher time Delivery –Group/individual (two to six considering efficiency) –Total students (20%) –Who - teacher supervision with some peer and or adult tutoring –Pull out – in addition to, some pull out component, 3 to 5 X/week, approximately 30 minutes (kinder – 20min tops). No less than 8 weeks. Grades of kids – earlier better, certainly K-2. Measure – fluency measure of reading at least monthly Materials –Ease – much easier if compiled, but not prerequisite –Availability – standardized (manual)
.")
30
Secondary Setting 50 minute courses –Smaller courses (up to 12 or so) –Content area (e.g., Social Studies) 90 minute blocks –Within course –30 minutes of strategies
 –Content area (e.g., Social Studies) 90 minute blocks –Within course –30 minutes of strategies")
31
Tier II in HS Social Studies RTI Class Social Studies Class Social Studies Curriculum Social Studies Teacher Interventionist

32
Tier II in HS – 1 st 30 Minutes Social Studies RTI Class Social Studies Teacher Interventionist

33
Tier II in HS – 2 nd 30 minutes Social Studies RTI Class Social Studies Teacher Interventionist

34
Outcomes RIT POINTS

35
Outcomes 9 th Graders – Windram et al., 2007

36
Service Delivery Courses –Content course –Remedial course –30 minute homeroom –Study hall Comprehension strategies and fluency Co-taught –Content specialist and interventionist AM and AR

37
Evaluate the Intervention

38
Growth Standards for Maze Modest =.15 Realistic =.25 Ambitious =.35

39
Tier III

40
Reading Comprehension Occurs when the reader develops mental representations of the text and uses them to interpret the text (Pressley & Afflerbach, 1995). Critically low among middle- and high- school students (RAND Reading Research Group, 2002).
..")
41
Comprehension is affected by 1 & 2) Background knowledge and vocabulary 3) Correct inferences about reading 4) Word reading skill 5) Strategy use (Cromley & Azevedo, 2007)
 Background knowledge and vocabulary 3) Correct inferences about reading 4) Word reading skill 5) Strategy use (Cromley & Azevedo, 2007)")
42
Previewing (Graves et al., 1983) 1.Provide each student the text 2.Provide a synopsis 3.Ask questions about the topic 4.Describe major story elements: setting, characters, point of view (narration), and description of the plot. 5.Present the names and descriptions of main characters About 15 minutes

43
Preteach Keyword (Burns et al., 2004) Keywords - “central to understanding the meaning of the reading passage” (Rousseau & Yung Tam, 1991, p. 201) Preteach with Incremental Rehearsal (Tucker, 1989) About 7 minutes
 Preteach with Incremental Rehearsal (Tucker, 1989) About 7 minutes.")
44
Incremental Rehearsal Developed by Dr. James Tucker (1989) Folding in technique Rehearses one new item at a time Uses instructional level and high repetition
 Folding in technique Rehearses one new item at a time Uses instructional level and high repetition.")
45
Mean Number of Word Retained

46
Correlation between retention and receptive vocabulary 1 day 2 days 3 days 7 days 30 days TA.32.27.32.23.08 DS.22.25.17.16.20 IR -.16 -.13.06.04-.07 These results are “astounding” (Daly & McCurdy, 2002; p. 457).
..")
47
Results MeanSDMeanSDMeanSDStatistic Number of Comprehension Questions Correct2.951.614.422.394.891.94F = 8.52* Questions correct for each Minute of Instructional TimeNA.32.17.83.46t = 5.02* BaselinePreviewKeyword p <.025

50
SC MS 87% of kids below the 10th %ile made MAP reading gains –77% made gains of more than 5 RIT points –The average gain was 12.1 RIT points! 80% of the students in the 11-25th %ile made MAP reading gains. –53% made gains of 5 RIT points or more –Average gain was 8.32 RIT points! 6th grade +4.5, 7th grade +5.9, 8th grade +6.5

52
burns258@umn.edu

Similar presentations


>")


 Lindenhurst Schools>")

>")

