Download presentation
Presentation is loading. Please wait.

1
Is the Corpus Christi AreaReaching Its Economic Goal

2
Presented by William H. Fruth POLICOM Corporation 2740 SW Martin Downs Blvd. Palm City, FL 34990 772-781-5559 fruth@policom.com www.policom.com

3
How a local economy works.

4
Primary or contributory industries import money.

5
Consumptive or dependent industries use and consume this money.

6
Growth in size depends upon the amount of money flowing into the area.

7
Growth in quality depends upon the wage level of the primary industries.

8
Characteristics of Primary Employers Sell goods and services outside the economy, importing money to the area. Geographic location influences operating costs, thus profitability. Since their market is not local, they do not have to be in an area to sell their product. They will move when it is unprofitable to be located in an area.

9
Metropolitan Statistical Areas 363 Micropolitan Statistical Areas 577

10
Economic Strength The long term tendency for an area to consistently grow in both size and quality.

11
TEN STRONGEST METROPOLITAN AREAS 1 Charlotte-Gastonia-Concord, NC-SC 2 Washington-Arlington-Alexandria, DC-VA-MD 3 San Diego-Carlsbad-San, CA 4 Nashville-Davidson-Murfreesboro-Franklin, TN 5 Sacramento-Arden-Arcade-Roseville, CA 6 Phoenix-Mesa-Scottsdale, AZ 7 Dallas-Fort Worth-Arlington, TX 8 Houston-Sugar Land-Baytown, TX 9 Salt Lake City, UT 10 Las Vegas-Paradise, NV

12
TEN WEAKEST METROPOLITAN AREAS 363 Danville, IL 362 Pine Bluff, AR 361 Danville, VA 360 Pascagoula, MS 359 Abilene, TX 358 Pocatello, ID 357 Weirton-Steubenville, WV-OH 356 Gadsden, AL 355 Muncie, IN 354 Springfield, OH

13
TEN STRONGEST MICROPOLITAN AREAS 1 Hilton Head Island-Beaufort, SC 2 Edwards, CO 3 Concord, NH 4 Lebanon, NH-VT 5 Kahului-Wailuku, HI 6 Durango, CO 7 Truckee-Grass Valley, CA 8 Bozeman, MT 9 East Stroudsburg, PA 10 Gillette, WY

14
TEN WEAKEST MICROPOLITAN AREAS 577 Tallulah, LA 576 Lamesa, TX 575 Indianola, MS 574 Jennings, LA 573 Silver City, NM 572 Pecos, TX 571 Levelland, TX 570, AR 569 Bogalusa, LA 568 Pittsburg, KS

15
TexasMetropolitanAreas

16
Texas Metropolitan Areas Metropolitan Areas2008 Dallas-Fort Worth-Arlington, TX (MSA)7 Houston-Sugar Land-Baytown, TX (MSA)8 Austin-Round Rock, TX (MSA)39 San Antonio, TX (MSA)43 Killeen-Temple-Fort Hood, TX (MSA)125 Corpus Christi, TX (MSA)153 McAllen-Edinburg-Mission, TX (MSA)191 Laredo, TX (MSA)196 Tyler, TX (MSA)208 El Paso, TX (MSA)219
7 Houston-Sugar Land-Baytown, TX (MSA)8 Austin-Round Rock, TX (MSA)39 San Antonio, TX (MSA)43 Killeen-Temple-Fort Hood, TX (MSA)125 Corpus Christi, TX (MSA)153 McAllen-Edinburg-Mission, TX (MSA)191 Laredo, TX (MSA)196 Tyler, TX (MSA)208 El Paso, TX (MSA)219")
17
Texas Metropolitan Areas Metropolitan Areas2008 College Station-Bryan, TX (MSA)225 Longview, TX (MSA)230 Waco, TX (MSA)243 Texarkana, TX-Texarkana, AR (MSA)251 Corpus Christi, TX (MSA)253 Victoria, TX (MSA)269 Wichita Falls, TX (MSA)274 Midland, TX (MSA)281 Beaumont-Port Arthur, TX (MSA)292 Brownsville-Harlingen, TX (MSA)308
225 Longview, TX (MSA)230 Waco, TX (MSA)243 Texarkana, TX-Texarkana, AR (MSA)251 Corpus Christi, TX (MSA)253 Victoria, TX (MSA)269 Wichita Falls, TX (MSA)274 Midland, TX (MSA)281 Beaumont-Port Arthur, TX (MSA)292 Brownsville-Harlingen, TX (MSA)308")
18
Texas Metropolitan Areas Metropolitan Areas2008 Odessa, TX (MSA)312 Sherman-Denison, TX (MSA)331 Lubbock, TX (MSA)349 San Angelo, TX (MSA)352 Abilene, TX (MSA)359
312 Sherman-Denison, TX (MSA)331 Lubbock, TX (MSA)349 San Angelo, TX (MSA)352 Abilene, TX (MSA)359")
19
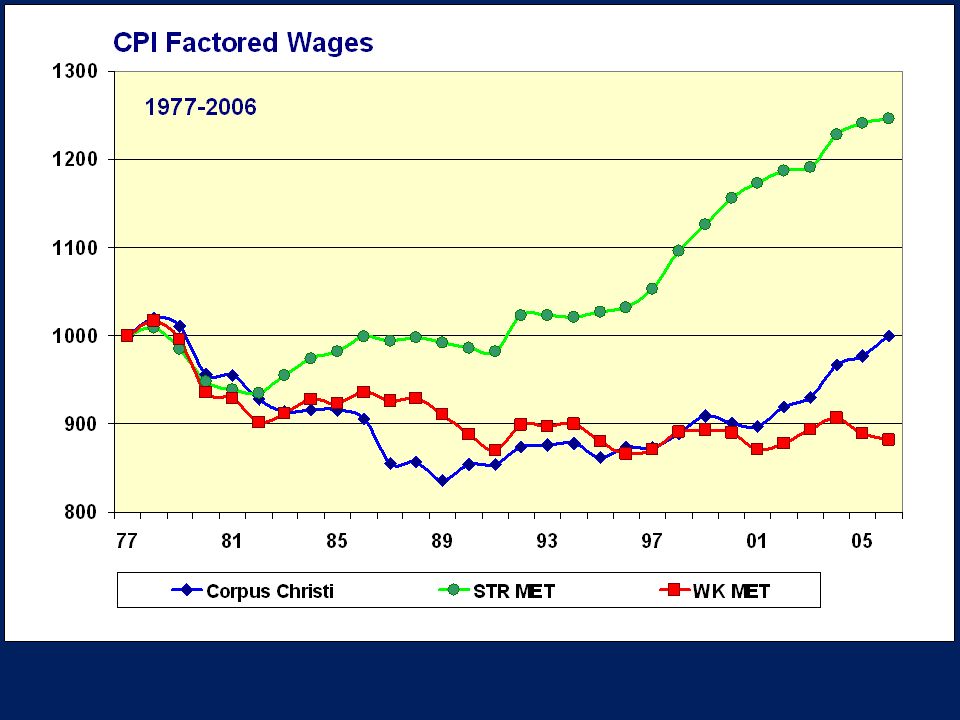
Corpus Christi Economy

20
Economic Strength Rankings Economic Strength 20042005200620072008 Corpus Christi 244236193161153 Brownsville-Harlingen292331300283308 Laredo221219232211196 McAllen-Edinburg-Mission194172184185191 Victoria314341295276269

21
2006 Growth Ranking 2002 363 Metropolitan Areas Population225 Employment172 Earnings75 Annual Wages 29 Number of NF Proprietors 238 Per Capita Personal Income 21 Per Capita Government Transfers 47

22
Actual Amount 2006Rank 363 Metropolitan Areas Population413,365114 Annual Wages 41,934131 Per Capita Personal Income 31,464191 Per Capita Government Transfers 5,683134 Per Capita Medicare 1,430106 Per Capita Retire Trans 1,669256 Per Capita Welfare - Actual 75638 Per Capita Medicaid 1,23589

23
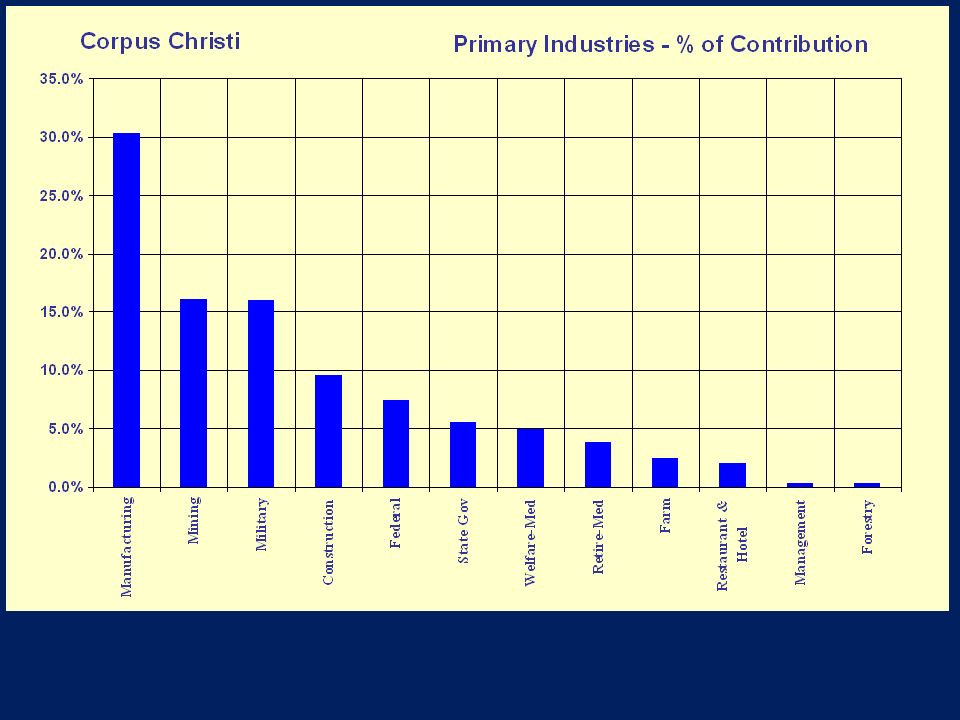
Primary Industries % of Contribution

29
How To Improve a Local Economy Create more primary industry jobs which pay a wage higher than the area average.

30
EconomicDevelopment

31
Economic Development The process which improves the standard of living for the people who live and work in an area.

32
Existing Industry Recruitment Start-Up

33
Economic Development Goal Setting Study 2005

34
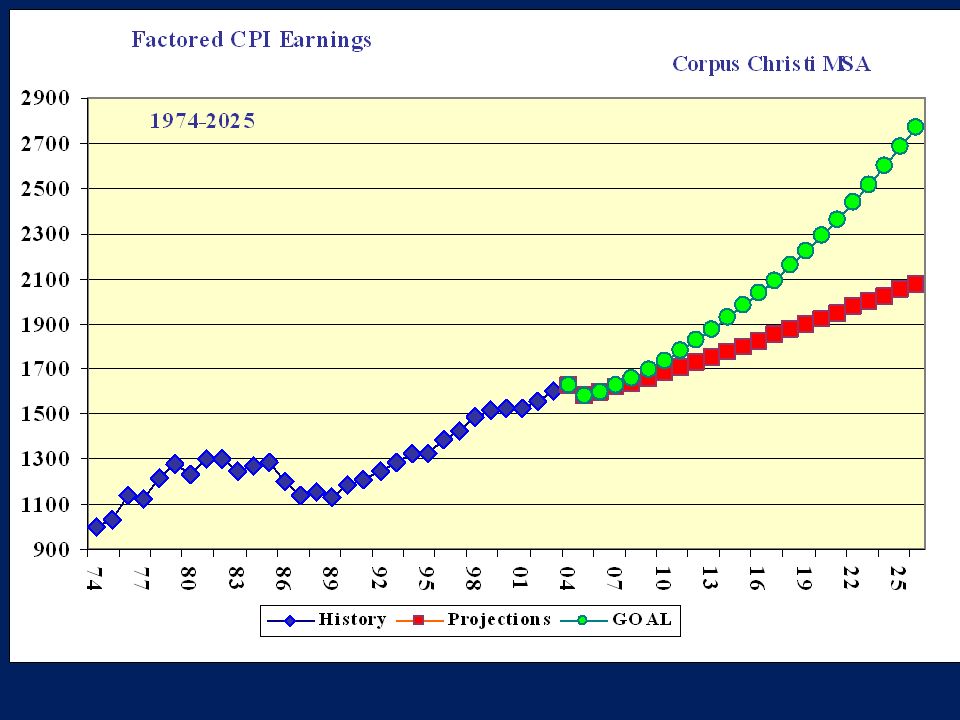
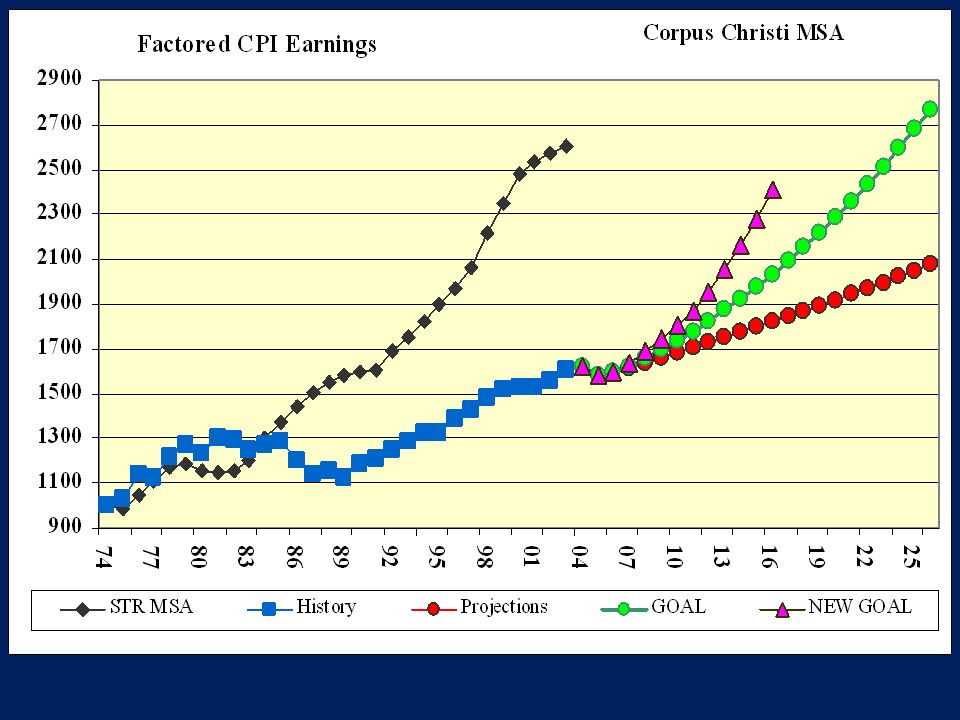
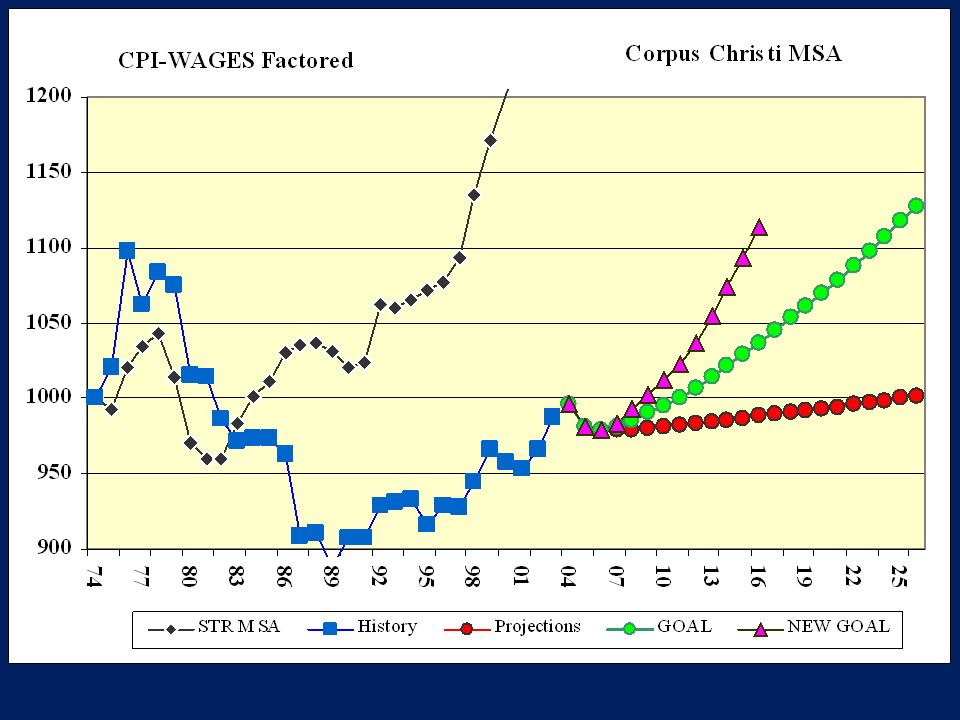
ProjectionsandGoal

37
Annual Milestones

38
New Area% OF PrimaryJobAvg.Area YearJobsWage Avg. 200618044,55832,904135% 200733946,41033,796137% 200849747,79834,830137% 200951048,82335,897136% 201052349,87536,998135% 201153650,95438,135134% 201257052,95139,357135% 201360555,03840,668135% 201462256,43142,025134% 201563957,86243,427133%

39
PerformanceEvaluation

40
REGION 2005 NAICS DescriptionJobsEarningsWages Total - All Workers168,4295,553,965,19432,975 Total - Private Sector136,1904,377,442,24532,142 Primary Industries21,1581,132,877,61853,544 Mining2,884161,136,67455,873 Utilities57638,414,98966,693 Construction Manufacturing10,350594,192,53557,409 Wholesale Trade2,975143,624,66648,275 Retail Trade Transportation and Warehousing1,37362,703,82245,676 Information1,08737,983,74534,939 Finance and Insurance75135,694,64047,529 Professional, Scientific, and Technical Services1,00049,581,06049,595 Management of Companies and Enterprises1629,545,48758,923

41
REGION 2006 NAICS DescriptionJobsEarningsWagesVarienceWage Prim Total - All Workers171,6416,075,856,84435,3993,212Jobs Total - Private Sector139,0784,831,635,16134,7402,888Gained Primary Industries21,8501,277,379,57558,46269260,503 Mining2,829187,186,97266,167-55Percent Utilities55940,757,64772,960-17of area Constructionaverage Manufacturing11,108690,303,27162,146758171% Wholesale Trade2,963148,767,93150,202-12 Retail TradeWage Transportation and Warehousing1,43170,167,42949,02059Prim Information94131,092,85133,059-147Jobs Finance and Insurance72136,418,87950,512-30Lost Professional, Scientific, and Technical Services1,10961,087,32655,07310945,482 Management of Companies and Enterprises18911,597,27061,36127

42
REGION 2007 NAICS DescriptionJobsEarningsWagesVarienceWage Prim Total - All Workers175,3826,511,217,57237,1263,741Jobs Total - Private Sector142,6925,197,265,12836,4233,614Gained Primary Industries22,4641,352,423,69560,20461461,689 Agriculture, Forestry, Fishing and Hunting Mining3,218225,160,71469,969389Percent Utilities69150,772,38373,474132of area Construction0average Manufacturing10,854687,090,57963,306-254166% Wholesale Trade3,134162,466,37651,837171 Retail Trade31862,69727,82931Wage Transportation and Warehousing1,55878,541,75950,409127Prim Information94830,591,51332,2648Jobs Finance and Insurance66437,019,25455,752-57Lost Professional, Scientific, and Technical Services1,18366,657,57456,3387462,122 Management of Companies and Enterprises18313,260,84772,464-6

43
Annual Milestones

44
Corpus Christi MSA PrimaryNet GainVarianceNewVariance JobforfromMilestoneJobfrom YearMilestoneYearMilestoneCumulWage Milestone 2006180692511 32,90460,50327,600 200733961427578633,79661,68927,893

45
Economic Impact Economic Impact (Minimum) New Primary Jobs 1,306 Additional Jobs 2,220 Total Jobs 3,526 Community Payrolls 114,928,000 Taxable Retail Sales 169,780,000 Local Government Taxes 11,492,800 Economic Impact (Transactions) 718,300,000
 New Primary Jobs 1,306 Additional Jobs 2,220 Total Jobs 3,526 Community Payrolls 114,928,000 Taxable Retail Sales 169,780,000 Local Government Taxes 11,492,800 Economic Impact (Transactions) 718,300,000")
46
Much More Aggressive Goal

47
Current GoalAggressive Goal New PrimaryJobNEWJob YearJobsWageGOALWage 200849747,7981,05848,310 200951048,8231,17550,415 201052349,8751,26053,995 201153650,9541,38557,147 201257052,9511,64160,283 201360555,0381,75263,906 201462256,4311,91467,132 201563957,8622,06670,971 201665659,3311,08974,942

50
Amarillo PrimaryAverage 2006 and 2007 JobsWage Corpus Christi 1,30661,061 Amarillo2,09850,242

51
Corpus Christi can become the next great economy in Texas.

Similar presentations


 Estimates George K. Downey Understanding Regional Economic Data for Policy and Planning—Dallas, Texas September 8,>")


