Download presentation
Presentation is loading. Please wait.

1
OA Cancelled due to technical difficulties… OA Cancelled due to technical difficulties… Tonight’s HW is A2: 541(11b = PANIC and 11d) We will start using the books next Friday!
 We will start using the books next Friday!")
2
Chapter 23: Confidence Intervals for a Population Mean In addition to using interval estimates for population proportions (p), we can also use confidence intervals to estimate the true value of a population mean (µ).
, we can also use confidence intervals to estimate the true value of a population mean (µ).")
4
Thus far, we have been using z-critical values from the normal distribution to make our confidence intervals.

5
Now, remember that a z-score is calculated as

7
If you have your book open it to the back and look at it now. You will get t-tables on the AP exam and can also find them in the back of your book.

9
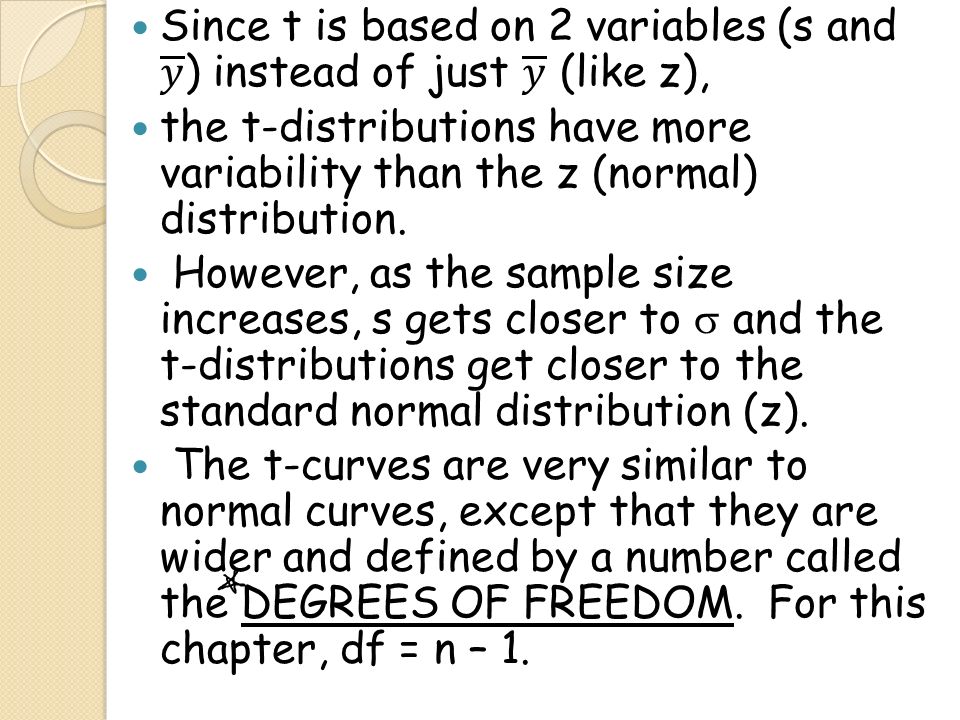
Properties of the t-distributions: The t-curve corresponding to any fixed number of degrees of freedom (df) is bell-shaped, symetric and centered at 0. Each t-curve is more spread out than the z-curve (standard normal curve). As the df increase, the spread of the corresponding t-curve decreases. As the number of df increases, the t- curves get closer to the z-curve.
. As the df increase, the spread of the corresponding t-curve decreases. As the number of df increases, the t- curves get closer to the z-curve..")
10
T-curves are wider than the z-curve, so we must go further than 1.96 SD to capture 95% of the area. To find out how far, we use a t-critical value from the t- table. If df = 20 and you want 95% confidence, what t-critical value should you use? Thus, to capture the middle 95% of the t- distribution with 20 df, you must go out 2.086 stdev. 2.086

11
Find the t critical values for the following: a. 95% confidence with n = 10 b. 90% confidence with n = 25 c. 99% confidence with n = 100 When using the t-table and the df you want are not provided, round down to the nearest df given. 2.262 1.711 2.369

12
Suppose that a machine is designed to produce bolts that have a diameter of 5 mm. Every hour a random sample of 15 bolts is selected and a 95% confidence interval for the mean diameter is constructed. If there is evidence that ≠ 5, the machine is adjusted. In one particular sample, the mean diameter was 5.08 mm with a standard deviation of 0.11 mm. Calculate the interval and decide if you need to adjust the machine. It is asking for a confidence interval, what should we do?

14
That’s right, PANIC!

15
P: We want to estimate the true mean bolt diameters that the machine is producing ( D ). A: We have a random sample of 15 bolts. With a SRS, each bolt diameter is independent of the other. Assuming there are at least 150 bolts produced each hour, our sample is less than 10% of the population. LEN - …

16
3 ways to satisfy LEN: 1) Data comes from a normal population 2) Graphed data is unimodal and symmetric 3) n > 30 None of these are true but… LEN: It is reasonable to assume that bolt diameters produced by the machine are normally distributed.
 Data comes from a normal population 2) Graphed data is unimodal and symmetric 3) n > 30 None of these are true but… LEN: It is reasonable to assume that bolt diameters produced by the machine are normally distributed.")
17
N: The conditions for a 95% 1-sample t interval have been met. DF = 14.

20
Tonight’s HW: A2: 541(11b, d) & stay safe…
 & stay safe…")
Similar presentations


 2004 Brooks/Cole, a division of Thomson Learning, Inc. Chapter 7 Statistical Intervals Based on a Single Sample.>")

 (Small Samples)>")

>")


 and the sample size is sufficiently large, then we know the.>")


 to approximate a population parameter. –the sample mean is the best point.>")


