Download presentation
Presentation is loading. Please wait.

1
Univariate Graphs III Review Create histogram from Commands Window. Multipanel histogram. Quantile Plots Quantile-Normal Plots Quantile-Quantile Plots

2
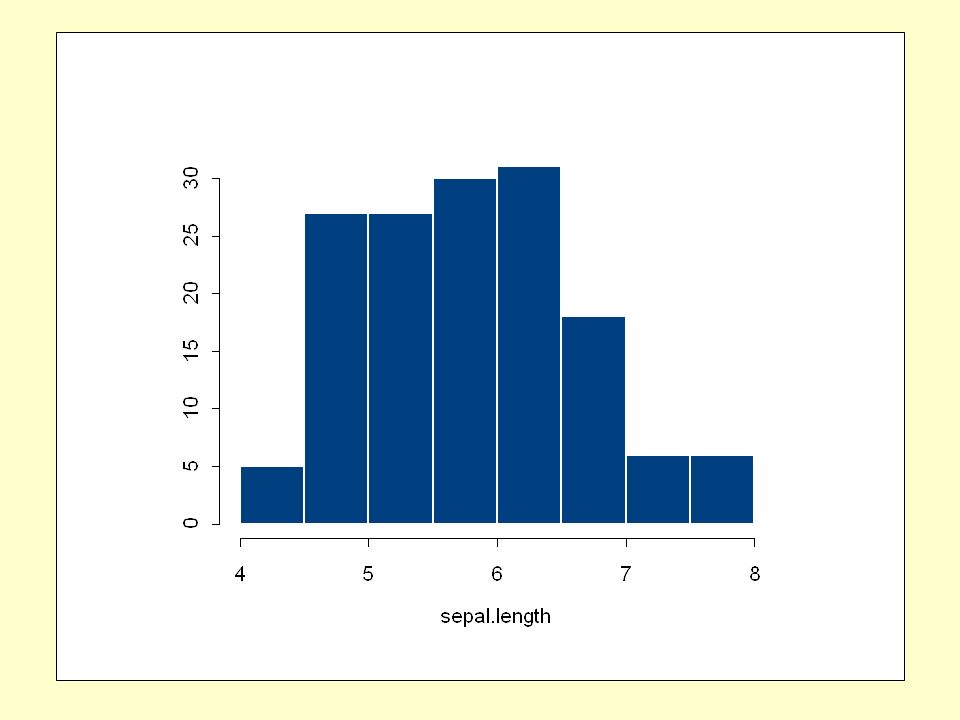
Histogram from Commands From the Command Window type graphsheet(height=6.4,width=7.5) hist(iris$sepal.length, nclass=10, xlab="sepal.length") Graphs from the Commands Window are fixed unless… Right click on the histogram and select Convert to Objects. Now you can change the axis scales, etc.

4
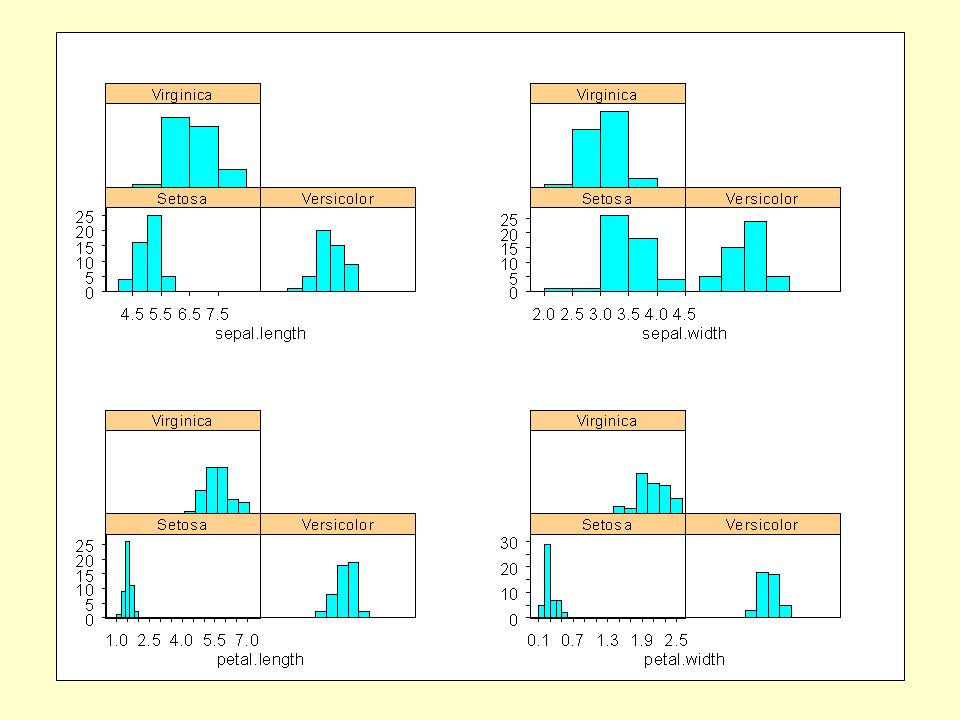
Multipanel Histogram In the Iris data window, select sepal.length and then CTRL select variety. Using the Graph->Multipanel menu, plot a Histogram. Note that under Conditioning Columns, the column list is variety Try changing the number of rows and columns in the layout to be 2 by 2

7
Multipanel Histogram for Several Variables In the Iris data window, select sepal.width and then CTRL select variety. Using the Graph->Multipanel menu, plot a Histogram. Select the same Graphsheet as was used for the previous histogram

10
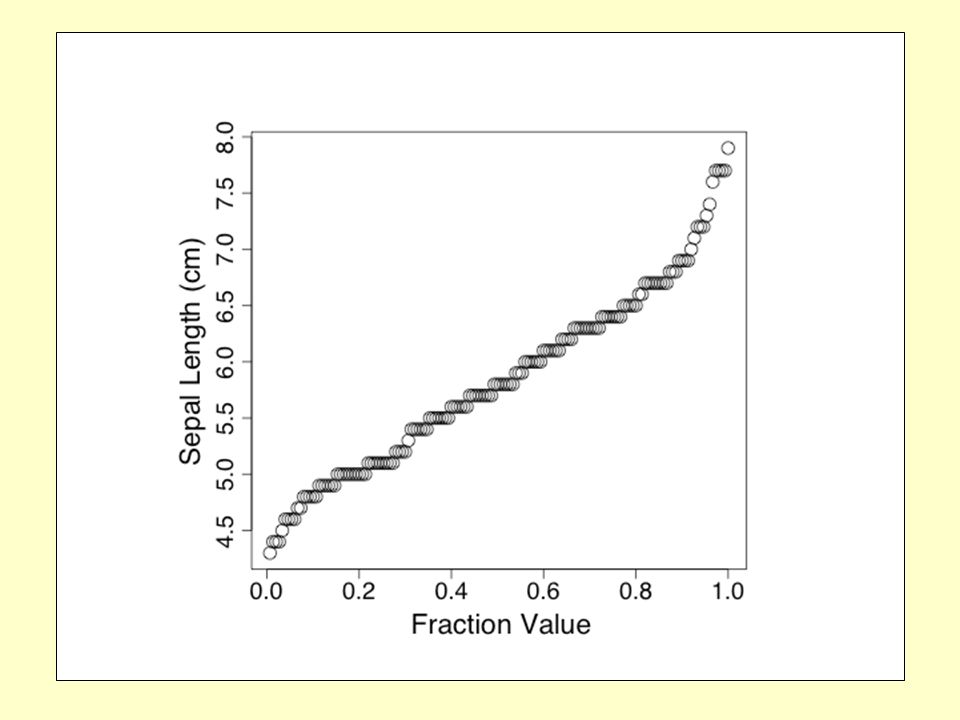
Quantile Plots A Quantile Plot graphs the value of each observation against the fraction of observations that are equal to or less than that observation where i is the index of the observation in a sorted list from i = 1 to N

11
Quantile Plot of Sepal Length graphsheet(height=6.4,width=6.4) tLength <- length(iris$sepal.length) plot(c(1:tLength)/tLength, sort(iris$sepal.length), xlab = "Fraction Value", ylab="Sepal Length (cm)")
 tLength <- length(iris$sepal.length) plot(c(1:tLength)/tLength, sort(iris$sepal.length), xlab = Fraction Value , ylab= Sepal Length (cm) )")
13
Quantile Plot of Sepal Length graphsheet(height=6.4,width=6.4) qqmath(~ sepal.length, distribution=qunif, data=iris, aspect=1, xlab = "Fraction Value", ylab="Sepal Length (cm)")
 qqmath(~ sepal.length, distribution=qunif, data=iris, aspect=1, xlab = Fraction Value , ylab= Sepal Length (cm) )")
15
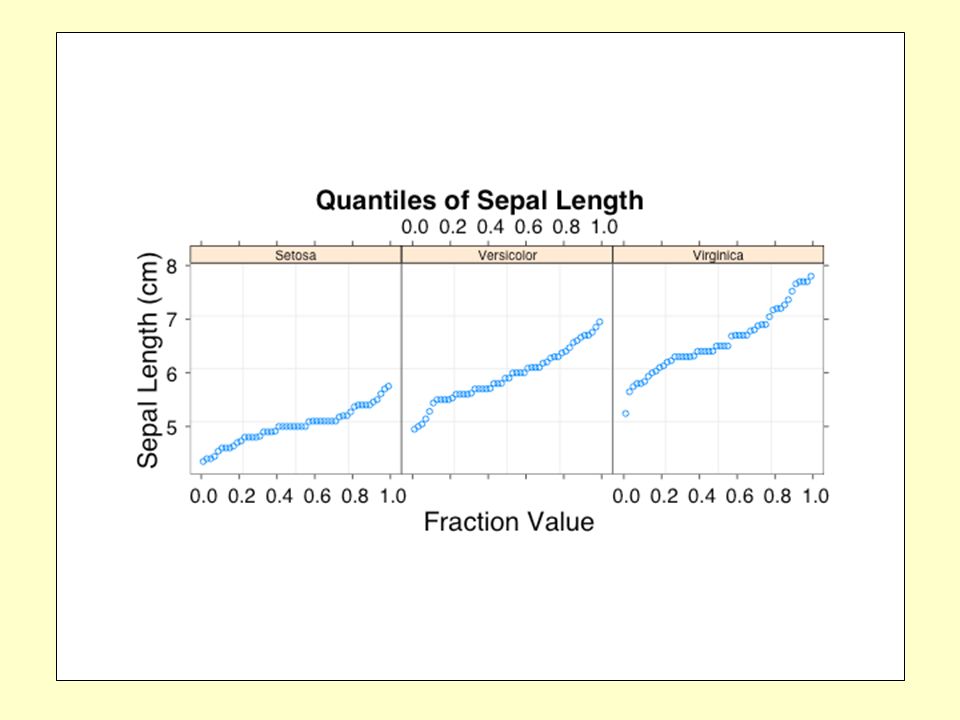
Quantile Plot of Sepal Length graphsheet(height=4,width=7.5) qqmath(~ sepal.length | variety, distribution=qunif, data=iris, panel = function(x, y) { panel.grid() panel.xyplot(x, y) }, layout=c(3,1), aspect=1, xlab = "Fraction Value", ylab="Sepal Length (cm)")
 qqmath(~ sepal.length | variety, distribution=qunif, data=iris, panel = function(x, y) { panel.grid() panel.xyplot(x, y) }, layout=c(3,1), aspect=1, xlab = Fraction Value , ylab= Sepal Length (cm) )")
17
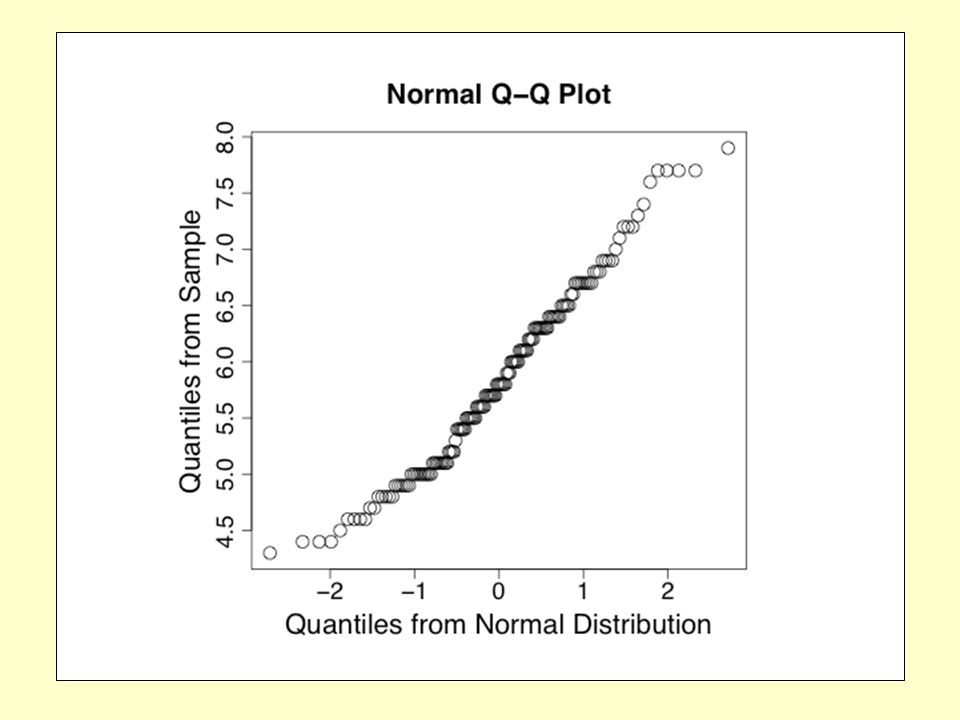
Quantile-Normal Plot Using Menus In the Iris data window, select sepal.length. Using the Graph->2D menu, select a Q-Q Plot. Right click on the graph, select Position/Size and then set the Aspect Ratio to 1.

19
Quantile-Normal Plot graphsheet(height=6.4,width=6.4) qqnorm(iris$sepal.length, xlab = "Quantiles from Normal Distribution", ylab = "Quantiles from Sample")
 qqnorm(iris$sepal.length, xlab = Quantiles from Normal Distribution , ylab = Quantiles from Sample )")
21
Quantile-Normal Trellis Plot graphsheet(height=6.4,width=6.4) qqmath(~ sepal.length, distribution=qnorm, data=iris, prepanel = prepanel.qqmathline, panel = function(x, y) { panel.qqmathline(y, distribution = qnorm) panel.qqmath(x, y) }, aspect=1, xlab = "Normal Distribution", ylab="Sepal Length (cm)")
 qqmath(~ sepal.length, distribution=qnorm, data=iris, prepanel = prepanel.qqmathline, panel = function(x, y) { panel.qqmathline(y, distribution = qnorm) panel.qqmath(x, y) }, aspect=1, xlab = Normal Distribution , ylab= Sepal Length (cm) )")
23
Quantile-Normal Trellis Plot graphsheet(height=6.4,width=6.4) qqmath(~ sepal.length | variety, distribution=qnorm, data=iris, prepanel = prepanel.qqmathline, panel = function(x, y) { panel.qqmathline(y, distribution = qnorm) panel.qqmath(x, y) }, aspect=1, layout=c(2,2), xlab = "Normal Distribution", ylab="Sepal Length (cm)")
 qqmath(~ sepal.length | variety, distribution=qnorm, data=iris, prepanel = prepanel.qqmathline, panel = function(x, y) { panel.qqmathline(y, distribution = qnorm) panel.qqmath(x, y) }, aspect=1, layout=c(2,2), xlab = Normal Distribution , ylab= Sepal Length (cm) )")
25
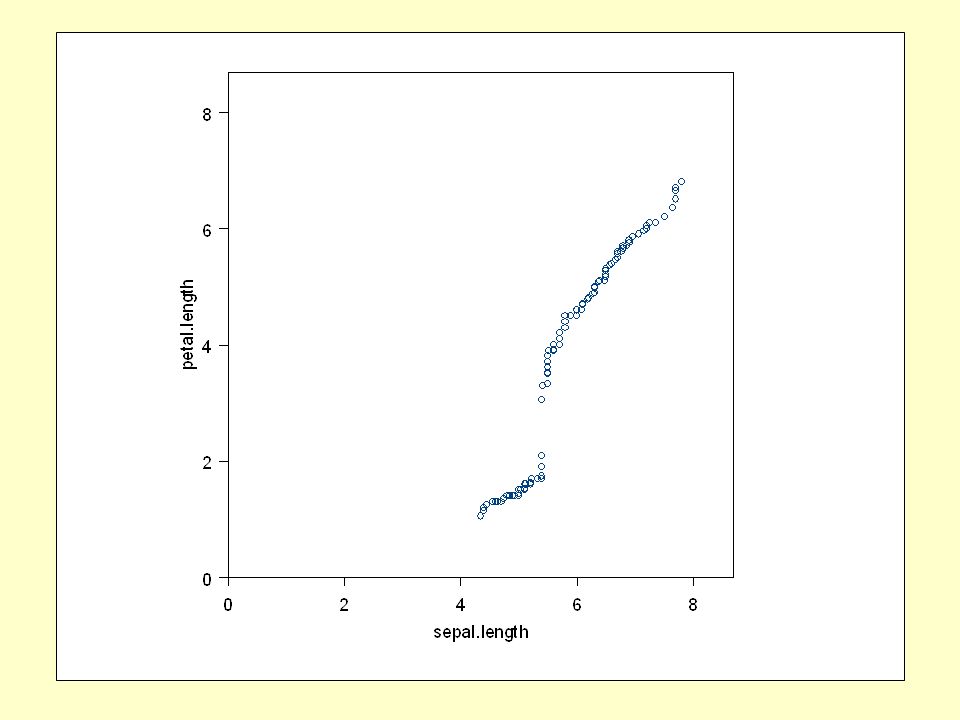
Quantile-Quantile Plot Using Menus In the Iris data window, select sepal.length. CTRL select petal.length Using the Graph->2D menu, select a Q-Q Plot. Right click on the graph, select Position/Size and then set the Aspect Ratio to 1.

27
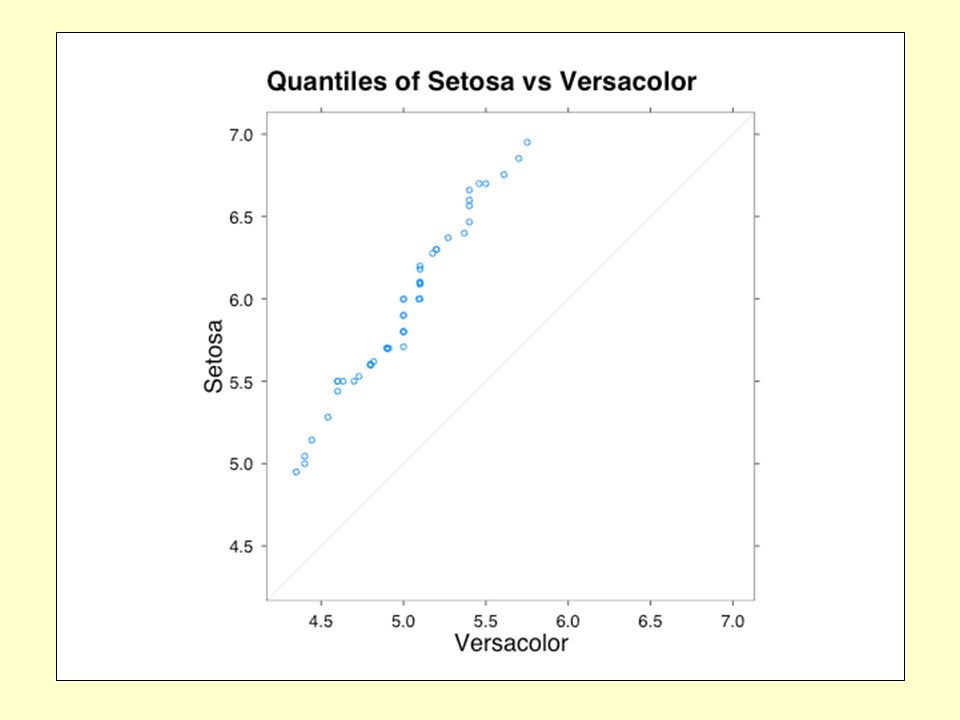
Quantile-Quantile Trellis Plot graphsheet(height=6.4,width=6.4) qq(variety ~ sepal.length, data=iris, subset = variety=="Setosa" | variety=="Versicolor", aspect=1)
 qq(variety ~ sepal.length, data=iris, subset = variety== Setosa | variety== Versicolor , aspect=1)")
29
For Thursday Read A Tour of Trellis Graphics pp 1-17 (download from the following web page) http://cm.bell-labs.com/cm/ms/departments/ sia/project/trellis/software.writing.html Reaction papers are due October 3rd.
 sia/project/trellis/software.writing.html Reaction papers are due October 3rd.")
Similar presentations


>")

151 231 2284 CMPDLLM002 Research Methods Lecture 9: Quantitative.>")


 1 Descriptive statistics (cont.) Lecturer: Smilen Dimitrov Applied statistics for testing and evaluation – MED4.>")


