Download presentation
Presentation is loading. Please wait.

1
Macro Chapter 8 Economic Fluctuations, Unemployment, and Inflation

3
5 Learning Goals 1)Characterize fluctuations in economic growth. 2)Relate fluctuations in GDP to employment and the demand for labor. 3)Classify unemployment into three categories. 4)Distinguish the difference between full employment and the natural rate of unemployment and correlate both to potential GDP. 5)Determine inflation’s effect on the economy.
Relate fluctuations in GDP to employment and the demand for labor. 3)Classify unemployment into three categories. 4)Distinguish the difference between full employment and the natural rate of unemployment and correlate both to potential GDP. 5)Determine inflation’s effect on the economy..")
4
Overall Goals and Objectives In Chapters 7 & 8, we are measuring and monitoring the major economic indicators of the economy. Is GDP rising or falling? By how much? Is employment rising or falling? By how much? Are prices rising or falling? By how much? What are the relationships between GDP, employment, and prices?

5
Class Activity: Identify at least two products that are made in 2014 that you don’t think will be made in 2024. Briefly explain why you think they won’t be produced any longer.

6
Swings in the Economic Pendulum

7
The Business Cycle See Exhibit 1 on p. 153 and Exhibit 2 on p. 154

8
Instability in the Growth of Real GDP: 1960-2013 Although real GDP in the United States has grown at an average rate of approximately 3%, the growth has been characterized by economic ups-and-downs. Note: periods of recession are indicated with shading. Annual Rate of Growth in Real GDP (long-run growth rate approximately 3%) Source: Economic Report of the President, various issues. 19601965197019751980198519901995200020052013 -4% -2% 0% 2% 4% 6% 8%
 Source: Economic Report of the President, various issues % -2% 0% 2% 4% 6% 8%.")
9
The four phases of the business cycle are expansion, peak, contraction, and recessionary trough. Time Real GDP Business peak Recessionary trough Contraction Expansion The Hypothetical Business Cycle Business peak Recessionary trough Trend line

10
Key Points: 1)The business cycle varies and is unpredictable 2)The average annual growth rate is 3%
The business cycle varies and is unpredictable 2)The average annual growth rate is 3%")
11
Economic Fluctuations and the Labor Market

12
Transmitter Question next

13
Q8.1 A person not working is considered unemployed. 1.True 2.False 30

14
This section describes the categories of people Total population divided into two categories: –(1) Under age 16 & institutionalized people –(2) Over age 16 Over age 16 divided into two categories: –(1) Not in labor force – students, retirees, disabled –(2) In labor force In labor force divided into two categories: –(1) Employed –(2) Unemployed, but want to be employed
 Under age 16 & institutionalized people –(2) Over age 16 Over age 16 divided into two categories: –(1) Not in labor force – students, retirees, disabled –(2) In labor force In labor force divided into two categories: –(1) Employed –(2) Unemployed, but want to be employed")
15
Definition of unemployed: A person not currently employed but (1) actively seeking a job, or (2) waiting to begin or return to a job See BLS FAQs BLS FAQsBLS FAQs
 actively seeking a job, or (2) waiting to begin or return to a job See BLS FAQs BLS FAQsBLS FAQs")
16
U.S. Population, Employment, and Unemployment Civilian population 16 and over Civilian labor force Employed Employees Self-employed workers Unemployed New entrants Reentrants Lost last job Quit last job Laid off Not in the labor force Household workers Students Retirees Disabled Labor Force Participation Rate = Civilian labor force Civilian population (16+) Employment / Population Ratio = Number employed Civilian population (16+) Rate of Unemployment = Number unemployed Civilian labor force
 Employment / Population Ratio = Number employed Civilian population (16+) Rate of Unemployment = Number unemployed Civilian labor force.")
17
See Current Population Survey Current Population SurveyCurrent Population Survey

18
Class Activity: Recall the two products you predicted wouldn’t be produced in 2024. Is it “good” or “bad” that those products won’t be made any longer? Why?

19
Transmitter question next

20
Q8.2 Mary is a homemaker. Last week, she was busy with her normal household activities. She is 1.a member of the civilian labor force who is employed. 2.a member of the civilian labor force who is unemployed. 3.a member of the civilian labor force who is underemployed. 4.a discouraged worker who is not a member of the labor force. 5.not a member of the labor force. 60

21
Three calculations to know 1)Labor force participation rate = (employed + unemployed) / civilian pop. over age 16 2)Unemployment rate = unemployed / (employed + unemployed) OR unemployed / labor force 3)Employment / population ratio = employed / civilian pop. over age 16
Unemployment rate = unemployed / (employed + unemployed) OR unemployed / labor force 3)Employment / population ratio = employed / civilian pop. over age 16.")
22
Transmitter Question Next

23
Q8.3 Which of the following would be officially classified as unemployed? 1.a school administrator who has been working as a substitute teacher one day per week while looking for a full-time job in administration 2.a mathematician who returned to graduate school after failing to find a job the last four months 3.a 60-year-old former steel worker who would like to work but has given up actively seeking employment 4.a laid-off construction worker waiting to return to a previous job 60

24
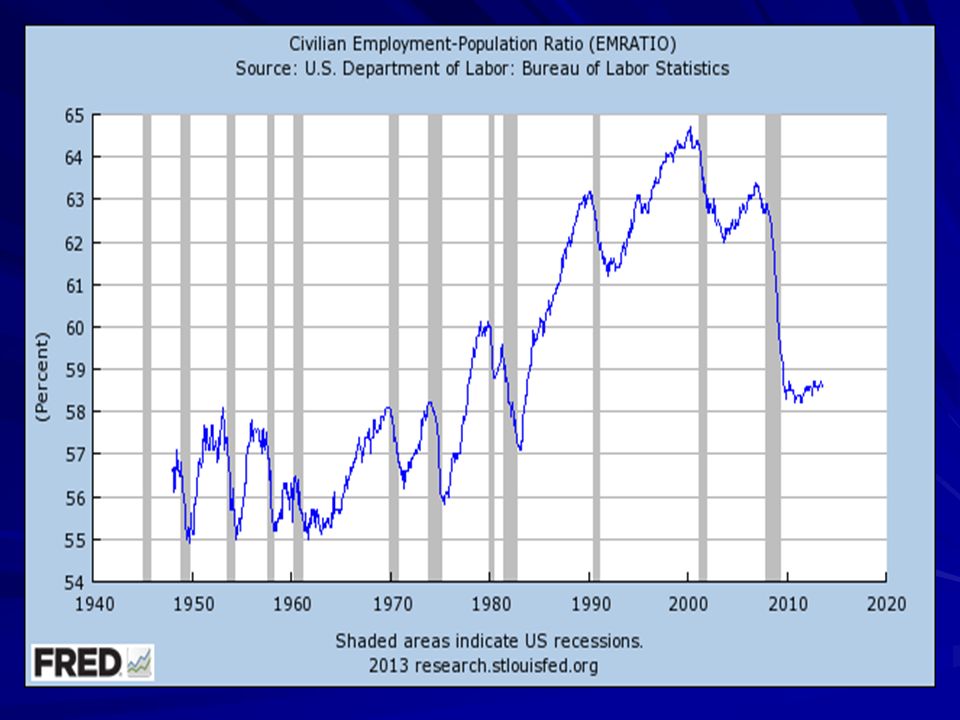
Historical employment/population ratio:

26
Historical labor force participation rate:

28
Historical unemployment rate:

30
Why are you at FSU? Here’s one reason:

32
Please see article “15 Statistics about the jobs market.pdf” on Blackboard 15 Statistics about the jobs market.pdf15 Statistics about the jobs market.pdf

33
In 2009, the unemployment rate peaked at 10.0% in October. It was so bad, events like this started to happen.

35
The unemployment rate climbed to 8.3% in February, 2009. It stayed over 8% until September, 2012 (that’s 43 months). The previous longest streak above 8% was 27 months, from 1981 to 1984. The unemployment rate climbed to 9.0% in April, 2009. It stayed over 9% until September, 2011 (except for March, 2011 at 8.9%). That’s 29 out of 30 months. The previous longest streak above 9% was 19 months, from 1982 to 1983.
. The previous longest streak above 8% was 27 months, from 1981 to The unemployment rate climbed to 9.0% in April, It stayed over 9% until September, 2011 (except for March, 2011 at 8.9%). That’s 29 out of 30 months. The previous longest streak above 9% was 19 months, from 1982 to")
36
Mathemagics! A declining unemployment rate suggests the labor market and the economy are improving. How can the unemployment rate decline while the employment conditions are actually getting worse?

37
Mathemagics! Some simple math: Suppose in August, 8 people are unemployed and 92 are employed (labor force = 100) Unemployment rate = 8 / 100 = 8.0% Suppose in September, 7 people are unemployed and 87 are employed (6 people left the labor force; labor force = 94) Unemployment rate = 7 / 94 = 7.4%
 Unemployment rate = 8 / 100 = 8.0% Suppose in September, 7 people are unemployed and 87 are employed (6 people left the labor force; labor force = 94) Unemployment rate = 7 / 94 = 7.4%.")
38
Mathemagics, but… What happens to the country’s PPC? What happens to the country’s economic growth potential? What happens to the country’s income growth potential?

39
Three Types of Unemployment

40
3 general reasons why people are unemployed: (1) Frictional – imperfect information (2) Structural – workers don’t possess desired skills
 Frictional – imperfect information (2) Structural – workers don’t possess desired skills")
42
3 general reasons why people are unemployed: (1) Frictional – imperfect information (2) Structural – workers don’t possess desired skills (3) Cyclical – result of business cycle
 Frictional – imperfect information (2) Structural – workers don’t possess desired skills (3) Cyclical – result of business cycle")
44
Video:

46
Transmitter Questions Next

48
Q8.4 How would you classify Stewie? 1.Structurally unemployed 2.Frictionally unemployed 3.Cyclically unemployed 4.Seasonally unemployed 5.Not in labor force 30

51
Q8.5 How would you classify Spicoli? 1.Structurally unemployed 2.Frictionally unemployed 3.Cyclically unemployed 4.Seasonally unemployed 5.Not in labor force 30

54
Q8.6 How would you classify Harry and Lloyd? 1.Structurally unemployed 2.Frictionally unemployed 3.Cyclically unemployed 4.Seasonally unemployed 5.Not in labor force 30

55
Employment Fluctuations- The Historical Record

56
Proposal to reduce unemployment: Recall those two goods you predicted wouldn’t be produced in 2024. I propose we make it illegal to lay off those workers. Keep them employed making those goods.

57
Class Activity: What do you think will happen to the people who used to make the two products you predicted wouldn’t be produced in 2024? Will they ever work again?

58
Transmitter Question Next

59
Q8.7 Which of the following is a positive effect of job search and the unemployment that often accompanies it? 1.It keeps wages and income levels low. 2.It permits individuals to better match their skills and preferences with the requirements of a job. 3.It reduces the wage gap between high skill workers and those with few skills. 4.It creates political pressure for an increase in the minimum wage, which will reduce the rate of unemployment in the long run. 60

60
Some unemployment is unavoidable and arguably desirable Natural rate of unemployment: “normal” frictional and structural unemployment The natural rate occurs when the economy is operating at a sustainable rate Full employment is when the natural rate of unemployment exists Natural rate equals about 5%

61
Transmitter question next

62
Q8.8 Full employment is the situation in which the economy operates at an unemployment rate equal to the sum of 1.structural and frictional unemployment. 2.cyclical and frictional unemployment. 3.structural and cyclical unemployment. 4.structural, frictional, and cyclical unemployment. 60

63
Other proposals to reduce unemployment: These would create jobs, but would they create value to an economy?

64
Actual and Potential GDP

65
Potential output is the economy’s maximum sustainable output; occurs when the natural rate of unemployment exists; occurs when full employment exists Potential output is perhaps best thought of as the 3% growth rate discussed earlier Actual output can be greater than or less than potential; again, think about the actual growth rate

66
Trend line = maximum sustainable rate Business Cycle = actual output Time Real GDP Business peak Recessionary trough Contraction Expansion Business peak Recessionary trough Trend line

67
19601965197019751980198519901995200020052013 2,000 4,000 6,000 8,000 10,000 12,000 14,000 1970 recession 1974-75 recession 1980 recession 1982 recession 1990-91 recession 2001 recession 1960 recession 2008-10 recession Potential GDP 16,000 Actual and Potential GDP, 1960-2013 Here we illustrate both actual GDP & potential GDP. Note the gap between actual and potential GDP during periods of recession. Real GDP (billions of 2005 $) Source: http://www.bls.gov Actual GDP
 Source: Actual GDP.")
68
Another way to think about these: When you read the BEA report about quarterly GDP, if the reported (actual) growth rate is near 3%, then the economy is at it’s potential output. At 3% actual growth, the unemployment rate will likely be around 5% (i.e. full employment is 95%) The economy can never eliminate frictional and structural unemployment for an extended period.
 The economy can never eliminate frictional and structural unemployment for an extended period..")
69
Transmitter Question Next

70
Q8.9 Actual GDP will be below potential GDP 1.when the economy is at full employment. 2.during an economic boom. 3.when resources are fully utilized. 4.during a recession. 60

71
The Effects of Inflation

72
The Inflation Rate, 1956-2013 Between 1956 and 1965, the general price level increased at an average annual rate of only 1.6%. In contrast, the inflation rate averaged 9.2% from 1973 to 1981, reaching double-digits during several years. Since 1982, the average rate of inflation has been lower (2.9% from 1983-2013) and more stable. 19561960196519701975198019851990199520002005 -5% 5% 10% 15% 0% 1983-2013 average inflation rate = 2.9 % 1956-1965 average inflation rate = 1.6 % 1973-1981 average inflation rate = 9.2 % 2013
 and more stable % 5% 10% 15% 0% average inflation rate = 2.9 % average inflation rate = 1.6 % average inflation rate = 9.2 %")
73
See BLS CPI release BLS CPI releaseBLS CPI release

74
Transmitter question next

75
Q8.10 Suppose you received a 3 percent increase in your nominal wage. Over the year, inflation ran about 6 percent. Which of the following is true? 1.Your real wage fell. 2.Your nominal wage fell. 3.Both your nominal and real wages decreased. 4.Although your nominal wage fell, your real wage increased. 5.Both nominal and real wages increased. 60

76
Inflation is a persistent increase in the general level of prices

78
Case Study: Zimbabwe In February, 2008 a loaf of bread was 200,000 Zimbabwe dollars In August, 2008, that same loaf of bread was 1.6 trillion dollars That’s 11.2 million percent!

79
Video:

81
Why is inflation “bad”? 1)It reduces investment: long-term projects are more risky 2)It distorts information delivered by prices: relative prices are skewed because some prices adjust more quickly than others 3)It results in less productive use of resources: people will spend more time trying to combat the effects of inflation rather than engaging in productive activity
It reduces investment: long-term projects are more risky 2)It distorts information delivered by prices: relative prices are skewed because some prices adjust more quickly than others 3)It results in less productive use of resources: people will spend more time trying to combat the effects of inflation rather than engaging in productive activity.")
82
Key Points: The business cycle varies and is unpredictable Potential GDP = average annual growth rate = 3% Natural rate of unemployment = 5% (varies in reality, constant for our purposes) Natural rate of unemployment means cyclical unemployment = 0; frictional and structural unemployment remain When actual GDP > potential GDP, unemployment falls, upward pressure on prices When actual GDP < potential GDP, unemployment rises, downward pressure on prices Jobs are important, but the production from those jobs is more important (remember: more production first, higher incomes result)
 Natural rate of unemployment means cyclical unemployment = 0; frictional and structural unemployment remain When actual GDP > potential GDP, unemployment falls, upward pressure on prices When actual GDP < potential GDP, unemployment rises, downward pressure on prices Jobs are important, but the production from those jobs is more important (remember: more production first, higher incomes result)")
83
5 Learning Goals 1)Characterize fluctuations in economic growth. 2)Relate fluctuations in GDP to employment and the demand for labor. 3)Classify unemployment into three categories. 4)Distinguish the difference between full employment and the natural rate of unemployment and correlate both to potential GDP. 5)Determine inflation’s effect on the economy.
Relate fluctuations in GDP to employment and the demand for labor. 3)Classify unemployment into three categories. 4)Distinguish the difference between full employment and the natural rate of unemployment and correlate both to potential GDP. 5)Determine inflation’s effect on the economy..")
Similar presentations


 survey 60,000 households.>")
The value of output measured.>")